The Elfenbein Theory to Explain the Entire Stock Market
I had a little extra time this morning, so I’d thought I’d do a quick post that explains the entire stock market for you.
Before I begin, let me stress that I’m discussing generalities about how the stock market behaves. As you read this, I urge you to focus on the larger themes I’m discussing instead of getting bogged down in nitpicky details or in excessive demands for precision. Out of necessity, my explanation is over-generalized.
The first thing to understand is that the stock market is overwhelmingly influenced by interest rates. It’s difficult to overstate this key fact. More specifically, the stock market is ruled by long-term and short-term interest rates. Of the two, long-term rates are more influential.
A few years ago, I ran some through some historical data. I isolated all the days in which the 10-year Treasury yield closed lower. On those days, the stock market averaged an annualized gain of more than 42%.
The bond market leads the stock market. Whatever the bond market is doing, the stock market will likely do a few weeks or months later. The two assets are in constant battle for investors’ love. Their perpetual tug-of-war is at the heart of financial markets. Short-term rates are also important, and that’s why the Federal Reserve is so closely watched.
The movement of short-term and long-term rates also determines which types of stocks do well. When long-term interest rates rise, cyclical stocks tend to outperform the overall market. When long-term rates fall, defensive stocks tend to lead the market. Importantly, this is a short-term relationship that grows weaker as time wears on.
With short-term rates, we see a similar but slightly different effect. When short-term rates fall, value stocks outperform. When short-term rates rise, growth stocks tend to lead.
These are the two primary “dimensions” of the stock market (Cyclical/Defense, Value/Growth). These categories have some similarities, and they’re easily confused, but I want to highlight their differences. The Cyclical/Defense divide is fought over the future of the production part of the economy. Are we producing more than we’re consuming, or consuming more than we produce? The Value/Growth divide is about the financial part of the economy. How much inflation will there be, and what are real rates doing?
By Cyclical stocks, I mean stocks in sectors like Energy and Materials which are closely tied to the economic cycle. The Defensive sectors are areas such as Consumer Staples and Healthcare, which are areas that aren’t so hurt in downturns.
Value stocks are generally in high-dividend areas like REITs and Utilities. As short-term rates drop, investors naturally crave those dividends. Growth stocks tend to be in low-dividend areas like Tech and more inflation-sensitive sectors like Commodities and Gold Mining.
As I said, these two dimensions are related. They’re cousins in much the same way that short-term and long-term yields are cousins. Now with this background, let’s envision the market as a matrix with short-term rates on the horizontal axis and long-term rates on the vertical.
You can probably see where I’m going with this. We now have four quadrants. The upper right is when both long-term and short-term rates are rising. The lower left is when both ends are falling. The lower right is when short-term rates are rising and long-term rates are falling. In other words, the yield curve is getting narrower. The upper left is the opposite: the yield curve is getting wider.

When long- and short-term rates both rise, industrial stocks do well. When both rates fall, dividend stocks do well (more probably, they’re falling the least). When the yield curve widens, financial stocks do well. Bear in mind that a bank is basically the yield curve with incorporation papers. As the yield curve narrows, defensive stocks do well. Importantly, we’ll also see that when a particular quadrant behaves one way, one of its opposing quadrants will do the exact opposite.
Let me add a clarification. It may be the case that industrial stocks lead the market, not when short-term and long-term rates are literally moving in opposite directions, but when the spread is increasing. What the market is concerned with is the relative standing of short and long rates against each other.
With the four quadrants, the general stock market moves clockwise around the matrix. Quadrant I is the sweet spot of the rally. These stocks have a double-whammy effect: they outperform while the market itself is rallying. Hence the name cyclicals. Conversely, they underperform when the market is tanking (Quadrant III).
I should add that few stocks are pure breeds belonging solely to one quadrant. Typically, they have mixed DNA. For example, a stock like Chevron is a classic energy stock, but it also pays a generous dividend. You’ll also see healthcare stocks, which are classic defensive stocks, that are partly related to tech stocks.
As I mentioned before, these classifications are most important in the short term. As time goes on, the part of any stock which reflects its individual nature will become more prominent. Each day, two biotech stocks may track each other closely, but after five years, they can be miles apart. The more times that passes, the stronger this effect is.
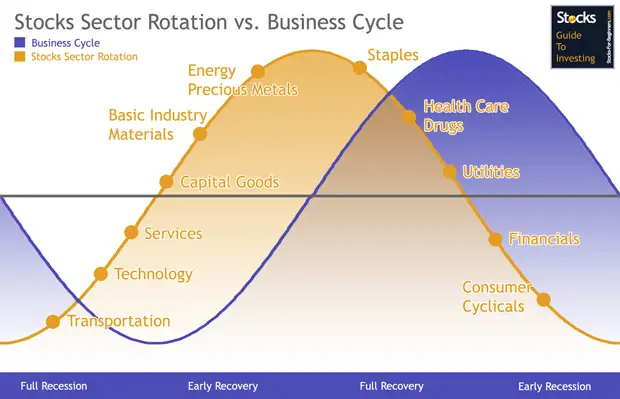
The idea that different sectors do better or worse at different points in the economic cycle is nothing new (see here and here). It’s been pointed out many times before. The Elfenbein Theory, however, is a way for investors to see an overriding framework for what drives this behavior.
(You can sign up for my free newsletter here.)
Posted by Eddy Elfenbein on May 19th, 2015 at 8:11 am
The information in this blog post represents my own opinions and does not contain a recommendation for any particular security or investment. I or my affiliates may hold positions or other interests in securities mentioned in the Blog, please see my Disclaimer page for my full disclaimer.
- Tweets by @EddyElfenbein
-
-
Archives
- April 2024
- March 2024
- February 2024
- January 2024
- December 2023
- November 2023
- October 2023
- September 2023
- August 2023
- July 2023
- June 2023
- May 2023
- April 2023
- March 2023
- February 2023
- January 2023
- December 2022
- November 2022
- October 2022
- September 2022
- August 2022
- July 2022
- June 2022
- May 2022
- April 2022
- March 2022
- February 2022
- January 2022
- December 2021
- November 2021
- October 2021
- September 2021
- August 2021
- July 2021
- June 2021
- May 2021
- April 2021
- March 2021
- February 2021
- January 2021
- December 2020
- November 2020
- October 2020
- September 2020
- August 2020
- July 2020
- June 2020
- May 2020
- April 2020
- March 2020
- February 2020
- January 2020
- December 2019
- November 2019
- October 2019
- September 2019
- August 2019
- July 2019
- June 2019
- May 2019
- April 2019
- March 2019
- February 2019
- January 2019
- December 2018
- November 2018
- October 2018
- September 2018
- August 2018
- July 2018
- June 2018
- May 2018
- April 2018
- March 2018
- February 2018
- January 2018
- December 2017
- November 2017
- October 2017
- September 2017
- August 2017
- July 2017
- June 2017
- May 2017
- April 2017
- March 2017
- February 2017
- January 2017
- December 2016
- November 2016
- October 2016
- September 2016
- August 2016
- July 2016
- June 2016
- May 2016
- April 2016
- March 2016
- February 2016
- January 2016
- December 2015
- November 2015
- October 2015
- September 2015
- August 2015
- July 2015
- June 2015
- May 2015
- April 2015
- March 2015
- February 2015
- January 2015
- December 2014
- November 2014
- October 2014
- September 2014
- August 2014
- July 2014
- June 2014
- May 2014
- April 2014
- March 2014
- February 2014
- January 2014
- December 2013
- November 2013
- October 2013
- September 2013
- August 2013
- July 2013
- June 2013
- May 2013
- April 2013
- March 2013
- February 2013
- January 2013
- December 2012
- November 2012
- October 2012
- September 2012
- August 2012
- July 2012
- June 2012
- May 2012
- April 2012
- March 2012
- February 2012
- January 2012
- December 2011
- November 2011
- October 2011
- September 2011
- August 2011
- July 2011
- June 2011
- May 2011
- April 2011
- March 2011
- February 2011
- January 2011
- December 2010
- November 2010
- October 2010
- September 2010
- August 2010
- July 2010
- June 2010
- May 2010
- April 2010
- March 2010
- February 2010
- January 2010
- December 2009
- November 2009
- October 2009
- September 2009
- August 2009
- July 2009
- June 2009
- May 2009
- April 2009
- March 2009
- February 2009
- January 2009
- December 2008
- November 2008
- October 2008
- September 2008
- August 2008
- July 2008
- June 2008
- May 2008
- April 2008
- March 2008
- February 2008
- January 2008
- December 2007
- November 2007
- October 2007
- September 2007
- August 2007
- July 2007
- June 2007
- May 2007
- April 2007
- March 2007
- February 2007
- January 2007
- December 2006
- November 2006
- October 2006
- September 2006
- August 2006
- July 2006
- June 2006
- May 2006
- April 2006
- March 2006
- February 2006
- January 2006
- December 2005
- November 2005
- October 2005
- September 2005
- August 2005
- July 2005
 Eddy Elfenbein is a Washington, DC-based speaker, portfolio manager and editor of the blog Crossing Wall Street. His