Archive for October, 2006
-
Respironcs’ Earnings
Eddy Elfenbein, October 26th, 2006 at 10:38 amShares of Respironics (RESP) are down sharply this morning. The company reported earnings of 33 cents a share, which beat by three cents, but sales came in below expectations. The stock is currently down 6.6%. Perhaps I’m missing something, but I don’t see the reason for the harsh reactions.
The company is looking for profits of 42 cents to 43 cents a share for the December quarter, and $1.73 to $1.77 for next year.
The good new today is that Varian Medical (VAR) is up sharply on its earnings new. On Tuesday and Wednesday, the stock dropped sharply. Nothing ends a sell off like a positive earnings report.
Lastly, Yaser Anwar takes a look at Fiserv (FISV) and likes what he sees. -
Varian Medical Earns 59 Cents a Share
Eddy Elfenbein, October 25th, 2006 at 4:08 pmThe stock has been falling recently, but it just delivered another solid quarter. Varian (VAR) earned 59 cents a share for the quarter, beating the Street by six cents a share. Sales were up 18% to $454 million. The stock is up after hours. We’ll see how it holds tomorrow morning.
-
The Fed Does Nothing. Again.
Eddy Elfenbein, October 25th, 2006 at 2:15 pmThe Federal Open Market Committee decided today to keep its target for the federal funds rate at 5-1/4 percent.
Economic growth has slowed over the course of the year, partly reflecting a cooling of the housing market. Going forward, the economy seems likely to expand at a moderate pace.
Readings on core inflation have been elevated, and the high level of resource utilization has the potential to sustain inflation pressures. However, inflation pressures seem likely to moderate over time, reflecting reduced impetus from energy prices, contained inflation expectations, and the cumulative effects of monetary policy actions and other factors restraining aggregate demand.
Nonetheless, the Committee judges that some inflation risks remain. The extent and timing of any additional firming that may be needed to address these risks will depend on the evolution of the outlook for both inflation and economic growth, as implied by incoming information.
Voting for the FOMC monetary policy action were: Ben S. Bernanke, Chairman; Timothy F. Geithner, Vice Chairman; Susan S. Bies; Donald L. Kohn; Randall S. Kroszner; Frederic S. Mishkin; Sandra Pianalto; William Poole; Kevin M. Warsh; and Janet L. Yellen. Voting against was Jeffrey M. Lacker, who preferred an increase of 25 basis points in the federal funds rate target at this meeting. -
Defending the Bull
Eddy Elfenbein, October 25th, 2006 at 12:57 pm
Today, I’m going to try to do the impossible: I’m going to defend the bull market.
Now, now. Before we get too carried away, I’m not going to make any outlandish predictions for the Dow or Nasdaq. Sorry, no forthcoming book, Dow 13,469.12, for me. I’m afraid I’m not any good at the whole predictions racket. But what I want to do for you, dear reader, is show you how the market ought to be analyzed.
I’m afraid dissecting the market the market is a lot more boring than throwing out random numbers, which, for reasons that elude me, is often followed by macho posturing. (Boo-yah!)
Investing analysis isn’t about predicting some number, and waiting to see if we hit it. We can all have a cheap and easy laugh at market professionals who get it wrong. Not only will I get it wrong, but that forms the foundation of my investing philosophy. You see, one of the best things about investing is that you don’t need to be right. You can be totally 100% wrong on lots of things. You can be wrong on the economy. Wrong on the Fed. Wrong on interest rates. Lots of things. But you can still be a good investor.
I’ll give you a quick example. One of my stocks on the Buy List, SEI Investments (SEIC), is up over 50% this year. If I had predicted that, you would have thought that I was some crazed marijuana addict. I didn’t predict where it was going, but I based my recommendation on reasonable assumptions.
OK, let’s read that last sentence again: I didn’t predict where it was going, but I based my recommendation on reasonable assumptions. In the investing game, we don’t need to be right, but we do need to be reasonable.
What we need to do is compare the stock market with the bond market and make some reasonable assumptions of what could happen. The name for this is risk analysis. We’re not saying what will happen, we’re looking at what could happen.
When I say risk analysis, we want to look at the potential upside and downside. I have to stop the discussion and mention that what may be right for me, may not be right for you.
Here’s an example. Let’s say that the market has a 50% chance of rising 30% over the next 12 months, and a 50% chance of losing 3% over the next 12 months. That’s a bet I would happily make. I understand the odds. I think they’re in my favor. I understand and can face the consequences. Other people might not feel that way. But the fact is, we all know what the rules of the game are. As investment analysts, our goal is to find out what the rules are.
Now let’s look at the match-up. In this corner, we have short-term interest rates (mixed boos and cheers). The one-year Treasury is currently yielding 5%. Honestly, that’s not bad. Put it this way. You can turn off the TV, ignore the market for the next year and make an easy 5%. That’s over 600 Dow points. It would bring your portfolio up to the equivalent of Dow 12,800.
I think that’s an attractive option. The best part of it is that it’s low risk. The bonds are back by the full faith (cough) and credit (cough, cough) of the United States (wheeze) government. No more worrying about the Fed or options scandals or if the president of Wackistan suddenly decides he wants to be Hitler 2.0.
In this corner, we have the stock market (loud and prolonged boos). So what we want to find out is if the Dow has a shot of beating 5% for the coming year.
Over the last 40 years, stocks have beaten bonds by an average of 1.7% a year. That’s what you get for the “uncertainty” of owning stocks. Interestingly, that number has been surprisingly consistent. For our purposes, we’re going to ignore the risk premium because we’re going to try and explore our way out of those uncertainties.
First off, the dividend yield on the S&P 500 is 1.8%, so we’re already more than one-third of the way to our 5%. Now we want to see if the market’s earnings can grow by 3.2% over the next year. Given that inflation is close to that level, all we want to see is if real earnings will grow at all.
Currently, operating earnings for the S&P 500 are expected to grow by 10.1% for the next year (Q4 and the first three Qs of next year). Of course, that’s just today’s estimate. I should add that earnings growth has been impressive recently, but the rate of earnings growth has been slowly easing up, or decelerating if you want to sound cool. Personally, I think that earnings growth is closer to leveling off than going into a steep decline, but we just don’t know yet.
Of course, the housing market is falling apart like the Yankees. Also, a negative yield curve has often foretold a rough earnings environment. But this earnings season is looking good so far. I certainly realize that 10.1% growth will not be exact, but as of now, there’s no hard evidence of an earnings recession in the immediate future.
Predicting earnings growth is not easy; it’s notoriously volatile. Over the past several years, the standard deviation of yearly earnings growth has been 13.7%. That’s pretty wide and it should remind us to be very cautious about making any silly predictions. We’re less than one standard deviation from an earnings recession.
Once again, we don’t need to be right, but our assumptions need to be reasonable. If earnings growth is 10.1% with a standard deviation of 13.7%, then that means that earnings have a 69% chance of beating 3.2% (i.e., the one-year Treasury minus the S&P dividend yield). So far, I like those odds.
Now I see that some of you are ready to jump out of your seats and yell about the market’s P/E ratio. Hooold on. Of course, earnings can do well and the market might not see any of it because earnings multiples contract.
For the most part, I believe that it’s best to assume a neutral valuation environment. Predicting earnings multiples is very tricky stuff, and they don’t often behave as we might like. Also, even if P/E ratios work against us, we can still make money. After all, earnings multiples have declined for much of this bull market.
The closest variable that P/E ratios follow is long-term bond yields. But event that relationship isn’t so easy. For many years, the earnings yield (the inverse of the P/E ratio) was less than the 30-year Treasury bond. Not anymore. For the last three years, the earnings yield has climbed higher and higher above the 30-year yield.
Does this suggest that P/E ratios are way too low? Possibly. But I think another explanation is that the long-end of the yield curve is unnaturally low. This goes back to Mr. Bernanke’s conundrum. So this means that our best guide to P/E ratios is either not working, or it’s indicating that ratios should be much higher.
Even if lower P/E ratios erased stock’s gain relative to bonds, that would mean that the S&P’s P/E ratio would have to fall from roughly 16 today to 15 one year from now. It certainly could happen, but it would mean that multiples would then be the lowest in over a decade. Once again, the risk analysis leans towards stocks. And we can’t forget that the P/E ratio could expand. There’s always the risk of missing out on a big gain. On average, the market’s total net gain comes on just one day in 100.
I also want to look at some indicators of sentiment. This is an unusual bull market because as the bull has charged on, earnings multiples have fallen and dividend yield have climbed. I can’t think of another bull market like that. Also, value stocks have outperformed growth stocks. When a market gets frothy, growth stocks typically take value stocks out to the woodshed. Also, the Nasdaq is less than 20% of the Dow. That’s about the long-term average. When the crowd gets greedy, the Nasdaq often climbs well above 20%. Six years ago, it got above 50%.
To conclude: My assumptions could be totally wrong, but I think they’re reasonable. I think it shows us that the odds lie in favor of the S&P 500 beating the one-year Treasury yield. -
AFL & FISV’s Earnings
Eddy Elfenbein, October 25th, 2006 at 10:05 amAfter the bell yesterday, two more of our Buy List stocks reported earnings results, AFLAC (AFL) and Fiserv (FISV). AFLAC said that it made 73 cents a share which is a big drop from last year’s 90 cents. With insurance stocks, however, operating earnings are usually a better gauge of how well the company is performing. On that score, AFLAC’s operating earnings came in at 72 cents a share which was in line with Wall Street’s forecast. The company expects fourth-quarter operating earnings of 65 cents to 66 cents a share, which is less than the Street’s view of 71 cents a share.
Fiserv had an interesting report. The company’s net earnings fell, but its per-share earnings increased. The company earned 63 cents a share, one penny more than forecasts. Sales rose 14% which was also ahead of expectations. The company also raised the low-end of its full year forecast to $2.51 to $2.54 a share.
Varian Medical (VAR) is slated to report later today. The Street seems nervous since the stock took a big tumble yesterday. Also, Respironics (RESP) will report on Thursday. -
Top Industry Groups This Year
Eddy Elfenbein, October 24th, 2006 at 2:21 pmSteel………………………57.28%
Fixed-Line Telecom…..39.99%
Autos……………………..35.47%
Nonferrous Metals……30.51%
Brokers…………………..26.32%
REITs……………………..24.66%
Gaming…………………..24.38%
Restaurants…………….21.16%
Broadcasting……………20.80%
Aerospace……………….20.73% -
Gold Vs. Stocks
Eddy Elfenbein, October 24th, 2006 at 1:53 pmI get the most mail whenever I write about gold. The point I try to stress is how poorly gold has performed relative to common stocks. What’s interesting is how little gold has to move for gold bugs to claim victory.
If there’s one thing I can get across to investors it’s that gold is an asset, but stocks are equity. This is a huge point. By it, I mean that gold only has value for what people can do with it. Stocks, on the other hand, represent claims on real assets. It’s people taking assets, like gold, and using them to create wealth. It’s people actually doing something. Gold is merely the tool, and it has very limited industrial applications.
The price of gold has historically been defined by brief and dramatic price spikes, followed by periods of long declines. I think we’re going through a spike now. In fact, it may already be over.
A few days ago, Barry Ritholtz posted a chart from Chart of the Day showing the Dow-to-Gold ratio. For 20 years, the ratio had dramatically expanded, although it’s fallen in half during this decade.
Of course, gold doesn’t pay a dividend so I was curious how dividends would have changed this relationship. Dividends don’t pay much these days, but the effect over 30-odd years can be pretty big. Also, small-cap stocks have done very well over the past few years so I wanted to compared Gold against the Wilshire 5000 Total Return Index (^DWCT). Here’s what the chart looks like:
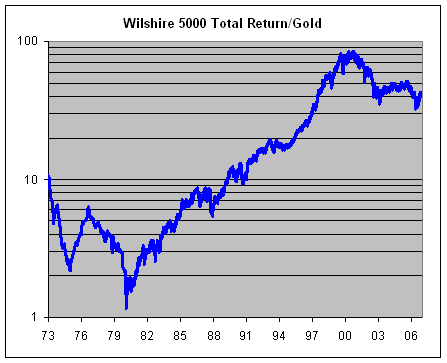
That’s a logarithmic chart, so you can see that the ratio has grown very dramatically over the years. In 20 years (1980-2000), stocks beat gold by an amazing 72 fold. Gold’s advantage over stocks during the past few years is truly just a small dip in a long-term rise. -
Not Dead Yet
Eddy Elfenbein, October 23rd, 2006 at 6:06 pm
Today was another good day for the good guys. The Dow jumped 114.54 points to close at 12,116.91. The S&P 500 is up to 1,377.02. Adjusted for dividends, the S&P isn’t too far from an all-time high.
The Buy List was up 0.90% today. The big winners included Bed Bath & Beyond (BBBY) which closed a penny shy of $40. Fiserv (FISV) also did very well and hit a new 52-week high, as did Harley-Davidson (HOG). Harley is now up 33% for the year! Boo-yah!
Honestly. I’m a little concerned that Treasury yields are creepy higher. That will always kill a rally. Whenever bonds and stocks part company, you know something is up. Frankly, we need some time to take a rest about now.
After the bell, Brown & Brown (BRO) reported earnings of 29 cents a share, one penny better than expectations. Revenues were in line with estimates. The earnings parade continues! Tomorrow we’ll get earnings from AFLAC (AFL) and Fiserv (FISV). On Wednesday, Varian (VAR) reports, and on Thursday, Respironics (RESP) reports. -
Ford’s Earnings
Eddy Elfenbein, October 23rd, 2006 at 9:55 amUgh, the news continues to be grim for American car companies. Today, Ford (F) announced that it lost $5.8 billion in the third quarter. That’s not all–it plans to restate earnings going back to 2001. On an earnings-per-share basis, the loss for Q3 comes to $3.08 compared with a loss of 15 cents a share last year. Sales dropped 10% to $36.7 billion. Two years ago, the stock was at $15 a share, while today it’s below $8. And that’s after a rally!
-
More Earnings News
Eddy Elfenbein, October 19th, 2006 at 10:07 amThis is a strange day for earnings. Danaher (DHR) is currently down despite beating estimates by a penny, and raising its full-year guidance. For the third quarter, the company earned 83 cents a share compared with 70 cents last year.
UnitedHealth (UNH), on the other hand, beat estimates by three cents a share, also raised its guidance but said it will delay its filing. That stock is currently up over 4%.
Also, Dell (DELL) is sharply lower after creeping up slowly for the past few weeks. A research firm said that HP is now the world’s #1 PC-maker.
- Tweets by @EddyElfenbein
-
-
Archives
- April 2024
- March 2024
- February 2024
- January 2024
- December 2023
- November 2023
- October 2023
- September 2023
- August 2023
- July 2023
- June 2023
- May 2023
- April 2023
- March 2023
- February 2023
- January 2023
- December 2022
- November 2022
- October 2022
- September 2022
- August 2022
- July 2022
- June 2022
- May 2022
- April 2022
- March 2022
- February 2022
- January 2022
- December 2021
- November 2021
- October 2021
- September 2021
- August 2021
- July 2021
- June 2021
- May 2021
- April 2021
- March 2021
- February 2021
- January 2021
- December 2020
- November 2020
- October 2020
- September 2020
- August 2020
- July 2020
- June 2020
- May 2020
- April 2020
- March 2020
- February 2020
- January 2020
- December 2019
- November 2019
- October 2019
- September 2019
- August 2019
- July 2019
- June 2019
- May 2019
- April 2019
- March 2019
- February 2019
- January 2019
- December 2018
- November 2018
- October 2018
- September 2018
- August 2018
- July 2018
- June 2018
- May 2018
- April 2018
- March 2018
- February 2018
- January 2018
- December 2017
- November 2017
- October 2017
- September 2017
- August 2017
- July 2017
- June 2017
- May 2017
- April 2017
- March 2017
- February 2017
- January 2017
- December 2016
- November 2016
- October 2016
- September 2016
- August 2016
- July 2016
- June 2016
- May 2016
- April 2016
- March 2016
- February 2016
- January 2016
- December 2015
- November 2015
- October 2015
- September 2015
- August 2015
- July 2015
- June 2015
- May 2015
- April 2015
- March 2015
- February 2015
- January 2015
- December 2014
- November 2014
- October 2014
- September 2014
- August 2014
- July 2014
- June 2014
- May 2014
- April 2014
- March 2014
- February 2014
- January 2014
- December 2013
- November 2013
- October 2013
- September 2013
- August 2013
- July 2013
- June 2013
- May 2013
- April 2013
- March 2013
- February 2013
- January 2013
- December 2012
- November 2012
- October 2012
- September 2012
- August 2012
- July 2012
- June 2012
- May 2012
- April 2012
- March 2012
- February 2012
- January 2012
- December 2011
- November 2011
- October 2011
- September 2011
- August 2011
- July 2011
- June 2011
- May 2011
- April 2011
- March 2011
- February 2011
- January 2011
- December 2010
- November 2010
- October 2010
- September 2010
- August 2010
- July 2010
- June 2010
- May 2010
- April 2010
- March 2010
- February 2010
- January 2010
- December 2009
- November 2009
- October 2009
- September 2009
- August 2009
- July 2009
- June 2009
- May 2009
- April 2009
- March 2009
- February 2009
- January 2009
- December 2008
- November 2008
- October 2008
- September 2008
- August 2008
- July 2008
- June 2008
- May 2008
- April 2008
- March 2008
- February 2008
- January 2008
- December 2007
- November 2007
- October 2007
- September 2007
- August 2007
- July 2007
- June 2007
- May 2007
- April 2007
- March 2007
- February 2007
- January 2007
- December 2006
- November 2006
- October 2006
- September 2006
- August 2006
- July 2006
- June 2006
- May 2006
- April 2006
- March 2006
- February 2006
- January 2006
- December 2005
- November 2005
- October 2005
- September 2005
- August 2005
- July 2005
 Eddy Elfenbein is a Washington, DC-based speaker, portfolio manager and editor of the blog Crossing Wall Street. His