Archive for October, 2007
-
Bernanke Warns
Eddy Elfenbein, October 24th, 2007 at 12:21 pm
Bernanke Warns on US Housing, Economy
Bernanke warns stock investors
Bernanke warns against ad hoc regulation of derivatives
Bernanke warns of economic ‘drag’
Bernanke Warns of Possible ‘Crisis’ From Budget Gap
Bernanke warns of worse to come in subprime fallout
Bernanke Warns Inflation Remains A Significant Risk
Bernanke warns of ‘vicious cycle’ in deficits
Bernanke warns about economic isolationism
Bernanke warns of falling economy
Bernanke warns action needed soon on budget
Bernanke warns US about burden of ageing population
Bernanke Warns Of Growing Inequality
Bernanke warns against protectionism
Greenspan home robbed -
Aflac’s Earnings Report
Eddy Elfenbein, October 24th, 2007 at 12:05 pmAflac (AFL) has been a great stock for us this year. At one point, it hit $60 a share today making it about a 30% winner for us. Yesterday, the company reported earnings of 85 cents a share, three cents more than estimates. Last year, AFL made 73 cents a share. That’s a decent growth rate.
For the fourth quarter, Aflac sees earnings of 75 cents to 70 cents a share.
This is a busy day for earnings. Later we’ll have Graco (GGG), Fiserv (FISV) and Varian (VAR). -
XLK or QQQQ?
Eddy Elfenbein, October 24th, 2007 at 10:51 amI was recently asked what’s the difference, in trading terms, between the Nasdaq 100 (QQQQ) and the S&P 500 Tech Spyders (XLK).
The short answer is nothing. For most circumstances, both ETFs will behave very similarly. As a proxy for the tech sector, I prefer using the XLK.
The longer answer is that there are some differences and if you use these ETFs for trading you might want to be aware of them
First, let me explain that the Nasdaq 100 is an index of the 100 largest nonfinancial stocks on the Nasdaq. For many years, this has been used as a proxy for large-cap tech stocks. The S&P 500 Tech index is simply a grouping of all the tech stocks in the S&P 500.
The important thing to keep in mind about the Nasdaq is that it’s very oligarchic, meaning there are a small number of very, very big stocks, and tons of teeny, weeny stocks. The NYSE is like that as well, but it’s much more pronounced on the Nasdaq. I don’t think most investors realize how important this is. Outside of the big tech names, the NYSE still has a huge advantage over the Nasdaq.
Not only do a few very large tech stocks have a large say in what the Nasdaq 100 does, but they tend to be strongly correlated with one another so their influence is even greater.
Of the 500 stocks on the S&P 500, only 73 are from the Nasdaq and more than half of those are in the tech sector. Ironically, of the 500 S&P stocks, they categorize 73 as being in the tech sector.
So for most practical uses, the QQQ and XLK will behave the same. The big difference is that the Nasdaq 100 also had a modest weighting in consumer discretionary stocks. This would be stocks like Starbucks (SBUX) or Bed Bath & Beyond (BBBY). The ETF for this sector is XLY. So while the XLK is highly correlated to the QQQ, you can improve the correlation some by holding a ratio of about 4-to-1, XLK to XLY. You can improve it some more by using a small amount of margin.
By correlation, I mean that the daily changes are correlated by over 95%. (Note: I got my numbers using the data from the indexes, not the ETFs.) Even with that it’s still a perfect match. The big tech winners this year have come from the Nasdaq (stocks like Google or Apple), so there pushing the QQQQ more than what you might normally expect.
Let me also add that the Rydex Inverse OTC 2x mutual fund (RYVTX) is designed to do twice what the Nasdaq 100 does each day. -
The First Day of the Month
Eddy Elfenbein, October 23rd, 2007 at 2:59 pmHere’s a surprising stat. Since the beginning of this decade, all of the market’s gain have come on the first day of the month. The rest of the time, the S&P 500 is down.
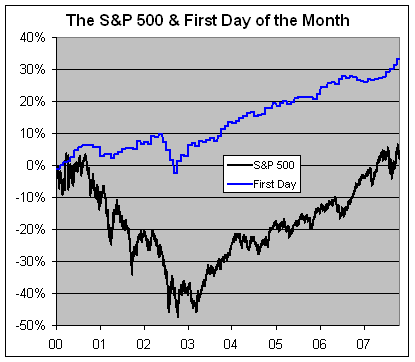
The blue line represents the first day of the month, the black line is the S&P 500. For the decade, the S&P 500 is up 2.52% and the first day is up 33%.
The last seven first days have all been up. In the decade, there have only been 94 first days out of nearly 2,000 trading days, or about 4.8% of the time. -
WR Berkley Down on Earnings News
Eddy Elfenbein, October 23rd, 2007 at 1:34 pmShares of WR Berkley (BER) are down on what I thought were decent earnings. The company earned 93 cents a share compared with 87 cents last year. This is operating earnings as that’s the more important number to follow with insurance stocks. Wall Street was looking for 91 cents a share.
The stock is going for less than eight times trailing earnings. -
Does Apple Ever Go Down?
Eddy Elfenbein, October 22nd, 2007 at 1:00 pmSeriously, it can’t go up every day.
Can it? -
Old School Grimace
Eddy Elfenbein, October 20th, 2007 at 3:07 pm -
Twenty Years Ago Today
Eddy Elfenbein, October 19th, 2007 at 10:21 am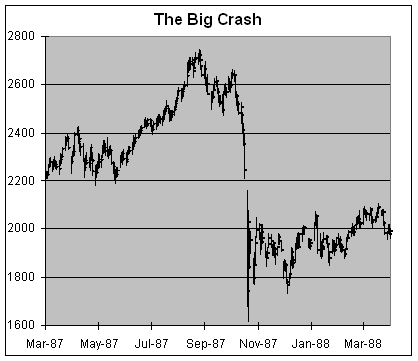
On Monday, October 19, the Dow dropped 508 points, or 22.6%, in its worst crash in history.
Of course, stocks came right back and the economy continued to plow ahead but that wasn’t clear at the time.
Here’s the cover of the New York Times for the following day.
(Doncha just love how the NYT asks “Who Gets Hurts?”)
Here’s their lead article
Here’s how the Washington Post covered the news.
I also noticed this article on local reactions. What caught my eye is that at the very end. Malcolm Gladwell’s name is listed.
What’s interesting is that the articles from two of the most important newspapers in the world don’t mention either the Alan Greenspan or the Nasdaq. It’s hard to imagine a world like that, but the Fed wasn’t considered that important not too long ago. Also, the Nasdaq was a small exchange that wasn’t widely followed.
How things have changed. -
Torre Out as Yankee Skipper
Eddy Elfenbein, October 18th, 2007 at 4:14 pmBreaking news: Joe Torre is out as Yankee skipper.
Is there a market effect? Could be. Twenty years ago tomorrow, Steinbrenner hired Billy Martin for the fifth time. That may have led to the unpleasantness of that day. -
Odd Stat of the Day
Eddy Elfenbein, October 18th, 2007 at 3:35 pmIf you got shares of Google (GOOG) at the IPO price you would have made an average of 5% every four weeks for the last 38 months.
At this price, if Google goes up $1 a day, that’s a decrease in its growth rate.
- Tweets by @EddyElfenbein
-
-
Archives
- April 2024
- March 2024
- February 2024
- January 2024
- December 2023
- November 2023
- October 2023
- September 2023
- August 2023
- July 2023
- June 2023
- May 2023
- April 2023
- March 2023
- February 2023
- January 2023
- December 2022
- November 2022
- October 2022
- September 2022
- August 2022
- July 2022
- June 2022
- May 2022
- April 2022
- March 2022
- February 2022
- January 2022
- December 2021
- November 2021
- October 2021
- September 2021
- August 2021
- July 2021
- June 2021
- May 2021
- April 2021
- March 2021
- February 2021
- January 2021
- December 2020
- November 2020
- October 2020
- September 2020
- August 2020
- July 2020
- June 2020
- May 2020
- April 2020
- March 2020
- February 2020
- January 2020
- December 2019
- November 2019
- October 2019
- September 2019
- August 2019
- July 2019
- June 2019
- May 2019
- April 2019
- March 2019
- February 2019
- January 2019
- December 2018
- November 2018
- October 2018
- September 2018
- August 2018
- July 2018
- June 2018
- May 2018
- April 2018
- March 2018
- February 2018
- January 2018
- December 2017
- November 2017
- October 2017
- September 2017
- August 2017
- July 2017
- June 2017
- May 2017
- April 2017
- March 2017
- February 2017
- January 2017
- December 2016
- November 2016
- October 2016
- September 2016
- August 2016
- July 2016
- June 2016
- May 2016
- April 2016
- March 2016
- February 2016
- January 2016
- December 2015
- November 2015
- October 2015
- September 2015
- August 2015
- July 2015
- June 2015
- May 2015
- April 2015
- March 2015
- February 2015
- January 2015
- December 2014
- November 2014
- October 2014
- September 2014
- August 2014
- July 2014
- June 2014
- May 2014
- April 2014
- March 2014
- February 2014
- January 2014
- December 2013
- November 2013
- October 2013
- September 2013
- August 2013
- July 2013
- June 2013
- May 2013
- April 2013
- March 2013
- February 2013
- January 2013
- December 2012
- November 2012
- October 2012
- September 2012
- August 2012
- July 2012
- June 2012
- May 2012
- April 2012
- March 2012
- February 2012
- January 2012
- December 2011
- November 2011
- October 2011
- September 2011
- August 2011
- July 2011
- June 2011
- May 2011
- April 2011
- March 2011
- February 2011
- January 2011
- December 2010
- November 2010
- October 2010
- September 2010
- August 2010
- July 2010
- June 2010
- May 2010
- April 2010
- March 2010
- February 2010
- January 2010
- December 2009
- November 2009
- October 2009
- September 2009
- August 2009
- July 2009
- June 2009
- May 2009
- April 2009
- March 2009
- February 2009
- January 2009
- December 2008
- November 2008
- October 2008
- September 2008
- August 2008
- July 2008
- June 2008
- May 2008
- April 2008
- March 2008
- February 2008
- January 2008
- December 2007
- November 2007
- October 2007
- September 2007
- August 2007
- July 2007
- June 2007
- May 2007
- April 2007
- March 2007
- February 2007
- January 2007
- December 2006
- November 2006
- October 2006
- September 2006
- August 2006
- July 2006
- June 2006
- May 2006
- April 2006
- March 2006
- February 2006
- January 2006
- December 2005
- November 2005
- October 2005
- September 2005
- August 2005
- July 2005
 Eddy Elfenbein is a Washington, DC-based speaker, portfolio manager and editor of the blog Crossing Wall Street. His