Archive for August, 2010
-
Goldman Sachs January 2011 Puts
Eddy Elfenbein, August 26th, 2010 at 2:41 pmJust in case anyone is interested, you can pick up some puts on Goldman Sachs (GS) for January 2011 with a strike price of $2.50. You never know.
-
This Might be a Sell Signal
Eddy Elfenbein, August 26th, 2010 at 2:18 pmIf the CEO of one of your stocks is named Time’s Person of the Year, that might be time to sell. Intel‘s (INTC) Andrew Grove got that distinction in 1997 and the stock’s recent plunge brings it to almost exactly where it was back then. Intel is currently going for just 8.7 times next year’s earnings.
Jeff Bezos got the nod in 1999, and Amazon (AMZN) eventually dropped over 90%. But maybe it’s not always a sell signal. Today, Amazon is up 54% since the Time cover.
Of course, these are the same people who bought AOL. -
No Jobs Means No Sales Means No Recovery
Eddy Elfenbein, August 26th, 2010 at 11:42 amHere’s a chart I made that I think may be helpful in explaining the current market to new investors.
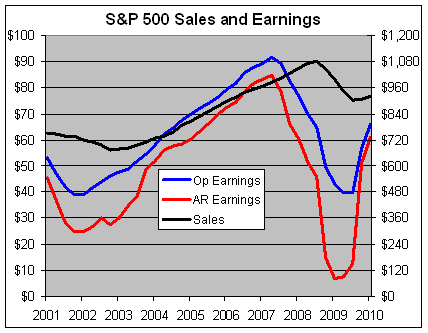
This chart shows the trailing four-quarter sales and earnings for the S&P 500. This needs a little explanation. The black line is the sales for the S&P 500 and it follows the right axis. The blue line represents the operating earnings and the red is the as-reported earnings. Both of those lines follow the left axis. Notice that sales are much less volatile than profits.
I’ve scaled the two axes at a ratio of 12-to-1, which means whenever the red or blue line crosses the black line, the profit margin is exactly 8.33%. Unfortunately, the data only goes up to the first quarter of this year, but nonetheless, I still think it gets the point across.
Let me explain the difference between the red and blue lines. The as-reported figure refers to simply the bottom line that companies report each quarter. The blue line is the earnings number that’s adjusted for special items. Personally, I prefer to look at operating earnings because the market has historically been more closely correlated to it. Some analysts only look at as-reported earnings and I respect that choice. You can use either but just be aware of the pitfalls of either choice.
The problem with as-reported earnings is that they can fall off a cliff as they did during the fourth quarter of 2008. AIG, for example, reported an earnings loss of over $280 a share. When all those financial stocks reported monster losses it gave the impression that the entire market was worthless. The red line plunged to nearly nothing. The market, obviously, didn’t put a standard multiple on $7 of trailing earnings. Instead, the market’s behavior followed the blue line. I’ll skip the accounting debates. My view is that if market thinks the blue line is important, then I think it’s important.
The problem with the operating earnings, however, is that it can reflect poor “earnings quality,” meaning companies get creative with their accounting. A good warning sign of poor earnings quality is when there’s a big gap between the red and blue lines. This was a bigger issue a few years ago, but I’m not so concerned about it today.
Either way, let’s not get bogged down on the issue of operating versus as-reported. The important point I want to get across to new investors is that the market has responded to a dramatic upsurge in operating earnings since March 2009. That’s great news. The problem is that companies haven’t grown their profits by generating new business. Instead, they’ve grown their profits by increasing profits margins. And they’ve done that by cutting costs, principally labor costs. They’ve fired and laid off their way to prosperity!
Basic economics tells us that profits can only go so far without sales growth and that’s been dismal, and it’s partly due to all those lay offs. That black line needs to get moving. The Q2 data point isn’t up yet but it will show pretty much the same thing, sluggish sales growth.
I scaled the two lines at 12-to-1 because once the blue line passes the black line (meaning, the overall profit margin exceeds 8.33%), that’s usually when the economy starts hitting the breaking point. When you can’t increase sales quickly, you need to grow earnings by raising prices. But when you increase margins, you slow sales growth. Hence, the economy moves in a cycle. Notice how the blue line tends to lead the black line by a year or two.
In other words, profits generate sales. But this time around, it just doesn’t seem to be working. -
The Larger the Fund, the Fewer the Stocks
Eddy Elfenbein, August 25th, 2010 at 3:20 pmOne of the important lessons of investing is that individual investors often have an advantage over professionals. They don’t have to meet quarterly goals. They don’t have to justify their actions to committees.
Another is that as mutual funds get larger, it’s harder for them to make nimble investments. Consider these words from Jack Bogle:Jack Bogle shows how the investable universe of stocks declines sharply as a function of fund size. Assuming that a fund can hold no more than 5 percent of the outstanding shares of any company, Bogle estimates that a fund with $1 billion of assets can choose from over 1,900 stocks while a fund with $20 billion has a universe of about 250 stocks. So it happens that success can sow the seeds of its own failure.
True dat. This comes from an interesting report from Michael Mauboussin at Legg Mason (via Abnormal Returns). Of course, large mutual funds can invest in smaller stocks but those stocks play a much smaller role in the fund’s overall performance. It doesn’t take much to build a portfolio that’s nearly blind to moves of the overall market.
What really hurts individual investors is time horizon. While stocks have done better in the long run, that long run can indeed be a very, very long time. -
The Dow Breaks 10,000
Eddy Elfenbein, August 25th, 2010 at 2:54 pmThe Dow dipped below 10,000 this morning but thanks to an afternoon rally, we’re above 10,000. It seems like it was only 11-1/2 years ago that I saw that happen before.
-
Is 2010 Like 1982?
Eddy Elfenbein, August 25th, 2010 at 12:51 pmOn Friday, the government will revise the Q2 GDP numbers and I don’t think it will be very good. With a little over two months until election day, some folks are comparing this year’s contest to Ronald Reagan’s first mid-term election in 1982.
Here’s how the economy looked back then compared to today.

The red line shows the GDP’s performance from March 1980 to December 1982. The blue is from March 2008 to June 2010.
The comparison isn’t very apt. You can see the economy actually recovered in 1981 before falling again in 1982. That probably hurt Reagan in 1982 but the later recovery certainly helped him in 1984.
This time, the economy slumped into 2009 and has so far had a very unimpressive recovery in 2010. -
P/E Ratios of Financial Stocks
Eddy Elfenbein, August 25th, 2010 at 12:01 pmHere’s another look at the P/E Ratios are selected large-cap financial stocks. The P/E Ratios are based on earnings estimates for next year:
Company Ticker Price EPS Est. P/E Ratio Hartford Financial Services HIG $19.21 $3.69 5.2 Lincoln National LNC $21.46 $3.76 5.7 Genworth Financial GNW $10.48 $1.66 6.3 Unum Group UNM $19.59 $3.02 6.5 Allstate ALL $27.59 $4.13 6.7 MetLife MET $36.00 $5.30 6.8 Assurant AIZ $35.63 $5.01 7.1 Torchmark TMK $48.30 $6.75 7.2 XL Group plc XL $17.63 $2.46 7.2 Principal Financial Group PFG $21.75 $2.94 7.4 Morgan Stanley MS $24.88 $3.35 7.4 Prudential Financial PRU $49.13 $6.57 7.5 AFLAC AFL $45.21 $5.98 7.6 SLM Corporation SLM $11.19 $1.48 7.6 Goldman Sachs GS $143.98 $18.76 7.7 JP Morgan Chase JPM $35.86 $4.59 7.8 Citigroup C $3.66 $0.46 8.0 Wells Fargo WFC $23.21 $2.88 8.1 Bank of America BAC $12.53 $1.54 8.1 American International Group AIG $33.94 $4.17 8.1 The NASDAQ OMX Group NDAQ $18.63 $2.24 8.3 Capital One Financial COF $36.95 $4.40 8.4 The Travelers Companies TRV $49.33 $5.84 8.4 Ameriprise Financial AMP $41.93 $4.93 8.5 PNC Financial Services PNC $49.94 $5.87 8.5 Discover Financial Services DFS $13.85 $1.60 8.7 Bank of New York Mellon BK $24.02 $2.64 9.1 State Street STT $34.85 $3.78 9.2 Chubb CB $53.57 $5.65 9.5 U.S. Bancorp USB $21.04 $2.20 9.6 Loews L $35.19 $3.45 10.2 Hudson City Bancorp HCBK $11.68 $1.14 10.2 Moody’s MCO $21.20 $2.06 10.3 NYSE Euronext NYX $27.62 $2.67 10.3 Aon Corporation AON $36.37 $3.51 10.4 BB&T BBT $21.99 $2.06 10.7 Fifth Third Bancorp FITB $10.87 $0.99 11.0 American Express AXP $39.64 $3.58 11.1 Huntington Bancshares HBAN $5.09 $0.45 11.3 Federated Investors FII $20.25 $1.75 11.6 Janus Capital Group JNS $9.46 $0.78 12.1 Kimco Realty KIM $14.38 $1.17 12.3 Progressive PGR $19.30 $1.56 12.4 Marsh & McLennan MMC $23.30 $1.87 12.5 ProLogis PLD $9.99 $0.78 12.8 Franklin Resources BEN $95.17 $7.30 13.0 Legg Mason LM $25.30 $1.94 13.0 Northern Trust NTRS $46.28 $3.50 13.2 Health Care REIT HCN $45.03 $3.40 13.2 Apartment Investment and Manage AIV $19.82 $1.46 13.6 CME Group CME $238.55 $17.39 13.7 Simon Property Group SPG $88.77 $6.32 14.0 M&T Bank MTB $86.33 $6.09 14.2 IntercontinentalExchange ICE $93.18 $6.38 14.6 Host Hotels & Resorts HST $13.25 $0.90 14.7 Charles Schwab SCHW $13.47 $0.91 14.8 HCP, Inc. HCP $34.11 $2.26 15.1 Vornado Realty VNO $80.76 $5.33 15.2 Comerica CMA $33.72 $2.21 15.3 T. Rowe Price TROW $44.47 $2.73 16.3 Cincinnati Financial CINF $26.70 $1.63 16.4 CB Richard Ellis CBG $16.01 $0.96 16.7 Ventas VTR $49.65 $2.96 16.8 E*TRADE Financial ETFC $12.89 $0.75 17.2 Boston Properties BXP $80.64 $4.45 18.1 KeyCorp KEY $7.26 $0.40 18.2 Public Storage PSA $97.36 $5.34 18.2 Equity Residential EQR $44.99 $2.33 19.3 Regions Financial RF $6.41 $0.33 19.4 First Horizon National FHN $10.16 $0.49 20.7 People’s United Financial PBCT $12.73 $0.60 21.2 Plum Creek Timber PCL $33.76 $1.59 21.2 AvalonBay Communities AVB $103.38 $4.30 24.0 SunTrust Banks STI $22.62 $0.83 27.3 Zions Bancorporation ZION $18.06 $0.51 35.4 New M&I Corporation MI $6.08 $0.03 202.7 David Merkel adds: “The key metric, which is hard to measure for financials, is earnings quality. That’s one reason why P/Es are so low.”
-
More on Stocks Vs. Bonds
Eddy Elfenbein, August 24th, 2010 at 3:49 pmHere’s another quick-and-dirty view of how badly bonds have been beaten stocks recently. This shows the Vanguard 500 Index Investor Fund (VFINX) divided by the Vanguard Long-Term Investment-Grade Fund (VWESX):
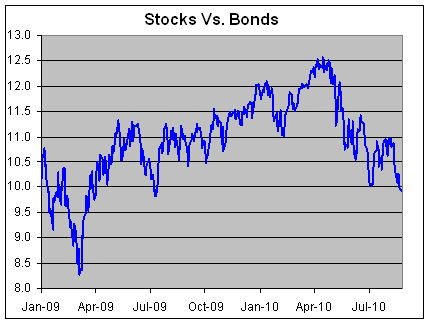
I’m using Vanguard’s main S&P 500 index fund as a proxy for stocks and it’s main corporate bond fund as a proxy for bonds. It’s not perfect but it suits our purposes.
As you can see, bonds have beaten stocks consistently since mid-April (meaning, the ratio is falling). The ratio is about where it was 13 months ago, and it’s not terribly far from it’s very low reading from March 2009.
According to this reading, bonds have outperformed stocks since April 1988. It could be older, but the data only goes back to November 1987. -
Time for US Treasury Consols?
Eddy Elfenbein, August 24th, 2010 at 1:00 pmWith Treasury yields being so low, here’s an idea to consider—let’s have the U.S. Treasury consider floating some long-term debt, some very long-term debt, like a 100-year bond. Hey, Norfolk Southern (NSC) just floated some 100-year paper and the yield was under 6% so why not Uncle Sam? Perhaps not a big auction at first, but it’s certainly worth dipping our toes in the water to see what demand is like (in other words, will China approve?). This could save taxpayers huge amounts of money.
In fact, why stop at 100 years? In the 18th century, the British government issued consol bonds which are perpetuities—bonds that never mature. The word consol refers to the fact that the issue consolidated all of the governement’s debt into one issue. The bonds are callable and the British government has lowered the coupon a few times over the past 250 years. The yield is so low now (2.5%) that they’re not worth redeeming which means the Brits did well off them.
I say let’s float some Treasury perpetuities. Start with a small auction at first to see how it goes. We used to have redeemable Treasury bonds although none is currently outstanding. But for political cover, we can say that these perpetuities aren’t callable for the next, say, 50 years. We could even call them “Obama Bonds.” I wouldn’t be surprised if we could lock-in 4%.
Students of finance will also be happy because once the maturity of a bond becomes infinite, the yield-to-maturity equation gets a whole lot easier. Just divide the coupon by the price and you’re done. -
Bond 36,000
Eddy Elfenbein, August 24th, 2010 at 11:21 amThe bond boom continues. The yield on the 10-year T-bond briefly dropped below 2.5% this morning:
Nortfolk Southern just sold $250 million in 100-year bonds.The interest rate on Norfolk Southern’s new debt is 6% for a yield of 5.95%, about 0.90 percentage points more than where the company’s outstanding 30 year debt was trading Monday. It was the lowest yield for 100-year debt bankers could recall, breaking through the 6% yield on the company’s 100-year issue in 2005.
What’s the point of even having a stock market if investors only want debt? Just float debt and buy back all your stock.
- Tweets by @EddyElfenbein
-
-
Archives
- April 2024
- March 2024
- February 2024
- January 2024
- December 2023
- November 2023
- October 2023
- September 2023
- August 2023
- July 2023
- June 2023
- May 2023
- April 2023
- March 2023
- February 2023
- January 2023
- December 2022
- November 2022
- October 2022
- September 2022
- August 2022
- July 2022
- June 2022
- May 2022
- April 2022
- March 2022
- February 2022
- January 2022
- December 2021
- November 2021
- October 2021
- September 2021
- August 2021
- July 2021
- June 2021
- May 2021
- April 2021
- March 2021
- February 2021
- January 2021
- December 2020
- November 2020
- October 2020
- September 2020
- August 2020
- July 2020
- June 2020
- May 2020
- April 2020
- March 2020
- February 2020
- January 2020
- December 2019
- November 2019
- October 2019
- September 2019
- August 2019
- July 2019
- June 2019
- May 2019
- April 2019
- March 2019
- February 2019
- January 2019
- December 2018
- November 2018
- October 2018
- September 2018
- August 2018
- July 2018
- June 2018
- May 2018
- April 2018
- March 2018
- February 2018
- January 2018
- December 2017
- November 2017
- October 2017
- September 2017
- August 2017
- July 2017
- June 2017
- May 2017
- April 2017
- March 2017
- February 2017
- January 2017
- December 2016
- November 2016
- October 2016
- September 2016
- August 2016
- July 2016
- June 2016
- May 2016
- April 2016
- March 2016
- February 2016
- January 2016
- December 2015
- November 2015
- October 2015
- September 2015
- August 2015
- July 2015
- June 2015
- May 2015
- April 2015
- March 2015
- February 2015
- January 2015
- December 2014
- November 2014
- October 2014
- September 2014
- August 2014
- July 2014
- June 2014
- May 2014
- April 2014
- March 2014
- February 2014
- January 2014
- December 2013
- November 2013
- October 2013
- September 2013
- August 2013
- July 2013
- June 2013
- May 2013
- April 2013
- March 2013
- February 2013
- January 2013
- December 2012
- November 2012
- October 2012
- September 2012
- August 2012
- July 2012
- June 2012
- May 2012
- April 2012
- March 2012
- February 2012
- January 2012
- December 2011
- November 2011
- October 2011
- September 2011
- August 2011
- July 2011
- June 2011
- May 2011
- April 2011
- March 2011
- February 2011
- January 2011
- December 2010
- November 2010
- October 2010
- September 2010
- August 2010
- July 2010
- June 2010
- May 2010
- April 2010
- March 2010
- February 2010
- January 2010
- December 2009
- November 2009
- October 2009
- September 2009
- August 2009
- July 2009
- June 2009
- May 2009
- April 2009
- March 2009
- February 2009
- January 2009
- December 2008
- November 2008
- October 2008
- September 2008
- August 2008
- July 2008
- June 2008
- May 2008
- April 2008
- March 2008
- February 2008
- January 2008
- December 2007
- November 2007
- October 2007
- September 2007
- August 2007
- July 2007
- June 2007
- May 2007
- April 2007
- March 2007
- February 2007
- January 2007
- December 2006
- November 2006
- October 2006
- September 2006
- August 2006
- July 2006
- June 2006
- May 2006
- April 2006
- March 2006
- February 2006
- January 2006
- December 2005
- November 2005
- October 2005
- September 2005
- August 2005
- July 2005
 Eddy Elfenbein is a Washington, DC-based speaker, portfolio manager and editor of the blog Crossing Wall Street. His