Archive for September, 2013
-
Final Q3 Numbers
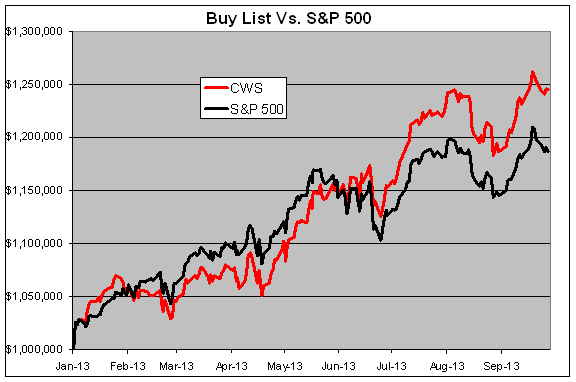
Eddy Elfenbein, September 30th, 2013 at 4:37 pmThe third quarter is on the books. For the year, the S&P 500 is up 17.91% while our Buy List is up 24.12%. Including dividends, the S&P 500 is up 19.79% and our Buy List is up 25.57%.
If we hold on for three more months, it will be our seventh-straight market-beating year.
Our #1 performer is Moog (up 42.99%). Second is Bed Bath & Beyond (38.37%). Six of our stocks are up more than 30%, and 13 are up more than 20%. The worst stock, and our only loser, is Oracle (-0.45%).
The “beta” of our Buy List is 1.0035, and the daily correlation with the S&P 500 is 93.2%. At an annualized rate, the return from dividends of the S&P 500 is a bit more than our Buy List: 2.13% to 1.55%.
The combined 7-3/4 years of our Buy List is up 103.8% to the S&P 500’s 58.90%. (That would be rebalanced every year.)
-
The Close Race Between Stocks and Bonds
Eddy Elfenbein, September 30th, 2013 at 1:26 pmHere’s a graph that tells a lot and every investor should remember this lesson. The following chart shows the total return of stocks (blue) along with the total return of long-term corporate bonds (red). The data begins in October 1986.
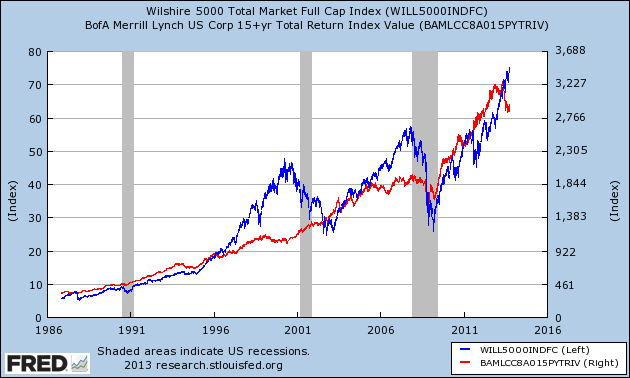
What you can see is that the two lines follow each other pretty closely. Over the last 27 years, stocks and long-term bonds have performed about the same. Despite stocks running ahead of bonds in 1987, the late 1990s and again last decade, the two lines have always come back together.
-
Q3 Earnings Preview
Eddy Elfenbein, September 30th, 2013 at 11:16 amThere are only a few hours left in Q3. Wall Street’s consensus for the S&P 500’s earnings is down to $26.85. That’s down from $29.10 one year ago, and $30.27 eighteen months ago.
Despite the reduced estimate, if Wall Street hits it, that would be growth of 11.88% which would be the strongest in two years.
For Q2, the S&P 500 earned $26.36 which was up only 3.66% from the year before. That was the second-straight quarter of growth for the index. Both quarters in the latter half of 2012 saw earnings declines. There was a lot of talk of an earnings recession but it was more accurately a very modest decline.
Analysts currently peg full-year earnings for the S&P 500 at $107.87. For next year, they see earnings of $121.90.
-
September: 11 of 12 Up, Then 7 of 8 Down
Eddy Elfenbein, September 30th, 2013 at 10:48 amThe stock market is down again on fears of a government shutdown which looks very likely. Today is the final day of the third quarter which is also the end of Uncle Sam’s fiscal year. Folks across town can’t seem to reach an agreement, so for the first time in 17 years, the federal government will partially close down.
The Senate gets together at 2 pm this afternoon. They’re probably going to pass a bill to keep the government going through December 15th, but they won’t include any of the House language about delaying Obamacare. Then it’s up to the House. I’m not a political guy so I have no idea what will happen, but I know that markets don’t like this at all.
The S&P 500 is currently down about nine points which is a little over 0.50%. Here’s a very brief history of the S&P 500 during the month of September: first it rose eleven of twelve days, then it fell seven out of eight days.
This morning, energy stocks are down the most while materials and healthcare stocks are down the least. While most of our Buy List is down today, there are a few pockets of strength. Medtronic (MDT), Moog (MOG-A) and Ross Stores (ROST) are currently showing green.
-
The Market Was a Decent Buy Going Into Lehman
Eddy Elfenbein, September 30th, 2013 at 9:26 amWho’s up for a heterodox post?
We’re coming up on the sixth anniversary of the stock market’s peak of October 9, 2007. I was looking at some data and I realized something I had never noticed before: the stock market became a decent buy several months before Lehman Brothers went under in September 2008. In fact, if you went into the market by mid-January 2008 and—yes—bought and held, you would have made out okay. Most of the market’s excess was burnt off by then.
Note that I said “decent buy,” not “outstanding” or “outrageous,” but decent. I’m basing this on the market’s performance since then. Sure, I understand different people have varying opinions on what a decent return is, but I think my methodology is one that many people would find reasonable. That’s my goal, reasonable. I’ll try to be as dispassionate as I can.
First, I took the Wilshire 5000 Total Return Index. That’s the broadest measure of the U.S. stock market, and it includes dividends. I then divided it by the CPI to get the “real total return.” I then divided that by a tend line growing at 5% per year. That means that whenever the line is moving up, the real total return is more than 5% per year. If the line is going down, it’s less than 5%–and perfectly flat, we’re making 5% on the nose.
Here’s what we get:
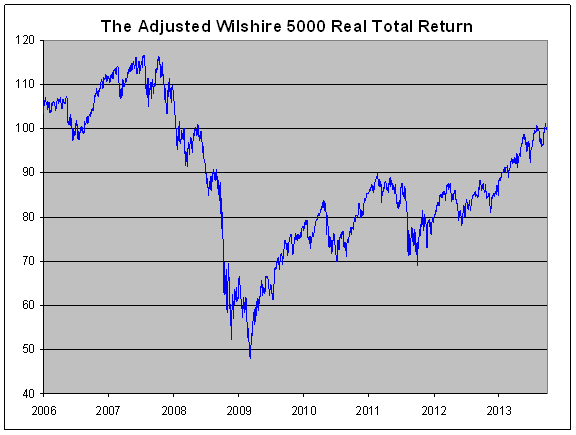
To make it easier to read, I set the end point (Friday) at 100. So if you jumped into the broad market anytime the line in the chart above was below 100, investors would have made more than a 5% real return. By the time Lehman fell, the index was all the way down to 83. Outside a few minor exceptions, the index was below 100 starting on January 15, 2008.
Here again, people might quibble with 5%. Historically, the number has been higher. Jeremy Siegel is known for the Siegel Constant of 7%. Unfortunately, I think that 7% figure is unduly biased by America’s post-war prosperity. I’m going for what I think is reasonable, and that’s why I chose 5%. Basically, it’s 2.5% from real GDP and 2.5% from dividends.
I often tell investors to not worry about being the greatest investor of all time. Instead, think about being a good investor. Of course, now we learn of the all the gurus who predicted the financial crisis. Yet you didn’t need to have knowledge of that sort to make money. Just some patience and discipline.
Henry Blodget recently wrote that he thinks the stock market will crash, but he’s not selling. That opinion may seem odd but if you had felt the same way in March 2008 (and held the entire market), you would have done okay.
Not amazing. Not fantastic. But you’d be just fine today.
-
Morning News: September 30, 2013
Eddy Elfenbein, September 30th, 2013 at 8:47 amPossibility of Delay Threatens European Bank Overhaul and the Region’s Economy
Abe Bets It’s Different This Time With Sales Tax Rise
Japanese Manufacturing PMI Hits Highest Level Since February 2011
First U.S. Shutdown in 17 Years at Midnight Seen Probable
Political Strife in U.S. and Italy Sparks Search for Safety
Climbing Through the Debt Ceiling
IPOs in Europe Leapfrog U.S. Amid Cheap Valuations
Twitter CFO’s Knack for Explaining Will Be Handy in IPO
Apple Passes Coca-Cola as Most Valuable Brand
Rosneft Offers Lowball $1.5 Billion for TNK-BP Minorities
British Game Maker Behind Candy Crush Seeking I.P.O. in U.S.
Siemens CEO Kaeser Cuts 15,000 Jobs to Catch Up With GE
S.E.C. Again Takes on Mark Cuban in Insider Case
Jeff Carter: Angel List Syndicates: Cutting Edge Financing or Bubble?
Jeff Miller: Weighing the Week Ahead: What Will the Government Shutdown Cost?
Be sure to follow me on Twitter.
-
The Buy List So Far
Eddy Elfenbein, September 27th, 2013 at 4:58 pmI’ll have more details after Monday’s close, which is the end of Q3. But through Friday, our Buy List is up 24.49% for the year compared with 18.62% for the S&P 500. That’s a lead of 5.87% which is our widest lead of the year. On April 23, we were trailing the S&P 500 by 3.61% so this has been quite a turnaround for us.
These numbers don’t include dividends, but that’s not a major factor. Our Buy List yields less than the S&P 500, but it’s only around 0.4%. If I have time, I’ll have the dividend-adjusted numbers on Monday.
-
Watching the Five-Year Treasury
Eddy Elfenbein, September 27th, 2013 at 1:26 pmOver the last few months, the five-year Treasury has emerged, in my opinion, as the most taper-sensitive security on Wall Street.
In May, the five-year was yielding a puny 0.65%. By early September, it had jumped to 1.85%. Since the Fed decided not to taper in September, the yield has fallen to 1.4%.
The yield has drifted lower a few times since then, but for the most part, 1.4% seems to be the new floor for the five-year. The lesson is that if you want to see what the market’s thinking about the Fed, first check the five-year.
I think the next big test will be next Friday’s jobs report. The Fed has said they’ll be data-dependent, and this month proved that. If the jobs report comes in weak — say below 180K NFP — that could point to a lower yield for the five-year.
-
CWS Market Review – September 27, 2013
Eddy Elfenbein, September 27th, 2013 at 7:09 am“Our job is to find a few intelligent things to do, not to keep
up with every damn thing in the world.” – Charlie MungerAfter rallying eleven out of the first twelve days of September, the S&P 500 then had a five-day losing streak which was finally snapped thanks to a small rally on Thursday. Despite the recent downturn, the index is still within shouting distance of its all-time high (1,729.86 on September 19th, to be precise). Importantly, we’re still above the 50-day moving average.
So what was the cause of the market’s brief downturn? That’s hard to say. In fact, it’s probably impossible to say what impacts the market in the near-term. Some say it’s worries over another Debt Ceiling showdown. (Groan.) Or it could be worries ahead of earnings season. No matter. That’s not our concern around here (see Charlie’s statement above). Our strategy is to be focused on good stocks for the long term, and it’s been working very well for us this year.
Speaking of which, our favorite home furnishings stock, Bed Bath & Beyond ($BBBY), jumped more than 4.4% on Thursday after another solid earnings report. The shares broke out to a new all-time high. I’ll review the earnings report in just a bit. I also want to discuss the latest botherations at JPMorgan Chase ($JPM). The bank is currently in talks with regulators to write a monster check to make their problems go away. But first, let’s look at the good news from Bed Bath Beyond.
Bed Bath & Nearly Beyond $80 Per Share
On Wednesday, Bed Bath & Beyond ($BBBY) reported fiscal second-quarter earnings of $1.16 per share. That’s an increase of 18.4% over last year. Sales rose 8.9% to $2.824 billion. This was a very good quarter for BBBY. Three months ago, they had given us a range of $1.11 to $1.16 per share, so they hit the top of their own range.
I was especially impressed by the comparable store sales number which was up 3.7%. That topped last year’s figure of 3.5%. If you’re new to investing, this metric is the gold standard for retailers.
For Q3, which ends in November, BBBY sees earnings ranging between $1.11 and $1.16 per share which is the exact same range they had for Q2. For Q4, which is the biggie for BBBY, they see earnings coming in between $1.70 and $1.77 per share. That covers the key months of December, January and February. For a retailer like Bed Bath & Beyond, that’s the biggest quarter of the year by far.
Bed Bath & Beyond also reiterated their full-year forecast of $4.88 to $5.01 per share. By my numbers, that’s a very conservative outlook and I don’t think they’ll have much trouble beating it. The low-end number in particular is way too low. For comparison, the company earned $4.56 per share last year. I think they should be able to clear $5 per share by year’s end. Even $5.10 is possible.
I really like how well-run BBBY is. They have a solid balance sheet and nearly $1 billion in cash. They’re also one of the few companies that use share buybacks to actually reduce their share count. Consider this: In the last three years, net income is up 37% but EPS is up 66%. Why? There are fewer shares. That’s how real buybacks work. Not phony ones that mask executive compensation.
Let me also say that BBBY is a perfect example of our style of investing. You may recall that the stock got hammered a few times last year. BBBY crashed 17% in one day last June, and it dropped another 10% after the earnings report from last September. That earnings report missed Wall Street’s consensus by four cents per share. OMG! Panic!
Yet here we are a year later, and the stock and earnings are at all-time highs. This didn’t involve a Great Swami-like prediction on our part. It involved recognizing the simple fact that BBBY is a great company, and the stock will eventually reflect that. The stock is now a 38.7% winner on the year for us. Aren’t you glad we stuck with them? I’m raising my Buy Below on Bed Bath & Beyond to $83 per share.
JPMorgan Is In Talks to Settle Mortgage Abuses
I’m getting tired of discussing the latest mishaps at JPMorgan Chase ($JPM). For the record, I think it’s a very profitable bank and the stock is a good value. However, the seemingly endless parade of bad news is frustrating.
JPM has already paid huge fines this year. Over the last three years, their litigation costs have totaled a staggering $17 billion. Maybe their lawyers should IPO. Now the bank is in talks with federal and state regulators to secure a massive deal that would resolve all the outstanding mortgage issues they face. Specifically, the allegations deal with how JPM sold mortgage bonds before the crisis.
CEO Jamie Dimon recently met with Attorney General Eric Holder. According to news sources, JPM initially offered to pay $3 billion. The government was, shall we say, unimpressed. The current number we’re hearing is $11 billion. That’s $7 billion in cash plus $4 billion in relief for homeowners. That works out to about $3 per share. Understandably, JPM wants to get all this bad news behind them. Interestingly, the stock rebounded on Wednesday and Thursday on speculation of a possible deal. That’s good to see.
JPM had done well for us this year until hitting some rough ground this summer. It’s important to remember just how massive JPM is. They have more than 250,000 employees and close to $2 trillion in assets. I have to give JPM credit. The last few earnings reports have been outstanding. The next report is due in two weeks. Wall Street’s consensus is for $1.32 per share. I’m keeping JPM as a conservative buy up to $56 per share. I’d be a lot happier if Jamie Dimon is shown the door.
Crossing Wall Street Buy List Updates
It’s mostly been a quiet week for our stocks, but I wanted to touch on a few items. Perhaps the most impressive is that Larry Ellison led Oracle Team USA to a stunning America’s Cup victory. Sure, I doubt it will help Oracle’s ($ORCL) stock, but it’s cool to see. As far as the stock goes, I was relieved by last week’s good earnings, and the shares of ORCL have started to recover. Oracle remains a very good buy up to $35 per share.
Little Nicholas Financial ($NICK) popped as high as $16.79 this week. There was no news, but it’s nice to see NICK get some love. NICK is an excellent buy up to $17 per share. Don’t forget the dividend yield which is currently a hair below 3%.
If I had to guess which Buy List stock would be the top performer this year, I doubt I would have said Moog ($MOG-A), but indeed it is. It’s always the quiet ones! Moog is up 42.3% this year, and this week it nearly poked through the $60 barrier. My take: Don’t chase Moog. I’m keeping our Buy Below at $57 for now. Look for more good earnings news in a few weeks.
Cognizant Technology ($CTSH) continues to do very well for us. Barclay’s just upgraded CTSH and raised their price target from $80 to $97 per share. Remember in April when it plunged 21% in two weeks? Nope, me neither. I’m keeping our Buy Below at $84 per share. CTSH is a solid buy.
On Wednesday, Stryker ($SYK) announced that it’s buying MAKO Surgical ($MAKO) for $1.65 billion. MAKO is involved in robotic-assisted surgery which is a very hot sector. Stryker obviously sees big opportunities here—they’re paying an 86% premium for MAKO.
Shares of SYK took a dip which usually happens to the acquirer, but I’m not worried. Wells Fargo just reaffirmed their Outperform rating, and both RBC Capital and Deutsche Bank recently raised their price targets for SYK. Stryker remains a very good buy up to $71 per share.
That’s all for now. This Monday will be the final day of the third quarter. After that, we’ll get the important turn-of-month economic reports. The ISM Index will be out on Tuesday. The last two reports were quite good. Then on Wednesday, ADP releases its jobs report. Initial claims will be out on Thursday. Finally, on Friday morning, the big September jobs report will be released. Be sure to keep checking the blog for daily updates. I’ll have more market analysis for you in the next issue of CWS Market Review!
– Eddy
-
Morning News: September 27, 2013
Eddy Elfenbein, September 27th, 2013 at 6:43 amEU Chief Says Political Risks Still Threaten Recovery
British Postal Service Valued at $5.3 Billion in I.P.O.
Pound Rises on Report Carney Sees No Need for Extra Stimulus
Top Shareholders Back Alibaba’s Controversial Corporate Structure
Consumer Prices Spike in Japan
BOJ’s Takeaway From Fed Bungle: Keep The Message Simple
JPMorgan Urged to Pay More in Mortgage Deal
McDonald’s to Offer Alternatives to Fries, Soda
Nike Surges As Q1 Profit Beats On Strong North America Sales
Candy Crush Saga: Making Money From Free Games
EBay’s $800 Million Braintree Deal Expands Mobile Payments
KKR to Buy Panasonic Health Care Business for $1.67 Billion
J.C. Penney Offers 84 Million Shares to Fund Turnaround
Cullen Roche: Is Capex Finally Picking Up?
Epicurean Dealmaker: Mirror, Mirror
Be sure to follow me on Twitter.
- Tweets by @EddyElfenbein
-
-
Archives
- April 2024
- March 2024
- February 2024
- January 2024
- December 2023
- November 2023
- October 2023
- September 2023
- August 2023
- July 2023
- June 2023
- May 2023
- April 2023
- March 2023
- February 2023
- January 2023
- December 2022
- November 2022
- October 2022
- September 2022
- August 2022
- July 2022
- June 2022
- May 2022
- April 2022
- March 2022
- February 2022
- January 2022
- December 2021
- November 2021
- October 2021
- September 2021
- August 2021
- July 2021
- June 2021
- May 2021
- April 2021
- March 2021
- February 2021
- January 2021
- December 2020
- November 2020
- October 2020
- September 2020
- August 2020
- July 2020
- June 2020
- May 2020
- April 2020
- March 2020
- February 2020
- January 2020
- December 2019
- November 2019
- October 2019
- September 2019
- August 2019
- July 2019
- June 2019
- May 2019
- April 2019
- March 2019
- February 2019
- January 2019
- December 2018
- November 2018
- October 2018
- September 2018
- August 2018
- July 2018
- June 2018
- May 2018
- April 2018
- March 2018
- February 2018
- January 2018
- December 2017
- November 2017
- October 2017
- September 2017
- August 2017
- July 2017
- June 2017
- May 2017
- April 2017
- March 2017
- February 2017
- January 2017
- December 2016
- November 2016
- October 2016
- September 2016
- August 2016
- July 2016
- June 2016
- May 2016
- April 2016
- March 2016
- February 2016
- January 2016
- December 2015
- November 2015
- October 2015
- September 2015
- August 2015
- July 2015
- June 2015
- May 2015
- April 2015
- March 2015
- February 2015
- January 2015
- December 2014
- November 2014
- October 2014
- September 2014
- August 2014
- July 2014
- June 2014
- May 2014
- April 2014
- March 2014
- February 2014
- January 2014
- December 2013
- November 2013
- October 2013
- September 2013
- August 2013
- July 2013
- June 2013
- May 2013
- April 2013
- March 2013
- February 2013
- January 2013
- December 2012
- November 2012
- October 2012
- September 2012
- August 2012
- July 2012
- June 2012
- May 2012
- April 2012
- March 2012
- February 2012
- January 2012
- December 2011
- November 2011
- October 2011
- September 2011
- August 2011
- July 2011
- June 2011
- May 2011
- April 2011
- March 2011
- February 2011
- January 2011
- December 2010
- November 2010
- October 2010
- September 2010
- August 2010
- July 2010
- June 2010
- May 2010
- April 2010
- March 2010
- February 2010
- January 2010
- December 2009
- November 2009
- October 2009
- September 2009
- August 2009
- July 2009
- June 2009
- May 2009
- April 2009
- March 2009
- February 2009
- January 2009
- December 2008
- November 2008
- October 2008
- September 2008
- August 2008
- July 2008
- June 2008
- May 2008
- April 2008
- March 2008
- February 2008
- January 2008
- December 2007
- November 2007
- October 2007
- September 2007
- August 2007
- July 2007
- June 2007
- May 2007
- April 2007
- March 2007
- February 2007
- January 2007
- December 2006
- November 2006
- October 2006
- September 2006
- August 2006
- July 2006
- June 2006
- May 2006
- April 2006
- March 2006
- February 2006
- January 2006
- December 2005
- November 2005
- October 2005
- September 2005
- August 2005
- July 2005
 Eddy Elfenbein is a Washington, DC-based speaker, portfolio manager and editor of the blog Crossing Wall Street. His