Archive for March, 2014
-
The First Quarter Is On the Books
Eddy Elfenbein, March 31st, 2014 at 4:22 pmThe S&P 500 rose 1.30% for the first three months of 2014, and our Buy List gained 2.08%. Adjusted for dividends, the S&P 500 is up 1.81% for the quarter. Including dividends, our Buy List is up 2.42% for the year.
Stock Symbol 31-Mar 31-Dec Gain/Loss DirecTV DTV $76.42 $69.06 10.66% CR Bard BCR $147.98 $133.94 10.48% Microsoft MSFT $40.99 $37.41 9.57% Wells Fargo WFC $49.74 $45.40 9.56% Stryker SYK $81.47 $75.14 8.42% Medtronic MDT $61.54 $57.39 7.23% Oracle ORCL $40.91 $38.26 6.93% Express Scripts ESRX $75.09 $70.24 6.90% Qualcomm QCOM $78.86 $74.25 6.21% International Business Machines IBM $192.49 $187.57 2.62% Ford Motor Company F $15.60 $15.43 1.10% McDonald’s MCD $98.03 $97.03 1.03% eBay EBAY $55.24 $54.87 0.67% Cognizant Technology Solutions CTSH $50.60 $50.49 0.22% Moog MOG-A $65.51 $67.94 -3.58% Fiserv FISV $56.69 $59.05 -4.00% Ross Stores ROST $71.57 $74.93 -4.48% AFLAC AFL $63.04 $66.80 -5.63% CA Technologies CA $30.98 $33.65 -7.93% Bed Bath & Beyond BBBY $68.80 $80.30 -14.32% Total 2.08% Fifty Years Ago Volatility Dried Up
Eddy Elfenbein, March 31st, 2014 at 1:21 pmWe’re currently celebrating the 50th anniversary of the stock market’s historic low for volatility. It’s almost difficult to describe how little stock prices changed each day half a century ago.
From the aftermath of the Kennedy Assassination to mid-1965, the stock market reached its happy calm state. Between December 1, 1963 and June 29, 1965, the biggest daily gain came on May 1, 1964 when the S&P 500 gained just 0.89%. Nowadays, that’s a fairly average move for one day. It’s hard to imagine it was the biggest move for over a year and a half. From December 1, 1963 to June 14, 1965, the biggest daily loss was a 1.25% drop after the Gulf of Tonkin incident.
But if we break down that low volatility period further, the really low part of the low came in early 1964, exactly 50 years ago. For the entire months of February and March, the S&P 500 didn’t have a single daily move, plus or minus, of more than 0.5%. That’s the longest-such stretch in history—43 trading days in a row. The streak was finally broken by an advance of 0.58% on April 2, 1964.
We haven’t even come close to that record. There hasn’t been a 10-day run in 18 years. In late 2002, there was a 37-day run where we always rose or fell by more than 0.5%.
Here’s the S&P 500’s performance over an eight-day period in February 1964:
February 13: -0.06%
February 14: -0.05%
February 17: -0.03%
February 18: +0.01%
February 19: +0.10%
February 20: +0.09%
February 24: +0.08%
February 25: 0.00%Here are the daily changes for the first quarter of this year:
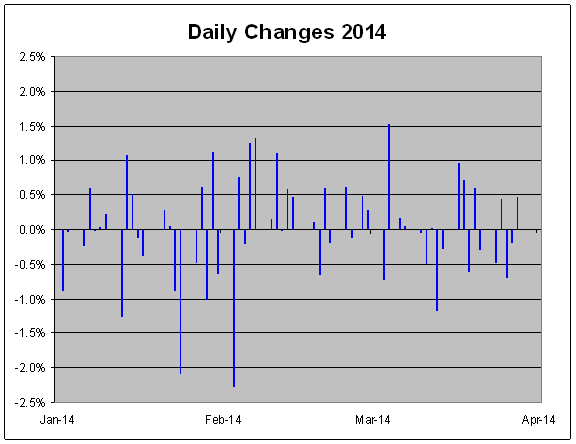
Here are the daily changes for the first quarter of 1964, but I used the same scale as above.

I’d also say that current volatility isn’t that high. We’ve only had a few 1.5% or more days in the last year.
Fifth Straight Quarterly Gain
Eddy Elfenbein, March 31st, 2014 at 12:23 pmToday is the last day of the first quarter. The S&P 500 looks very likely to close up about 1.3% for the quarter. This will be the fifth quarter in a row of gains.
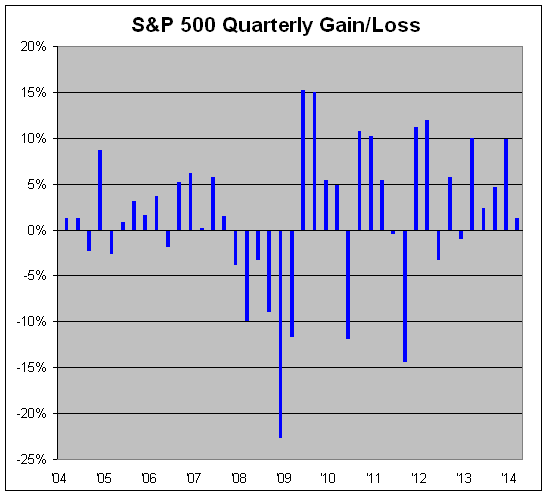
In the last ten quarters, the biggest quarterly loss was 3.3%. (Note that the last data point in the chart above was based on the noon value for the S&P 500.)
Morning News: March 31, 2014
Eddy Elfenbein, March 31st, 2014 at 6:34 amDraghi Sifts Data on Slack as Inflation Cements Low-Rate Vow
Swiss Competition Body Opens Probe into Possible Forex Manipulation
Germany Best of European Union With BMWs of Reunification
Abe Bets He Can Break Japan Sales Tax Jinx With April 1 Rise
Mitsubishi Motors Buys Ford’s Philippines Auto Plant
Spot Gold in a Rut Ahead of US Policy Clues
Chinese Telecommunications Equipment Giant Huawei Vows Security After Alleged US Hacks
Alibaba to Pay $692 Million for 35% Stake in Intime Retail
Apple’s War on Samsung Has Google in Crossfire
Delphi Told Panel GM Approved Ignition Switches Below Specifications
Robots Scamming the Little Investors
Raiders-Turned-Activists Prove Boon for Stocks Beating S&P 500
’This American Life’ Considers Self-Distribution on Radio
Credit Writedowns: Eurozone Credit Contraction Continues
Joshua Brown: “The Stock Market is Rigged!”
Be sure to follow me on Twitter.
60 Minutes: “Is the U.S. Stock Market Rigged?”
Eddy Elfenbein, March 30th, 2014 at 8:13 pmV.S. Ramachandran: Adventures In Behavioral Neurology—Or—What Neurology Can Tell Us About Human Nature
Eddy Elfenbein, March 28th, 2014 at 2:54 pmHere’s this One Weird Chart that Predicts NFP
Eddy Elfenbein, March 28th, 2014 at 10:52 amNext Friday morning, the investment world will be focused on the March jobs report. Guessing the correct NFP number has become a popular game on Wall Street.
However, trying to guess the number ignores an important point — nonfarm payrolls have grown in a nearly perfect trend over the last two-and-a-half years.
Here’s a look at NFP over the last 30 months. I’ve included a trend
line in black that has grown at 1.67% per year. It aligns with NFP growth almost perfectly.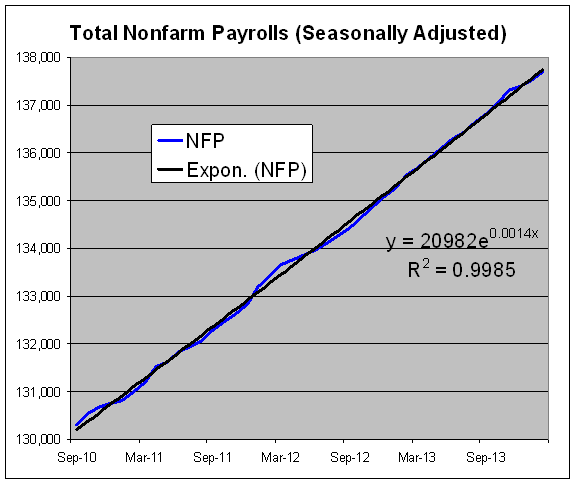
Naturally, this is after-the-fact trend fitting, but the trend is very real. In fact, the blue line’s deviations have grown less pronounced in the last year. The trend is getting trendier.
CWS Market Review – March 28, 2014
Eddy Elfenbein, March 28th, 2014 at 8:28 am“Time is your friend; impulse is your enemy.” – Jack Bogle
On the surface, the stock market was fairly subdued this week. The S&P 500 meandered lower, but the overall loss wasn’t so bad. On Thursday, the index closed a hair below 1,850, but let’s not forget that one week ago, we touched an all-time intra-day high.
Beneath the surface, however, there’s been a big shake-up in the market. Specifically, momentum names have faltered while value stocks have taken the lead. This is an important development, and investors need to understand what’s happening. High-profile sectors like biotech have gotten hammered, and former market darlings have been in a world of hurt lately.
Anyone remember a company called Netflix? That stock dropped 14 times in a 15-day span. Since March 4, NFLX is off by 20%. Stocks like Tesla and Priceline are getting dinged as well. Bespoke Investment Group recently noted that the best-performing stocks from last year are the worst performers this year.
In this week’s CWS Market Review, I’ll break down the market’s change of leadership and tell you what it means for our stocks. Speaking of our stocks, we had more good news for our Buy List stocks. DirecTV soared 8% on Wednesday after news of a possible merger with DISH. I’ll have more on that in a bit. Also on Wednesday, the stress testers at the Fed said they have no objections to Wells Fargo’s capital plan, which includes a hefty 16.7% dividend increase.
I’m pleased to see that our Buy List tech stocks are doing well. Oracle and Qualcomm are near new long-time highs, and even slumbering IBM has perked up. Big Blue just touched its highest point in six months, and I think we’ll get a dividend increase next month. But first, let’s look at the big internal shakeup on Wall Street.
The Market’s Big Shift towards Value
An important lesson with investing is that the stock market swings in cycles, and this is not just the overall market, but also within the market. For example, economically cyclical stocks will lead for a few years and then lag for a few more. Financial stocks will blossom, and then another year it will be dividend stocks that blossom. There’s a loose relationship between these cycles, and it’s always dangerous to read too much into the market’s notoriously fickle mood.
In the last month, value stocks have started to lead the market, and growth stocks have been the big losers. What’s interesting is that this has happened during a mostly bullish time for stocks. Typically, we would expect value stocks to do well when the overall market is suffering. Then, as the bull market starts to age, we would expect growth stocks to come into their own. If you recall, that’s what happened during the late 1990s. What was so arresting about that market wasn’t that value stocks merely lagged—it’s that they got crushed even though growth stocks soared. Back then, the Growth/Value divergence was a yawning chasm.
Another interesting aspect about this recent shift to value has been how sharp it’s been. For my Growth proxy, I like to follow the Vanguard Growth ETF ($VUG), and for Value, I look at the Vanguard Value ETF ($VTV). They’re like twin brothers always fighting over mom’s attention. VUG is flashier and has more popular names, while VTV is the quiet, dutiful student. The typical Value/Growth cycle has been distorted in the last few years because the value indexes have been filled with so many toxic financial stocks. (Here’s a chart of the VTV divided by VUG.)
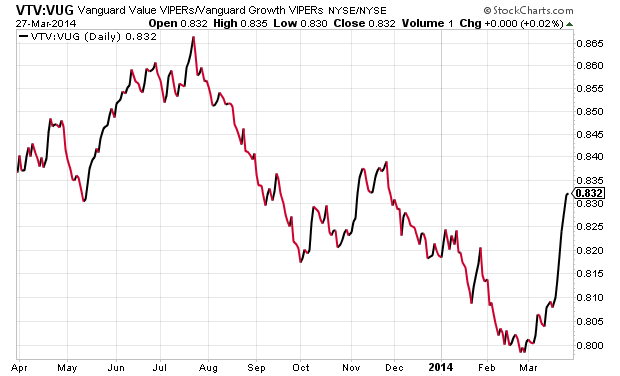
The last Value cycle topped out in mid-2006, and Growth has been in the driver’s seat ever since (with a few false starts for Value). This means that Value underperformed during both the bear market and the bull market. That’s quite a feat. A lot of people have anticipated a Value resurgence, but each attempt has failed. Or I should say each attempt so far.
Since February 27, VTV is up 1.08%, while VUG is down 2.73%. That may not sound like much, but within the ongoing battle between Value and Growth, that’s a major short-term move, and it may continue for some time. VTV has beaten VUG for the last seven days in a row, and 10 of the last 11.
So What Does This Value Shift Mean?
When the market moves towards Value, it typically means that investors are nervous and seeking safety in cheaper names. This time around, it’s not so much that investors want Value. No, it’s that they’re fleeing Growth. An orderly exit is turning into a mad dash. Probably the best example of this has been with biotech stocks. The main Biotech ETF ($IBB) has dropped sharply over the past month. Since February 25, the IBB is off by 13.6%, and a lot of biotech names are down much more than that. Of course, we have to remember that biotech had been in an astounding rally over the past two years.
“So the last shall be first, and the first last” is a quote from the Bible, but it also could serve as a recent stock market report. Look at Tesla ($TSLA), a high-flyer which could do no wrong. The stock went from $35 one year ago to as high as $265 last month. But the past few days have been a different story. Tesla is currently 22% off its high. On the flip side, look at boring Long-Term Treasuries ($TLT). They’re supposed to be dead money, right? But the TLT is at its highest level in eight months. When the current shifts, it can be rough.
I also think the market’s shift towards Value is a reflection of what I talked about last week—investors are getting prepared for the probability of higher short-term interest rates. Last week, the bond market woke up to this idea, and the shift to Value is the stock market’s turn.
Overall, the renewed emphasis on Value is a benefit for our Buy List. In the short term, some of the prominent growth stocks like Cognizant Technology ($CTSH) have suffered in the backlash. I don’t expect that to last. Now let’s take a look at some recent Buy List news.
Wells Fargo Raises Dividend 16.7%
Last week, the Federal Reserve said that Wells Fargo ($WFC) aced its most recent stress test. I had no doubts they’d pass. It’s hardly a secret that WFC is one of the best-run big banks around.
The second part of the Fed’s test came this week to see if they’d approve their capital plans. Once again, Wells Fargo easily passed. The Federal Reserve said they had no objections to WFC’s capital plans. That includes a 16.7% increase in their dividend. The quarterly payout will rise from 30 to 35 cents per share. Last week, I said that I was expecting an increase but only of two cents. Shows what I know!
The shares jumped after the announcement. Using the new dividend and going by Thursday’s close, Wells now yields 2.85%. The board also approved a 350 million-share increase in their buyback plan.
By the way, this stress test wasn’t a cakewalk. Zion’s failed, and Citigroup’s dividend request was shot down. Six years after Bear Stearns collapsed, Citi still pays a quarterly dividend of one penny per share even though Wall Street expects them to earn $5.78 per share next year. Citigroup is still a mess, and I’m glad we have a top-tier name like Wells Fargo. Look for another good earnings report in two weeks. WFC remains a very good buy up to $54 per share.
Will DirecTV Merge with Dish?
On Wednesday afternoon, news broke that the CEO of Dish Network ($DISH) had spoken to the CEO of DirecTV ($DTV) to talk about a possible merger. Honestly, this isn’t a big surprise. Folks have talked about a merger between the two for years. In fact, they tried to merge 12 years ago, but the Federales blocked it. Today, I think DTV is the stronger company, but I have to give credit to Dish for holding its own.
Clearly, the recent merger announcement between Time Warner Cable and Comcast has changed the game, and the two satellite guys have to start thinking seriously about their future. A merger makes sense, but at what price? That’s hard to say. I think DirecTV holds the upper hand here, and it’s interesting to note that Dish’s CEO made the call. Still, DirecTV would be wise to consider an offer. DirecTV has 20 million subscribers, while DISH has 14 million (check out the amazing growth of DTV below).

A lot of this will depend on how regulators rule on the Comcast/TWC deal. If the Feds say yes to that, it will be hard for them to say no to the Direct/Dish deal. DirecTV’s CEO, Mike White, has seemed hesitant about a deal, but he hasn’t ruled it out. I think that’s the right attitude. Frankly, I think these two will get together at some point. I just don’t know when.
The immediate benefit of the merger talk is that shares of DTV jumped as much as 8% on Wednesday, although the stock pulled back as the excitement wore off. DirecTV remains an excellent buy up to $84 per share.
New Buy Below Prices
I want to update a few of our Buy Below Prices. IBM ($IBM) has been doing well lately. This week, the shares got above $195 for the first time since September. I’m expecting a dividend increase from Big Blue sometime next month. I’m raising my Buy Below to $197 per share.
On Thursday, Qualcomm ($QCOM) closed at another multi-year high. The company raised their dividend by 20% just a few weeks ago. This week, I’m bumping up my Buy Below to $83 per share.
CR Bard ($BCR) has been one of our top performers this year. I’ve already raised my Buy Below on BCR a few times, and I’ve purposely held off in the past few weeks. With the Q1 earnings season just around the bend, I feel more confident in BCR’s outlook. Bard has beaten earnings for the last six quarters, and I think they’ll do it again. I’m raising my Buy Below on BCR to $147 per share.
I’m keeping my Buy Below for Microsoft ($MSFT) at $43 per share, but I wanted to highlight the CEO’s plans for the company. For the first time in years, investors are optimistic for MSFT. Keep watching this story – it’s going to get better.
Two of our tech stocks have had a rough month: CA Technologies ($CA) and Cognizant Technology Solutions ($CTSH). I still like both stocks, but I want my Buy Below to better reflect the market’s current judgment. I’m lowering my Buy Below on CA to $34 per share, and I’m lowering Cognizant to $52 per share. Going by Thursday’s close, CA’s dividend works out to 3.28%. Both stocks are very good buys.
That’s all for now. The first quarter ends on Monday; after that, we’ll get our regular beginning-of-the-month reports. ISM comes out on Tuesday. The ADP jobs report comes out on Wednesday. Then on Friday, the government releases the big jobs report for March. With the Fed committed to tapering, I actually think the monthly jobs reports aren’t quite as important as they were last year. Be sure to keep checking the blog for daily updates. I’ll have more market analysis for you in the next issue of CWS Market Review!
– Eddy
Morning News: March 28, 2014
Eddy Elfenbein, March 28th, 2014 at 6:37 amU.S. House Poised to Clear Sanctions Called Putin Warning
Spanish CIP Shock Flags Euro Deflation Risks
Frankfurt Sets Sights on Yuan Trade as Xi Visits Merkel
China’s Baidu Defeats U.S. Lawsuit Over Censored Search Results
Tokyo Investors Eye Data, Central Bank Meet Next Week
Evans Sees Fed Raising Interest Rates in Second Half of 2015
Firms’ Profits Rise to Record High, Outpacing GDP Growth
We Have A New SBA Administrator: Senate Confirms Maria Contreras Sweet
Disabled Borrowers Trade Loan Debt for a Tax Bill From the I.R.S.
Failing Stress Test Is Another Stumble for Citigroup
Wal-Mart Sues Visa Over ‘Swipe Fees’
Microsoft CEO Signals New Course With Office for iPad
I.P.O. to Cut Ill=Fitting Ad Business From CBS
Jeff Carter: How Is Your Head?
Cullen Roche: Let’s Talk About Seigniorage
Be sure to follow me on Twitter.
Markets Up on Good Data
Eddy Elfenbein, March 27th, 2014 at 10:54 amThe stock indexes are just barely in the green today. We had some good economic news this morning. Initial jobless claims fell to 311,000. That’s one of the lowest numbers in the last six-and-a-half years.
Also, Q3 GDP was revised higher, from 2.4% to 2.6%. Remember that this is rather dated info; Q4 began six months ago and ended three months ago.
Wells Fargo ($WFC) got off to a good start today. The shares came close to hitting $50 but have since backed off. The bank announced a big 16.7% dividend hike yesterday.
- Tweets by @EddyElfenbein
-
-
Archives
- April 2024
- March 2024
- February 2024
- January 2024
- December 2023
- November 2023
- October 2023
- September 2023
- August 2023
- July 2023
- June 2023
- May 2023
- April 2023
- March 2023
- February 2023
- January 2023
- December 2022
- November 2022
- October 2022
- September 2022
- August 2022
- July 2022
- June 2022
- May 2022
- April 2022
- March 2022
- February 2022
- January 2022
- December 2021
- November 2021
- October 2021
- September 2021
- August 2021
- July 2021
- June 2021
- May 2021
- April 2021
- March 2021
- February 2021
- January 2021
- December 2020
- November 2020
- October 2020
- September 2020
- August 2020
- July 2020
- June 2020
- May 2020
- April 2020
- March 2020
- February 2020
- January 2020
- December 2019
- November 2019
- October 2019
- September 2019
- August 2019
- July 2019
- June 2019
- May 2019
- April 2019
- March 2019
- February 2019
- January 2019
- December 2018
- November 2018
- October 2018
- September 2018
- August 2018
- July 2018
- June 2018
- May 2018
- April 2018
- March 2018
- February 2018
- January 2018
- December 2017
- November 2017
- October 2017
- September 2017
- August 2017
- July 2017
- June 2017
- May 2017
- April 2017
- March 2017
- February 2017
- January 2017
- December 2016
- November 2016
- October 2016
- September 2016
- August 2016
- July 2016
- June 2016
- May 2016
- April 2016
- March 2016
- February 2016
- January 2016
- December 2015
- November 2015
- October 2015
- September 2015
- August 2015
- July 2015
- June 2015
- May 2015
- April 2015
- March 2015
- February 2015
- January 2015
- December 2014
- November 2014
- October 2014
- September 2014
- August 2014
- July 2014
- June 2014
- May 2014
- April 2014
- March 2014
- February 2014
- January 2014
- December 2013
- November 2013
- October 2013
- September 2013
- August 2013
- July 2013
- June 2013
- May 2013
- April 2013
- March 2013
- February 2013
- January 2013
- December 2012
- November 2012
- October 2012
- September 2012
- August 2012
- July 2012
- June 2012
- May 2012
- April 2012
- March 2012
- February 2012
- January 2012
- December 2011
- November 2011
- October 2011
- September 2011
- August 2011
- July 2011
- June 2011
- May 2011
- April 2011
- March 2011
- February 2011
- January 2011
- December 2010
- November 2010
- October 2010
- September 2010
- August 2010
- July 2010
- June 2010
- May 2010
- April 2010
- March 2010
- February 2010
- January 2010
- December 2009
- November 2009
- October 2009
- September 2009
- August 2009
- July 2009
- June 2009
- May 2009
- April 2009
- March 2009
- February 2009
- January 2009
- December 2008
- November 2008
- October 2008
- September 2008
- August 2008
- July 2008
- June 2008
- May 2008
- April 2008
- March 2008
- February 2008
- January 2008
- December 2007
- November 2007
- October 2007
- September 2007
- August 2007
- July 2007
- June 2007
- May 2007
- April 2007
- March 2007
- February 2007
- January 2007
- December 2006
- November 2006
- October 2006
- September 2006
- August 2006
- July 2006
- June 2006
- May 2006
- April 2006
- March 2006
- February 2006
- January 2006
- December 2005
- November 2005
- October 2005
- September 2005
- August 2005
- July 2005
 Eddy Elfenbein is a Washington, DC-based speaker, portfolio manager and editor of the blog Crossing Wall Street. His