Archive for March, 2014
-
This One Weird Chart Explains the Entire Market
Eddy Elfenbein, March 24th, 2014 at 2:27 pmHere’s a quick one but it explains a lot. This is the Value ETF ($VTV) along with the Growth ETF ($VUG). They had been behaving similarly until late last week. Since then, a wide gulf has opened as Value has strongly beaten Growth.
-
Investing By Day of the Month
Eddy Elfenbein, March 24th, 2014 at 1:59 pmIs there a monthly pattern to the stock market?
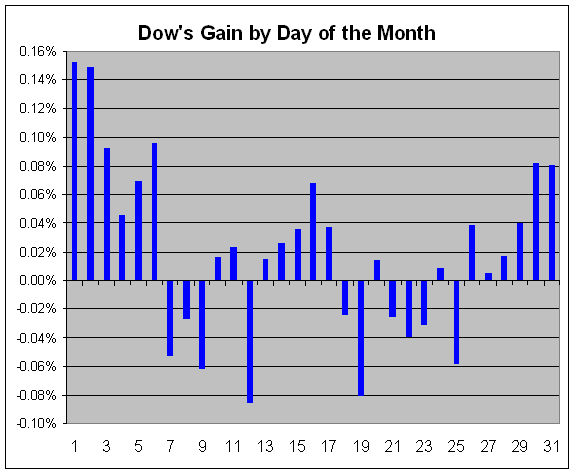
To find out, I took the entire history of the Dow — all 32,000 data points — and broke down how the Dow has performed by each day of the month. Here are my results:
Day of the Month Count Gain/Loss 1 983 0.153% 2 1032 0.149% 3 1045 0.092% 4 965 0.045% 5 1035 0.069% 6 1062 0.096% 7 1057 -0.053% 8 1084 -0.027% 9 1085 -0.062% 10 1083 0.016% 11 1065 0.023% 12 999 -0.085% 13 1071 0.015% 14 1081 0.026% 15 1086 0.036% 16 1081 0.068% 17 1083 0.037% 18 1081 -0.024% 19 1078 -0.081% 20 1084 0.015% 21 1071 -0.026% 22 1023 -0.040% 23 1065 -0.031% 24 1057 0.009% 25 972 -0.058% 26 1044 0.039% 27 1068 0.005% 28 1059 0.017% 29 1001 0.040% 30 918 0.082% 31 605 0.080% The best days are clustered around the beginning and end of each month. Here’s what the table above looks like in graph form:
Here’s what the performance looks like.
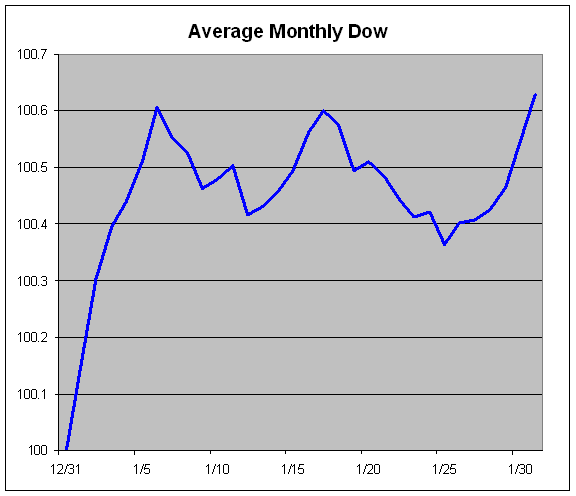
Note that this isn’t literally what the Dow’s average month looks like because the market isn’t open every single day. This is merely a representation of what the cumulative gain looks like based on each day’s average gain or loss.
We can see that the turn of the month is quite good, but the middle of the month sags.
The Biotech Plunge
Eddy Elfenbein, March 24th, 2014 at 1:43 pmBiotech stocks had a massive rally at the start of this year. In fact, biotechs had been outpacing the market for a long time — that is, until last Friday.
The Biotech ETF ($IBB) broke sharply on Friday and the selling continues today.
This could be the start in a bear market for “high beta” names. There’s even talk of the new Fab Five — Netflix ($NFLX), Facebook ($FB), Tesla ($TSLA), Priceline ($PCLN) and Google ($GOOG) — all of whom are getting nailed today.
How to Invest $50,000 Right Now
Eddy Elfenbein, March 24th, 2014 at 12:02 pmI’m often asked how someone can build a portfolio from my Buy List. I’ve purposely built the Buy List so it’s both easy-to-follow and scalable, meaning it works for portfolios large and small.
No, you don’t need to buy all 20 stocks to have a well-rounded portfolio, but it’s great if you can. At minimum, eight stocks are enough for some basic diversification.
I wanted to give you an example of how to build a solid portfolio based on my Buy List. Please keep in mind that the following is just an example; it’s not investment advice. I want people to get the principles behind how I built this rather than the exact specifics of the portfolio.
Company Ticker Price Dividend Shares Balance Income Yield AFLAC AFL $62.98 $1.48 100 $6,298.00 $148.00 2.35% CA Technologies CA $31.11 $1.00 200 $6,222.00 $200.00 3.21% Express Scripts ESRX $76.99 85 $6,544.15 $0.00 0.00% Ford F $15.47 $0.50 400 $6,188.00 $200.00 3.23% McDonald’s MCD $95.47 $3.24 70 $6,682.90 $226.80 3.39% Microsoft MSFT $40.16 $1.12 150 $6,024.00 $168.00 2.79% Stryker SYK $80.86 $1.22 70 $5,660.20 $85.40 1.51% Wells Fargo WFC $49.12 $1.20 130 $6,385.60 $156.00 2.44% Total $50,004.85 $1,184.20 2.37% For building this portfolio, I followed three rules.
First is that these are all good stocks. If you’re following my Buy List, then you don’t need to worry- they’re all good. I do the hard work for you on that front.
Second is that this portfolio is well-diversified (though it could use some energy stocks). It’s got finance, tech, industrial, food, healthcare. This is a key that so many investors miss—and no, diversity doesn’t mean owning both Apple and Google. You’ll also see that the positions are roughly equally weighted.
Third is that I made it simple. Keep it simple, stupid. Too many investors make their investing strategy needlessly complicated.
If you use a discount broker, you can spend around $100 in commissions (probably less), which works out to 20 basis points. You probably won’t need to worry about rebalancing for another 18 months.
Finally, please note that this is merely for the equity portion of your portfolio. You want to have some fixed income as well depending on your risk profile.
Morning News: March 24, 2014
Eddy Elfenbein, March 24th, 2014 at 6:48 amLeaders Gather on Ukraine as West Warn on Russian Troops
China’s Yuan Rebounds From 13-Month Low, Outlook Bumpy
Japan’s Plutonium Plans Stoke China Tensions on A-Bomb Risk
BOJ Tankan to Show Business Mood Up But Outlook Dims
`Concrete Gold’ Is The Best Phrase We’ve Heard All Day
Q&A: Minnesota Fed Chief Kocherlakota
Nokia Expects Closure of Microsoft Deal to Be Delayed Until April
Candy Crush: Will Wall Street Buy the Addictive Game?
Standard Life in Talks to Buy Ignis
Apple in Talks with Comcast for Streaming-TV Service
G.M. Uses Social Media to Manage Customers and Its Reputation
How High-Speed Traders Are Like Fish
Herbalife to Nominate Three Additional Icahn Designees to Board
John Hempton: Herbalife Internal Consumption: A Comment
Credit Writedowns: Economic Consequences of Income Inequality
Be sure to follow me on Twitter.
Ugly Day for Our Buy List
Eddy Elfenbein, March 22nd, 2014 at 7:33 pmAlthough Friday was a quiet day for the stock market, I’m afraid that it was an unusually poor day for the relative performance of our Buy List (please note the words “relative performance.”)
While the S&P 500 lost 0.29% on Friday, our Buy List dropped 0.96%. That’s an underperformance of 0.67%. That’s our worst daily underperformance in nearly a year. While lagging days are to be expected, I roughly estimate that a day like Friday should come along every six months.
Let me throw out another “relative.” This was our worst daily relative performance relative to what we’re trying to do. Guys in the options or futures markets would laugh at the idea of trialing the market by two-thirds of a percent as being unusually bad.
Since our portfolio is a broad-based and mostly made of mid- and large-cap stocks, we’re bound to track the market pretty closely each day, and we do. In this market, we stay within 20 basis points of the S&P 500 most days. Our outperformance only shows up in the longer term.
Since we don’t take on any weird macro bets, I honestly don’t know what caused Friday’s debacle. Perhaps there was no cause, it just…happened. Sixteen of our 20 stocks trailed the market, and nine stocks were down more than 1%. Seemingly unrelated stocks such as CA Technologies ($CA) and DirecTV ($DTV) got hit pretty hard. The only common link I can find is that they’re on our Buy List.
As you might guess, I’m not at all worried. Our strategy is conservative, and if Friday was bad by that standard, then we’re doing something right. I always want to be up front about what’s happening with our stocks, so I need to be frank with the bad news as well.
Let’s shake this off and get ready for next week.
Russia Vs. US Defense Companies
Eddy Elfenbein, March 21st, 2014 at 9:59 amIt’s interesting to see how the Russia ETF ($RSX) has became strongly negatively correlated with defense firms Raytheon ($RTN) and Lockheed Martin ($LMT).
CWS Market Review – March 21, 2014
Eddy Elfenbein, March 21st, 2014 at 8:56 am“…something on the order of six months.” – Janet Yellen
With those words, the new Fed Chairwoman sent world markets into a tizzy. How could that be, and what, pray tell, did she mean?
Fear not, gentle reader, for I am well versed in the convoluted sub-dialect of Fed-speak, and I’ll lead you through Wall Street’s latest hissy fit. The bottom line, as I’ll explain later, is not to worry. Traders are freaking out over nothing special.
After six painful years, the economy is slowly returning to something approaching normal. Soon, workers will be able to demand higher wages, and consumer prices will rise. This is good news—it’s what we want to happen. A side effect is that we’re soon going to return more traditional monetary policies, and that will apparently take some getting used to. In this week’s CWS Market Review, I’ll explain what you need to know.
I’ll also walk you through the latest earnings report from Oracle. The bottom line number was a tad disappointing, but that was more than made up for by rather rosy guidance. I expect the enterprise software giant soon to hit $40 per share, which it last touched 14 years ago. I’ll break it down in a bit, but first, let’s look at this week’s Fed meeting and why everyone’s scratching their heads.
The Fed Ditches the Evans Rule
Before I get into this week’s Federal Reserve meeting, let’s back up a bit and explain how we got where we are. When the economy plunged into recession, the Federal Reserve responded by dramatically cutting interest rates in an attempt to cushion the blow and hopefully turn things around. Soon, the Fed got to 0% and couldn’t cut any more. Many of the top economic models said that short-term interest rates should be negative—pay people to borrow money!
The Fed decided the best way to get below 0% was to buy bonds. Lots and lots of bonds. The fancy term for this is Quantitative Easing or QE. They tried this a few times for limited periods, but it wasn’t enough. Finally, they threw up their hands and said, “we’re going to buy bonds until things get better.” Specifically, the plan was to purchase $85 billion each month in Treasuries and mortgage-backed bonds.
The market loved the plan, and stock prices soared. But investors wanted to know: How long would the bond-buying party last? The idea floated by Charles Evans of the Chicago Fed was to lay out a specific unemployment number and say, “we won’t end QE until we hit this number.” The Fed adopted the Evans Rule and said that 6.5% unemployment was their threshold. (The Evans Rule also included 2.5% for inflation, but we’re a long way from that.)
Stock prices continued to climb, and the unemployment rated started to fall. Then some investors got nervous because we were getting close to 6.5% on jobs, but the economy obviously needed more QE. The reason is that so many people had left the workforce, and as a result weren’t counted as part of that 6.5%. In other words, the economy is weaker than that unemployment number suggests. As a result, the belief was that the Fed would soon abandon the Evans Rule (I first mentioned this in January), and that’s exactly what happened this week. The Fed ditched the Evans Rule.
Yellen Confuses the Market
Now that leads us to the next step, and here’s where things get a little complicated. Last June, the Fed signaled that it was planning to pare back on its bond purchases. The market, predictably, freaked out. This was the famous Taper Tantrum. In four months, the three-year Treasury jumped from 0.3% to nearly 1%.
Investors believed, incorrectly, that the entire rally was due to QE, so once that was gone, the market was toast. Not only did they get that wrong, but they completely misjudged the timing of the Fed’s taper decision (to be fair, the miscommunication was mostly the Fed’s fault). Ultimately, it wasn’t until December that the Fed decided to taper its monthly bond-buying by $10 billion. In January, the Fed tapered by another $10 billion, and they did it again this week.
The Fed had said they wouldn’t raise interest rates until they were done with bond-buying. Sure, that makes sense. But now that they’re tapering, here’s the big question: How long will it be between the ending of QE and the first rate increase? In Wednesday’s policy statement, the Fed said “a considerable time,” so when Janet Yellen faced the media at her press conference, someone asked, “Well…what does a considerable time mean?” Her answer was “something on the order of six months.”
The next logical question is, “Six months from when?” Yellen said of QE’s end, “we would be looking at next fall.” That totally confused reporters. Did she mean fall of 2015? Nope, Yellen clarified by saying she meant this fall. Now six months from this fall means…a rate hike next spring? Hold on! That’s earlier than the market was expecting.
As a result, stocks dropped on Wednesday, and the middle part of the yield curve bulged. The three-year Treasury yield rose by 16 basis points, and the five-year jumped by 19 points (the chart above). The two- and three-year Treasuries’ yields reached six-month highs. Utility stocks, which are highly sensitive to interest rates due to their rich yields, took a beating. On the forex market, the yen dropped against the dollar, and that took a 1.5% bite out of AFLAC’s ($AFL) stock during Wednesday’s trading. Gold, which had been doing well, has lost more than 4% this week.
When Will the Fed Raise Rates?
But does Yellen’s timetable make sense? With this latest taper, the Fed will be buying $55 billion in bonds starting with April. Follow me on this. The Fed meets again in April (they meet every six or seven weeks), so presumably another $10 billion taper would bring us down to $45 billion. Then we’d go to $35 billion at the June meeting. For July, we’d be down to $25 billion. Then in September, we’re down to $15 billion.
The next meeting would be on October 28-29. If the Fed wiped out the last $15 billion in one move, that would mean QE wraps up in November, which is indeed in the fall, as Yellen mentioned. But if the Fed tapers by only $10 billion in October, that leaves $5 billion on the table to tapered at the December meeting. That would mean that QE would be done by the end of the year. Counting six months from that, it means we’d see the first rate increase by the middle of 2015. That’s more in line with what the futures market had been expecting.
The market got tripped up by Yellen’s mention of “the fall” and “six months.” So here’s my take: I think this was a rookie mistake by Janet Yellen. I strongly doubt there’s anything close to a majority at the FOMC that thinks interest rates will rise next spring. The economy is getting better, but we still have a way to go, and the CPI numbers are barely moving.
Let’s also bear in mind that we’re only talking about one measly rate increase. On Wednesday, the one-year Treasury yield skyrocketed all the way up to the highest yield in five months—0.15%! For an investment of $1 million, that works out to about $4 per day.
Make no mistake: higher interest rates are like Kryptonite to a bull market. I think the market is paranoid that a hawkish Fed is suddenly going to spring on them. It’s as if they’ve adopted an attitude of “prove to me that you’re going to let me down.” That, combined with a few misstatements from Chairwoman Yellen, explains what happened. Higher rates are truly something to worry about, but for now, they’re still a long way off.
Stocks rebounded impressively on Thursday. In fact, the S&P 500 barely budged between Tuesday’s and Thursday’s close. But we’re in a new world. Investors need to realize that the Fed will tighten at some point. It’s no longer a distant hypothetical. Currently most FOMC members think short-term rates will be at 1% by the end of next year and at 2.25% by the end of 2016. In other words, the Fed Funds rate will still be less than inflation for a good while more.
Let me add one more point. The FOMC’s policy statements have gotten ridiculously long. Dear Lord, they run on and on, with lots of garbage text. Please. Just tell us the basics. A Fed statement should be no more than 300 words. Period.
Oracle Misses Earnings, but Don’t Fret
After the closing bell on Tuesday, Oracle ($ORCL) reported fiscal Q3 earnings of 68 cents per share. This was two cents below Wall Street’s consensus. It was also at the bottom of Oracle’s own guidance. The stock dropped sharply in the after-hours market. But as I said last week, what was more important than the actual earnings report would be Oracle’s guidance for the current quarter.
On the conference call, Oracle said to expect fiscal Q4 earnings to range between 92 and 99 cents per share. The Street had been expecting 96 cents per share, so that left open the possibility of an earnings beat.
On the revenue side, Oracle said it sees Q4 revenues coming in between $11.3 billion and $11.7 billion. Wall Street had expected $11.5 billion. New software sales and subscriptions would range from 0% to 10%. The best news was that hardware sales rose by 8%. That’s Oracle’s first increase since they bought Sun Microsystems four years ago. Total revenue climbed 4% to $9.31 billion, which was $50 million shy of Wall Street’s forecast.
At the start of Wednesday’s trading, shares of ORCL opened down more than $1. Gradually, traders realized that their guidance wasn’t so bad, and Oracle rallied throughout the day. Oracle finally made it into the green and got as high as a 12-cent gain on the day. The rally was later undone by Janet Yellen’s comments, but Oracle moved largely in line with the rest of the market.
Oracle’s business still needs to improve, but I think they’re making the right moves. I expect the shares soon to break $40, which the stock last hit 14 years ago. Oracle remains a good buy up to $41 per share.
Buy List Updates
Our Buy List continues to hold up well. I have a few updates to pass along. Microsoft ($MSFT) closed above $40 per share for the first time since 2000 (notice how a lot of tech stocks are hitting 14-year highs). The software king is planning to release Office for the iPad, and Morgan Stanley had good things to say about their prospects. I’m raising my Buy Below on Microsoft to $43 per share.
The Federal Reserve just completed its latest bank “stress test,” and Wells Fargo ($WFC) passed with flying colors. The Fed wants to make sure that if things go kablooey, the large banks won’t come running back to Uncle Sam for more bailout cash. Since Wells is so well run, there wasn’t any doubt it would do well.
The next part of the Fed’s decision comes next week when they say who’s allowed to increase their dividend. Again, I’m sure Wells will get whatever they ask for. WFC currently pays 30 cents per share each quarter. I’m expecting that to rise to 32 cents per share, give or take. Shares of WFC just broke out to another new 52-week high. I’m raising my Buy Below on Wells Fargo to $54 per share.
Shares of Qualcomm ($QCOM) have been doing well lately. The stock just hit—take a wild guess—a 14-year high. There’s a chance we might get a dividend increase soon. I’m bumping up my Buy Below on QCOM to $82 per share. This is a very good stock.
That’s all for now. Next week is the final full week of the first quarter. We’re going to be getting more economic reports that aren’t tainted by the inclement weather. On Wednesday, the Department of Commerce will release its latest report on durable goods. Then on Thursday, the government will revise the Q4 GDP report. Last month, the original report was revised downward from 3.2% to 2.4%. Be sure to keep checking the blog for daily updates. I’ll have more market analysis for you in the next issue of CWS Market Review!
– Eddy
P.S. Do you know the difference between the different types of stock orders? Don’t be embarrassed. Many experienced investors don’t. Check out my handy guide to the different types of stock orders.
Morning News: March 21, 2014
Eddy Elfenbein, March 21st, 2014 at 6:33 amFitch Revises Russia’s Outlook to Negative; Affirms at ‘BBB’
Sanctions Trigger Drop in Russian Shares and Rouble
Fed Hands Lifeline to Dollar Bulls
IRS Phone Scam Sweeping Nation
Missing Bitcoins Found As Mt. Gox Recovers $120 Million From Old Electronic Wallets
29 of 30 Big Banks Pass Fed’s Stress Test
‘Bond King’ Bill Gross Faces A Leadership Test As His Firm Seeks To Regain Investor Confidence
Carl Icahn’s War of Words with eBay Takes a Major Twist
Nike Warns FX Fluctuations to Slam Profit, Expects Weak China Sales
Airbnb Is In Advanced Talks to Raise Funds at a $10 Billion Valuation
Starbucks to Expand Sales of Alcohol Across the US
$80 Million for 6 Weeks for Cable Chief
Symantec Fires CEO Bennett as PC Slump Erodes Antivirus Sales
Jeff Carter: How Would You Vote On This Proxy?
Joshua Brown: Fed’s Community Theater Production of “Stress Test!” Delights Audiences Young and Old
Be sure to follow me on Twitter.
The Market Recovers Post-Janet
Eddy Elfenbein, March 20th, 2014 at 3:21 pmThe stock market is recovering nicely from yesterday’s Fed-induced jitters. The S&P 500 has been as high as 1,873 today. We’re now living in a world where tightening is to be expected. Not yet, but it’s on the horizon. Currently, most Fed members think interest rates will be at 1% by the end of next year and at 2.25% by the end of 2016.
We had some economic reports this morning. The initial claims report came in at 320,000. That’s a good number. The Philly Fed’s report on manufacturing was much stronger than expected. Their “diffusion index” of current activity was expected to rise from -6.3 to 3.2. Instead, it rose to 9.0.
On our Buy List, Microsoft ($MSFT) is doing very well today after positive comments from Morgan Stanley on the planned Office software for the iPad. MSFT is at a 14-year high. Wells Fargo ($WFC) and Qualcomm ($QCOM) are also at new highs.
- Tweets by @EddyElfenbein
-
-
Archives
- April 2024
- March 2024
- February 2024
- January 2024
- December 2023
- November 2023
- October 2023
- September 2023
- August 2023
- July 2023
- June 2023
- May 2023
- April 2023
- March 2023
- February 2023
- January 2023
- December 2022
- November 2022
- October 2022
- September 2022
- August 2022
- July 2022
- June 2022
- May 2022
- April 2022
- March 2022
- February 2022
- January 2022
- December 2021
- November 2021
- October 2021
- September 2021
- August 2021
- July 2021
- June 2021
- May 2021
- April 2021
- March 2021
- February 2021
- January 2021
- December 2020
- November 2020
- October 2020
- September 2020
- August 2020
- July 2020
- June 2020
- May 2020
- April 2020
- March 2020
- February 2020
- January 2020
- December 2019
- November 2019
- October 2019
- September 2019
- August 2019
- July 2019
- June 2019
- May 2019
- April 2019
- March 2019
- February 2019
- January 2019
- December 2018
- November 2018
- October 2018
- September 2018
- August 2018
- July 2018
- June 2018
- May 2018
- April 2018
- March 2018
- February 2018
- January 2018
- December 2017
- November 2017
- October 2017
- September 2017
- August 2017
- July 2017
- June 2017
- May 2017
- April 2017
- March 2017
- February 2017
- January 2017
- December 2016
- November 2016
- October 2016
- September 2016
- August 2016
- July 2016
- June 2016
- May 2016
- April 2016
- March 2016
- February 2016
- January 2016
- December 2015
- November 2015
- October 2015
- September 2015
- August 2015
- July 2015
- June 2015
- May 2015
- April 2015
- March 2015
- February 2015
- January 2015
- December 2014
- November 2014
- October 2014
- September 2014
- August 2014
- July 2014
- June 2014
- May 2014
- April 2014
- March 2014
- February 2014
- January 2014
- December 2013
- November 2013
- October 2013
- September 2013
- August 2013
- July 2013
- June 2013
- May 2013
- April 2013
- March 2013
- February 2013
- January 2013
- December 2012
- November 2012
- October 2012
- September 2012
- August 2012
- July 2012
- June 2012
- May 2012
- April 2012
- March 2012
- February 2012
- January 2012
- December 2011
- November 2011
- October 2011
- September 2011
- August 2011
- July 2011
- June 2011
- May 2011
- April 2011
- March 2011
- February 2011
- January 2011
- December 2010
- November 2010
- October 2010
- September 2010
- August 2010
- July 2010
- June 2010
- May 2010
- April 2010
- March 2010
- February 2010
- January 2010
- December 2009
- November 2009
- October 2009
- September 2009
- August 2009
- July 2009
- June 2009
- May 2009
- April 2009
- March 2009
- February 2009
- January 2009
- December 2008
- November 2008
- October 2008
- September 2008
- August 2008
- July 2008
- June 2008
- May 2008
- April 2008
- March 2008
- February 2008
- January 2008
- December 2007
- November 2007
- October 2007
- September 2007
- August 2007
- July 2007
- June 2007
- May 2007
- April 2007
- March 2007
- February 2007
- January 2007
- December 2006
- November 2006
- October 2006
- September 2006
- August 2006
- July 2006
- June 2006
- May 2006
- April 2006
- March 2006
- February 2006
- January 2006
- December 2005
- November 2005
- October 2005
- September 2005
- August 2005
- July 2005
 Eddy Elfenbein is a Washington, DC-based speaker, portfolio manager and editor of the blog Crossing Wall Street. His