Archive for December, 2018
-
The 2019 Buy List
Eddy Elfenbein, December 31st, 2018 at 8:53 pmHere are the 25 stocks for the 2019 Buy List. It’s locked and sealed, and I can’t make any changes for 12 months.
For tracking purposes, I assume the Buy List is a $1 million portfolio that’s equally divided among 25 stocks. Below are all 25 positions with the number of shares for each and the closing price for 2018. Whenever I discuss how the Buy List is doing, the list below is what I’m referring to.
Company Ticker Price Shares Balance AFLAC AFL $45.56 877.96313 $40,000.00 Becton, Dickinson BDX $225.32 177.52530 $40,000.00 Broadridge Financial Solutions BR $96.25 415.58442 $40,000.00 Cerner CERN $52.44 762.77651 $40,000.00 Check Point Software CHKP $102.65 389.67365 $40,000.00 Church & Dwight CHD $65.76 608.27251 $40,000.00 Cognizant Technology Solutions CTSH $63.48 630.11972 $40,000.00 Continental Building Products CBPX $25.45 1571.70923 $40,000.00 Danaher DHR $103.12 387.89760 $40,000.00 Disney DIS $109.65 364.79708 $40,000.00 Eagle Bancorp EGBN $48.71 821.18661 $40,000.00 FactSet Research Systems FDS $200.13 199.87008 $40,000.00 Fiserv FISV $73.49 544.29174 $40,000.00 Hershey HSY $107.18 373.20396 $40,000.00 Hormel Foods HRL $42.68 937.20712 $40,000.00 Intercontinental Exchange ICE $75.33 530.99695 $40,000.00 JM Smucker SJM $93.49 427.85325 $40,000.00 Moody’s MCO $140.04 285.63268 $40,000.00 Raytheon RTN $153.35 260.84121 $40,000.00 Ross Stores ROST $83.20 480.76923 $40,000.00 RPM International RPM $58.78 680.50357 $40,000.00 Sherwin-Williams SHW $393.46 101.66218 $40,000.00 Singnature Bank SBNY $102.81 389.06721 $40,000.00 Stryker SYK $156.75 255.18341 $40,000.00 Torchmark TMK $74.53 536.69663 $40,000.00 Total $1,000,000.00 The five new stocks are Broadridge Financial Solutions, Disney, Eagle Bancorp, Hershey and Raytheon. We’ll also gain a 26th stock when Danaher spins off its dental business.
The five sells are Alliance Data Systems, Carriage Services, Ingredion, Snap-on and Wabtec.
Disney is now our largest stock, with a market cap of $163 billion. The Buy List is mostly large- and mid-cap stocks. Only two are smaller than $5 billion. Eagle Bancorp is $1.7 billion, and Continental Building Products is about $937 million
Only AFLAC and Fiserv have been on the Buy List all 14 years. This is Stryker’s 12th year.
Here’s a brief description (via Hoovers) of our five new stocks:
Broadridge Financial Solutions (BR) does business by proxy. The company provides technology-based investor communications, trade processing, and related services – the back-office infrastructure that facilitates operations – to financial services companies around the world. Clients include banks, broker-dealers, mutual funds, and institutional investors. Through its proprietary ProxyEdge system, Broadridge processes and distributes proxy materials, voting instructions, and other information to investors, processing more than 2 billion investor communications per year. It also offers related services, such as marketing communications and online shareholder meetings. Broadridge operates offices in more than a dozen countries in North America, Europe, Africa, Asia and Australia.
The monarch of this magic kingdom is no man but a mouse: Mickey Mouse. The Walt Disney Company (DIS) is the world’s largest media conglomerate, with assets encompassing movies, television, publishing, and theme parks. Its Disney/ABC Television Group includes the ABC television network and 10 broadcast stations, as well as a portfolio of cable networks including ABC Family, Disney Channel, and ESPN (80%-owned). Walt Disney Studios produces films through imprints Walt Disney Pictures, Disney Animation, and Pixar. It also owns Marvel Entertainment and Lucasfilm, two extremely successful film producers. In addition, Walt Disney Parks and Resorts runs its popular theme parks including Walt Disney World and Disneyland.
For those nest eggs that need a little help hatching, holding company Eagle Bancorp (EGBN) would recommend its community-oriented EagleBank subsidiary. The bank serves businesses and individuals through more than 20 branches in Maryland, Virginia, and Washington, DC, and its suburbs. Deposit products include checking, savings, and money market accounts; certificates of deposit; and IRAs. Commercial real estate loans represent more than 70% of its loan portfolio, while construction loans make up another more than 20%. The bank, which has significant expertise as a Small Business Administration lender, also writes business, consumer, and home equity loans. EagleBank offers insurance products through an agreement with The Meltzer Group.
The Hershey Company (HSY) works to spread Almond Joy and lots of Kisses. With its portfolio of more than 80 global brands, the #1 chocolate producer in North America has built a big business manufacturing such well-known chocolate and candy brands as Hershey’s, Kisses, Reese’s peanut butter cups, Twizzlers, Mounds and Almond Joy candy bars (under a license), York peppermint patties, and Kit Kat wafer bars. Hershey also makes grocery goods, including baking chocolate, chocolate syrup, cocoa mix, cookies, snack nuts, breath mints, and bubble gum. Beyond candy, Hershey’s has expanded into the snacks category. Products from the chocolate king are sold to a variety of wholesale distributors and retailers throughout North America and exported overseas.
Raytheon (RTN), “light of the gods,” shines in the upper pantheon of US military contractors; the company regularly places among the Pentagon’s top 10 prime contractors. Its air/land/sea/space/cyber defense offerings include reconnaissance, targeting, and navigation systems, as well as missile systems (Patriot, Sidewinder, and Tomahawk), unmanned ground and aerial systems, sensing technologies, and radars. Additionally, Raytheon makes systems for communications (satellite) and intelligence, radios, cybersecurity, and air traffic control. It also offers commercial electronics products and services, as well as food safety processing technologies. The US government accounts for a large portion of sales.
The 2018 Buy List
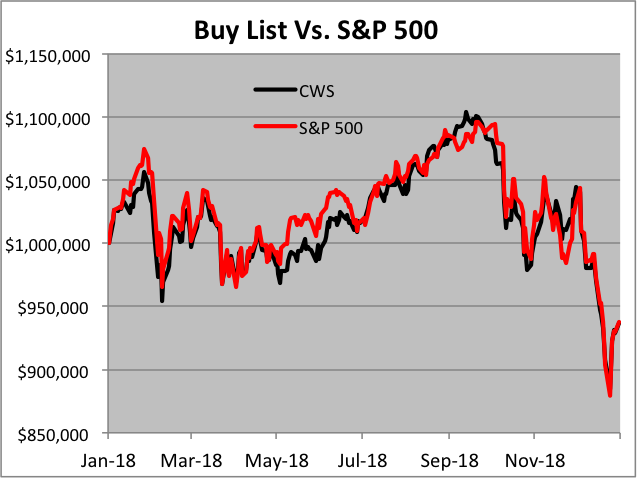
Eddy Elfenbein, December 31st, 2018 at 7:33 pmThe 2018 trading year is on the books! For 2018, the S&P 500 lost 6.24% while our Buy List lost 6.30%. Including dividends, the S&P 500 lost 4.38% while our Buy List lost 5.11%. So we trailed the overall market, but to be fair, not by much.
Our Buy List fell 3% behind the market by May, but it performed much better since then. Also, we were weighed down by big losses in Carriage Services and Alliance Data Systems.
For the long-term, we’ve done quite well. Over the last 13 years, our Buy List has gained 211.32% while the S&P 500 has gained 164.00%.
Our biggest winner this year was Church & Dwight (CHD) which gained more than 31%. CHD was a new addition to this year’s Buy List. Eleven of our stocks finished positive this year, and 14 of our 25 stocks beat the S&P 500 in terms of price. The problem is that the big losers held us back.
For people who care about such things, the “beta” of our Buy List in 2018 was 0.8085. That’s pretty low for us. The correlation of the daily changes of the Buy List to the changes of the S&P 500 was 93.34%.
The chart below details the Buy List’s performance. I’ve listed each stock along with the number of shares and the starting and ending prices. For tracking purposes, I assume the Buy List is a $1 million portfolio that starts out equally divided among the 25 stocks.
Stock Shares 12/29/17 Beginning 12/31/18 Ending Profit/Loss AFL 911.3694 $43.89 $40,000.00 $45.56 $41,521.99 3.80% ADS 157.8034 $253.48 $40,000.00 $150.08 $23,683.13 -40.79% BDX 186.8635 $214.06 $40,000.00 $225.32 $42,104.08 5.26% CSV 1,555.8149 $25.71 $40,000.00 $15.50 $24,115.13 -39.71% CERN 593.5599 $67.39 $40,000.00 $52.44 $31,126.28 -22.18% CHKP 386.0259 $103.62 $40,000.00 $102.65 $39,625.56 -0.94% CHD 797.2892 $50.17 $40,000.00 $65.76 $52,429.74 31.07% CTSH 563.2216 $71.02 $40,000.00 $63.48 $35,753.31 -10.62% CBPX 1,420.9591 $28.15 $40,000.00 $25.45 $36,163.41 -9.59% DHR 430.9416 $92.82 $40,000.00 $103.12 $44,438.70 11.10% FDS 207.5119 $192.76 $40,000.00 $200.13 $41,529.36 3.82% FISV 610.0816 $65.57 $40,000.00 $73.49 $44,834.90 12.09% HRL 1,099.2031 $36.39 $40,000.00 $42.68 $46,913.99 17.28% INGR 286.1230 $139.80 $40,000.00 $91.40 $26,151.64 -34.62% ICE 566.8934 $70.56 $40,000.00 $75.33 $42,704.08 6.76% SJM 321.9575 $124.24 $40,000.00 $93.49 $30,099.81 -24.75% MCO 270.9844 $147.61 $40,000.00 $140.04 $37,948.66 -5.13% ROST 498.4424 $80.25 $40,000.00 $83.20 $41,470.41 3.68% RPM 763.0675 $52.42 $40,000.00 $58.78 $44,853.11 12.13% SHW 97.5515 $410.04 $40,000.00 $393.46 $38,382.61 -4.04% SBNY 291.4177 $137.26 $40,000.00 $102.81 $29,960.65 -25.10% SNA 229.4894 $174.30 $40,000.00 $145.29 $33,342.51 -16.64% SYK 258.3312 $154.84 $40,000.00 $156.75 $40,493.42 1.23% TMK 440.9657 $90.71 $40,000.00 $74.53 $32,865.17 -17.84% WAB 491.2195 $81.43 $40,000.00 $70.25 $34,508.17 -13.73% Total $1,000,000.00 $937,019.81 -6.30% Note that AFLAC (AFL) split 2-for-1 on March 19, and Fiserv (FISV) split 2-for-1 on March 20.
Here’s how the Buy List performed throughout the year:
Here’s the data behind the dividend-adjusted returns. I’ve listed each stock’s beginning price, ending price and dividend-adjusted starting price.
Symbol Start Finish Adju Start Gain Gain w/Divs AFL $43.89 $45.56 $42.65 3.80% 6.82% ADS $253.48 $150.08 $250.87 -40.79% -40.18% BDX $214.06 $225.32 $211.34 5.26% 6.61% CSV $25.71 $15.50 $25.37 -39.71% -38.90% CERN $67.39 $52.44 $67.39 -22.18% -22.18% CHKP $103.62 $102.65 $103.62 -0.94% -0.94% CHD $50.17 $65.76 $49.36 31.07% 33.23% CTSH $71.02 $63.48 $70.08 -10.62% -9.42% CBPX $28.15 $25.45 $28.15 -9.59% -9.59% DHR $92.82 $103.12 $92.23 11.10% 11.81% FDS $192.76 $200.13 $190.56 3.82% 5.02% FISV $65.57 $73.49 $65.57 12.08% 12.08% HRL $36.39 $42.68 $35.47 17.28% 20.33% INGR $139.80 $91.40 $136.62 -34.62% -33.10% ICE $70.56 $75.33 $69.68 6.76% 8.11% SJM $124.24 $93.49 $120.75 -24.75% -22.58% MCO $147.61 $140.04 $146.03 -5.13% -4.10% ROST $80.25 $83.20 $79.40 3.68% 4.79% RPM $52.42 $58.78 $51.19 12.13% 14.83% SHW $410.04 $393.46 $406.59 -4.04% -3.23% SBNY $137.26 $102.81 $135.89 -25.10% -24.34% SNA $174.30 $145.29 $170.66 -16.64% -14.87% SYK $154.84 $156.75 $153.02 1.23% 2.44% TMK $90.71 $74.53 $90.05 -17.84% -17.23% WAB $81.43 $70.25 $80.99 -13.73% -13.26% Total -6.30% -5.11% Every Buy List Stock
Eddy Elfenbein, December 31st, 2018 at 6:51 pmHere are all 86 Buy List stocks and when they made the cut.
Stocks ’06 ’07 ’08 ’09 ’10 ’11 ’12 ’13 ’14 ’15 ’16 ’17 ’18 19 ABT X ADS X X X AFL X X X X X X X X X X X X X X APH X X X AXTA X BAX X X BBBY X X X X X X X X X X X BCR X X X X X X BDX X X X X X BER/WRB X X BIIB X BLL X BMET X X BR X BRO X CA X X X CBPX X X X CERN X X X X CHD X X CHKP X X CLC X CNK X CSV X CTSH X X X X X X X X DCI X X X X DELL X DHR X X X X X X X DIS X DLX X DTV X X X EBAY/PYPL X X EGBN X ESRX X X X X EV X X EXPD X F X X X X X X FDS X X X X X X X FIC X X FISV X X X X X X X X X X X X X X GDW/WB X GGG X GILD X X HCBK X HD X HEI X X HOG X X X HRL X X X X X HRS X X HSY X IBM X ICE X X X INGR X X INTC X JNJ X X X JOSB X X X X X X JPM X X X LLY X X LNCR X LUK X X X X MCD X MCO X X X MDT X X X X X X X X X MOG-A X X X X X X X X MSFT X X X X X NICK X X X X X X X ORCL X X X X X QCOM X X RAI X X X RESP X X ROST X X X X X X X RPM X X X RTN X SBNY X X X X X SEIC X X X X X SHW X X X SJM X X X SNA X X X X SRCL X SYK X X X X X X X X X X X X SYY X X X X X X X TMK X X UNH X X X VAR X X WAB X X X X WFC X X X X WXS/WEX X X X X AFLAC and Fiserv are the only two left that have been on every year. Stryker is on for the 12th year in a row.
What’s an Unusual Year for the Stock Market?
Eddy Elfenbein, December 31st, 2018 at 1:17 pmWith about three hours to go, the stock market looks to lose about 7% this year. That’s really not so unusual.
Very roughly, the stock market gains, on average, about 1/40th of a percent each trading day. In other words, a $40 stock gains about one penny each day. Yet the standard deviation, meaning the average daily swing, is about 1% each day. That means the daily “noise” is about 40 times the true value each day, again, on average.
On average, the stock market gains about 6% to 7% each year, and the standard deviation is around 15%. So right now, we’re tracking about one standard deviation below the mean. That’s perfectly normal. (No, the stock market is not logonormally distributed, but that doesn’t impact my point.)
Here’s a look at the annual total return of the Russell 3000.
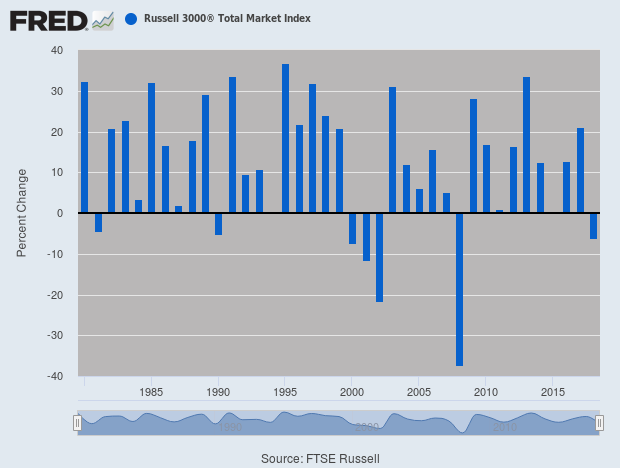
This will only be our second losing year in the last 16 years.
Think of the stock market as a slot machine that offers two payoffs. Either you make 15% in a bullish year, or you lose 30% in a bearish year. The bullish years happen about 85% of the time, while the bearish years happen about 15% of the time.
Of course, that’s not how the stock market really works, but thinking of it in those terms is probably much closer to the true dynamics of investing.
Morning News: December 31, 2018
Eddy Elfenbein, December 31st, 2018 at 7:12 amGlobal Stocks Rise to End Turbulent 2018
China Slowdown Continues With Factory Gauge at Lowest Level Since 2016
The Fed Is Fighting for Control of Its Key Interest Rate
The Week in Business: ’Twas the Week After Christmas, and Markets Were Stirring
Here Are the World’s Biggest Billionaire Winners and Losers of 2018
GE Drags Premier U.S. Corporate Debt, Which Posts Worst Year Since 2008
New Life for Old Classics, as Their Copyrights Run Out
The Rise and Fall of Carlos Ghosn
Amazon to Expand Whole Foods Stores
Lawrence Hamtil: The Bullish Case for Equities
Ben Carlson: The Forgotten Bear Markets
Roger Nusbaum: Probabilities>Predictions, More Portfolio Defense Implemented & Time To Tune Up & Simplify?
Howard Lindzon: Predictions for 2019…The Fed Stops Hiking and Disney Will Make All-Time Highs
Joshua Brown: Stock Prices are a Proxy for our Beliefs About the Future & Don’t Invest Like a Billionaire
Be sure to follow me on Twitter.
Barron’s Highlights Disney
Eddy Elfenbein, December 30th, 2018 at 6:37 pmDisney (DIS) won’t officially join our Buy List until the start of trading on Wednesday, but Barron’s gave it a nice overview this weekend. Here’s a sample:
Walt Disney (ticker: DIS) has in a sense become more Disney-like in how it earns its profits. After 20 years of being dominated by television, especially cable, the company is returning to its roots in films and theme parks. Seven years ago, for each $1 in operating profit that Disney made from its parks and studios, it generated $3 in TV. During the fiscal year ended September, parks and studios retook the lead.
That’s one part of a transformation that could help pull Disney’s stock out of a three-year slump. The other crucial element is Disney+, or “the service,” as company executives privately call it. It’s a streaming platform coming in late 2019 that will bring shows and movies directly to viewers, and it’s a bigger priority for the company than even its Star Wars lands as it takes on the Death Star of TV, Netflix (NFLX).
Disney’s streaming arsenal will be bolstered by its $71 billion acquisition of film and TV assets from 21st Century Fox (FOXA), expected to close in 2019. (Fox is the sister company of Barron’s parent, News Corp.) The deal gives Disney the 20th Century Fox film and TV studios. That includes Avatar, one of the top-grossing films in history, which has at least two sequels in the works and comes with a park tie-in: Pandora, a sprawling land based on the film, opened in 2017 at Disney World’s Animal Kingdom under a licensing agreement.
(…)
For decades, Disney was largely a moviemaker with theme parks, although television has long been part of the mix; The Mickey Mouse Club, which began on ABC in 1955, helped finance Disneyland, and the Disney Channel has been a cable mainstay since the 1980s. But in 1995, Disney surprised investors with a $19 billion acquisition of Capital Cities/ABC, gaining a prosperous TV network and a thriving ESPN. As cable spread service across the nation, and TV producers learned how to extract higher fees from cable operators for their content, the small screen became Disney’s big earner.
Iger planted the roots of Disney’s growth spurt in its traditional businesses when he rolled up major story-telling outfits that weren’t for sale. He did that by visiting their bosses one-on-one: Steve Jobs, culminating in the $7.4 billion purchase of Pixar in 2006; Isaac Perlmutter, for a $4 billion acquisition of Marvel Entertainment in 2009; and George Lucas, in a $4 billion deal for Lucasfilm in 2012. What has followed has been a film boom for the ages.
This year, Disney will again become the only studio in history to reap $7 billion in worldwide box office receipts: $4 billion internationally and $3 billion in the U.S. It also did so in 2016. And Disney makes eight to 10 films a year; some big studios make two dozen.
(…)
By taking its movie magic to the parks, Disney has grown attendance and ticket prices while adding park events with separate ticket charges. In 2016, it introduced peak pricing for admission. A one-day visit to the Magic Kingdom during Christmas week cost as much as $129. That’s up from $55 before Iger took over in 2005—a faster rise than the Dow Jones Industrial Average of stocks over the same time period.
Yet the parks are packed, according to the vast constellation of bloggers and small-business owners who give advice on when and how to visit. “Is There an Off-Season at Disney World?” asks a post by DisneyTouristBlog.com owner Tom Bricker.
Operating profit from Disney’s parks has almost tripled over the past seven years, to nearly $4.5 billion during the year ended in September. Merchandise earnings have soared, too.Wall Street, however, has valued the popularity of Netflix—and its challenge to cable TV—over Disney’s success in the parks. Netflix expects to end the year with 138 million subscribers, including just under 80 million international ones. It has amassed them by spending feverishly on content. Management plans to burn $3 billion to $4 billion in cash this year and next.
The stock closed Friday at $107.30 per share. That’s down from a 52-week high of $120.20. It looks like Disney will earn about $7.10 per share in 2018. Wall Street currently expects 2019 earnings of $7.45 per share.
CWS Market Review – December 28, 2018
Eddy Elfenbein, December 28th, 2018 at 7:08 am“If you can keep your head when all about you are losing theirs….” – Rudyard Kipling
It’s as if the stock market sat on its allotted volatility for the entire year, like vacation days, and is now frantically trying to use it all.
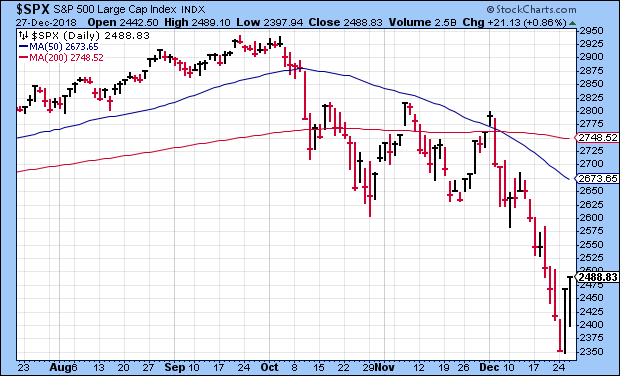
On Monday, Christmas Eve, the S&P 500 plunged to its lowest close in 20 months. On Tuesday, the market was closed for Christmas. Then on Wednesday, Boxing Day, the S&P 500 had its best day in seven years. The Dow soared, gaining over 1,000 points for an all-time record.
Then on Thursday, the stock market started off soggy but staged a frenetic turnaround. In the final 86 minutes, the Dow surged 810 points. Those were the first back-to-back gains we’ve had all month.
Confused? Don’t worry. In this week’s CWS Market Review, I’ll try to make sense of the chaos. At least, to the extent that that’s possible. But first, let’s discuss next year’s Buy List.
The 2019 Buy List
On Christmas Day, I sent you the 25 stocks for 2019 Buy List. Here they are again:
AFLAC (AFL)
Becton, Dickinson (BDX)
Broadridge Financial Solutions (BR)
Cerner (CERN)
Check Point Software Technologies (CHKP)
Church & Dwight (CHD)
Continental Building Products (CBPX)
Cognizant Technology Solutions (CTSH)
Danaher (DHR)
Disney (DIS)
Eagle Bancorp (EGBN)
FactSet Research Systems (FDS)
Fiserv (FISV)
Hershey (HSY)
Hormel Foods (HRL)
Intercontinental Exchange (ICE)
Moody’s (MCO)
Raytheon (RTN)
Ross Stores (ROST)
RPM International (RPM)
Sherwin-Williams (SHW)
Signature Bank (SBNY)
JM Smucker (SJM)
Stryker (SYK)
Torchmark (TMK)The five new stocks are Broadridge Financial Solutions (BR), Disney (DIS), Eagle Bancorp (EGBN), Hershey (HSY) and Raytheon (RTN).
The five sells are Alliance Data Systems (ADS), Carriage Services (CSV), Ingredion (INGR), Snap-on (SNA) and Wabtec (WAB). The new Buy List goes into effect at the start of trading on January 2, the first trading day of 2019. For track-record purposes, the 25 stocks are assumed to be equally balanced based on the closing prices as of December 31.
I’ll send you an email on January 1 with all the details. I’ll also summarize the results for the 2018 Buy List. With two days left, our Buy List has a very, very, very tiny edge over the S&P 500. We’re down 6.83% for the year compared with a loss of 6.91% for the S&P 500. That doesn’t include dividends, but the final numbers will. (The Buy List yields a little less than the market, but our dividends have grown faster.)
I should add a few caveats. One is that in May, we were trailing the market by 3%. We’ve made up a lot of lost ground since then. Also, this has been a very difficult year for stock-pickers. An indicator to watch is the equally weighted S&P 500 versus the regular cap-weighted index. This year, the equal-weighted index has lagged, which means fewer stocks are reaping the gains. Considering the fractious environment we’ve been dealt, I think we’re doing quite well. Fourteen of our 25 stocks have beaten the market. The problem is that we were weighed down by two 40% losers this year. Both are being sold.
The Five Sells
Now let’s discuss the five sells. Deciding what to sell is one of the most important and least-discussed issues in finance. Probably the worst investor in the world is the person who buys a stock at, say, $30 per share and then finds the stock is hanging around $27 or so. The investor doesn’t want to take the loss, so he or she holds on needlessly. As painful as it can be, the best way to sell a stock is to sell it. Just let it go. Be ruthless and focus on your next move. That’s why I think our once-a-year approach works for us.
The most common reason why I decide to sell is a stock is that it turns out to be something quite different from the company I bought. A good example of that is Wabtec. I like this company a lot, but we have to face the reality that once it combines with GE Transportation, it won’t be the same old Wabtec. Maybe it will be better. I certainly hope so, but it’s not the stock we bought. Companies are dynamic entities, and they change.
I should add that there are times when the acquiring company is quite good. A good example is Becton, Dickinson. The only reason why we have BDX is that they bought out CR Bard. After looking at the details, I thought BDX would be fine for us, and it’s been a decent performer for us this year.
Two more stocks that didn’t turn out to be what I thought they were are Carriage Services and Ingredion. Carriage was a bit of an oddball selection for us, but you need to comb through overlooked areas to find bargains. The problem is that I no longer have faith in its management. Their forecasts were far too optimistic. I should have been more skeptical. The same holds for Ingredion, but I think it’s a better company. Still, the company lowered guidance a few times this year. You can see why I rave so much about companies like Fiserv or AFLAC. They never let down investors like that. Again, I should have been more discerning.
There are times when I’ll let a stock go simply because I think it’s overpriced. Sometimes, I may be premature on my value judgments. That happened last year with both Heico and Microsoft. What happened? Both had very good years in 2018. Just because something is expensive doesn’t mean it can’t get more expensive.
This leads me to another rule: don’t get too stressed out about the performance of a stock you’ve sold. Trust me, I’ve wasted far too much energy on this pointless endeavor. That’s history, and you should move on.
Alliance Data Services is another example of a company that soon will no longer be what it was. The company told us as much. ADS said it’s doing a top-to-bottom analysis of its business, and it may restructure its operations. Again, I wish them well, but the question for investors now is about how well management can transform the business instead of the business itself. I understand that these tough decisions have to be made, but I’d rather look for proven winners.
With Snap-on, I heard too many bad stories about the relationship between the company and its franchisees. The stories were often very similar. Many franchisees feel they’re being taken advantage of. I know there are many who don’t feel that way, but I think the risk with SNA is too great.
Since we have 25 stocks and we change just five each year, that means the average holding period for a stock is five years. (Incidentally, our 20% is absurdly low for an active portfolio, but it’s not that far from the 5% or so of the S&P 500.) Knowing that we hold each stock for an average of five years really forces us to concentrate on each position. Are we comfortable having this on the Buy List every day for a half a decade, on average? That’s a good way to scare you off from Wall Street’s latest fad.
The Five New Buys
Now let’s turn to the five new guys. Honestly. I’ve wanted to add Disney (DIS) for years. Many investors love Disney, and it’s easy to see why. It’s one of the strongest brands in the world. Charlie Munger described Disney’s business as like an oil company that can put the oil back in after its done drilling, and drill it out again. No matter how technology changes, Disney always finds a way to use it to profit from its old merchandise.
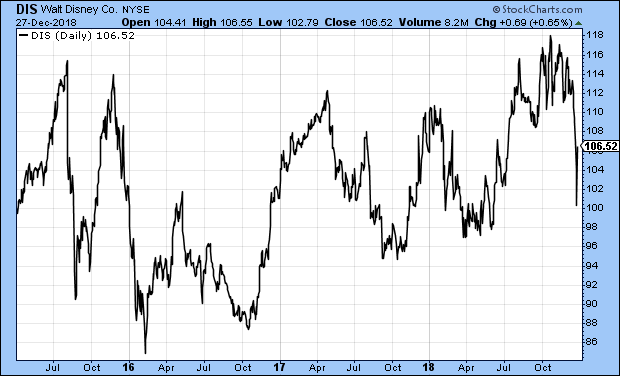
As much as I like Disney, the stock hasn’t done much over the past five years. The recent selloff gives us a good opportunity. One issue that bothered me was Disney’s ESPN division. Cord-cutting has taken a toll on ESPN, but the lower share price mitigates some of my concerns.
Hershey (HSY) is another great brand that hasn’t done much over the past four or five years. HSY is another defensive stock like Hormel or Church & Dwight. The stock currently yields over 2.7%, and Hershey has raised its dividend for the last several years in a row.
I was strongly leaning towards adding an aerospace/defense stock this year. There are some very good stocks, and I think the prices are quite good. Frankly, it was tough to decide between Raytheon, General Dynamics and Lockheed Martin. After speaking with people in the industry, I decided Raytheon (RTN) was the best stock. This is a very solid company. What I like is that there really aren’t many companies that can do what Raytheon does. The company is in the category of not-a-monopoly-but-kind-of-is. The stock currently yields 2.2%.
Speaking of monopolies, Broadridge Financial Solutions (BR) has market dominance in the field of proxy voting. It’s a great business to be in. Plus, the shares are currently down 30% from their 52-week high.
Eagle Bancorp (EGBN) is a small Maryland-based bank that’s well run. I always make the Buy List changes known before the end of the year so no one can claim I play games with timing. Unfortunately for the track record, Eagle jumped 6% on Wednesday (Disney was up 5%), and none of that counts for our track record. Even with the rally, Eagle is only going for 11 times 2018 earnings.
Also in 2019, Danaher will spin off its dental business as a publicly traded stock. That company will remain in our Buy List for the rest of the year. We’ll decide what to do with it next December.
Don’t Let the Market Scare You
I wanted to say a few words about the recent stock market. Obviously, it’s been highly volatile, and I won’t predict that the selling is over. However, I think the worst is probably over, and it’s reasonable for investors to act as if it were.
In most bear markets, the damage is concentrated in a short time period. This time, the S&P 500 lost 15.7% in 14 trading days. Even if we go lower, I doubt we’ll see another stretch quite that bad.
Please keep in mind that bear markets often have false rallies. Many of the best days in market history have come during bear markets. All that selling causes a massive reaction, but it doesn’t spell the end of the correction. Don’t be fooled. We’re going to see more volatility. Things will start to settle down once we cross above the 200-day moving average.
Bear markets are a natural part of investing. Expect a few more retests. Bear markets are usually over before anyone realizes it. It sounds obvious to say, but bull markets always start at the bottom of bear markets. The last few weeks have given investors a lot of bargains. This isn’t the time to get scared of them.
That’s all for now. Monday is the final trading day of the year. The stock market will be closed on Tuesday for New Year’s. On Tuesday, I’ll send you an email summarizing our 2018 Buy List. On Wednesday, we’ll get the ADP payroll report. Thursday is jobless claims and ISM. Then Friday is Jobs Day. Also on Friday, RPM International’s fiscal Q2 earnings are due out. Wall Street expects 68 cents per share. Be sure to keep checking the blog for daily updates.
I want to wish everyone a happy, healthy and profitable new year.
– Eddy
Turnaround Thursday
Eddy Elfenbein, December 27th, 2018 at 4:24 pmIt’s hard to make sense of the frenetic trading like we’ve seen today. In the last hour of trading, the Dow put on a furious rally. The index gained more than 800 points in a little over an hour.
At 2:34 pm, the Dow was at 22,306.55. By the close, the index was at 23,137.53. That’s 810 points in 86 minutes, and that comes after the largest point gain in history yesterday. Earlier today, ExxonMobil (XOM) got to an eight-year low today.
Morning News: December 27, 2018
Eddy Elfenbein, December 27th, 2018 at 7:16 amRange Resources Is Positioned To Take Advantage Of An Increase In WTI Crude Price
Oil Slips Back Toward 18-Month Lows on Oversupply
In Booming Oilfield, Natural Gas Can Be Free
China Heads Into Trade Talks Bracing for More U.S. Demands
India Curbs Power of Amazon and Walmart to Sell Products Online
As Credit Losses Pile Up, One Bond Guru Dismisses Crisis Talk
U.S. Commerce Department Won’t Publish Economic Data During Shutdown
Qualcomm Gets Jury in FTC Case That Threatens Its Smartphone Dominance
White House Considers New Year Executive Order to Bar Huawei, ZTE Purchases
Activist Fund Argyle Asks Toshiba to Exit TEC Business to Boost Margins
Athletes Don’t Own Their Tattoos. That’s a Problem for Video Game Developers
JPMorgan to Pay More Than $135 Million for Improper Handling of ADRs
Nick Maggiulli: Kind or Hostile
Cullen Roche: Trump Didn’t Cause the Stock Market Downturn
Blue Harbinger: Are You Staying Sane In This Crazy Market?
Be sure to follow me on Twitter.
Morning News: December 26, 2018
Eddy Elfenbein, December 26th, 2018 at 7:16 amWorld Economy Is Set to Feel the Delayed Trade War Pain in 2019
Gold Powers to Six-Month High as Turmoil Fires Up Haven Demand
Oil Rises to $51 After Steep Slide; Growth Fears Weigh
The Border Dividing Ireland Has Long Been Invisible. Brexit Threatens to Make It Real.
China Pledges to Treat State, Private and Foreign Firms Equally
Trump Praises Treasury Secretary Mnuchin But Hits Fed Again on Rate Rises
Whiff of Extinction Blows in Bull Market That Outlived Them All
Holiday Rest, but Little Relaxing, as Traders Size Up the Stock Market
China’s Car Slump Leaves Foreign Auto Makers With Idle Factories
T-Mobile Wins Team Telecom Support for Sprint Merger
Jeff Carter: AI Isn’t Automatic
Ben Carlson: My 2018 Recommendations
Michael Batnick: Don’t Fall For It
Howard Lindzon: Spending To Dominace and The Long Tail Is For Suckers
Joshua Brown: The Grinch Comes to Omaha
Be sure to follow me on Twitter.
- Tweets by @EddyElfenbein
-
-
Archives
- April 2024
- March 2024
- February 2024
- January 2024
- December 2023
- November 2023
- October 2023
- September 2023
- August 2023
- July 2023
- June 2023
- May 2023
- April 2023
- March 2023
- February 2023
- January 2023
- December 2022
- November 2022
- October 2022
- September 2022
- August 2022
- July 2022
- June 2022
- May 2022
- April 2022
- March 2022
- February 2022
- January 2022
- December 2021
- November 2021
- October 2021
- September 2021
- August 2021
- July 2021
- June 2021
- May 2021
- April 2021
- March 2021
- February 2021
- January 2021
- December 2020
- November 2020
- October 2020
- September 2020
- August 2020
- July 2020
- June 2020
- May 2020
- April 2020
- March 2020
- February 2020
- January 2020
- December 2019
- November 2019
- October 2019
- September 2019
- August 2019
- July 2019
- June 2019
- May 2019
- April 2019
- March 2019
- February 2019
- January 2019
- December 2018
- November 2018
- October 2018
- September 2018
- August 2018
- July 2018
- June 2018
- May 2018
- April 2018
- March 2018
- February 2018
- January 2018
- December 2017
- November 2017
- October 2017
- September 2017
- August 2017
- July 2017
- June 2017
- May 2017
- April 2017
- March 2017
- February 2017
- January 2017
- December 2016
- November 2016
- October 2016
- September 2016
- August 2016
- July 2016
- June 2016
- May 2016
- April 2016
- March 2016
- February 2016
- January 2016
- December 2015
- November 2015
- October 2015
- September 2015
- August 2015
- July 2015
- June 2015
- May 2015
- April 2015
- March 2015
- February 2015
- January 2015
- December 2014
- November 2014
- October 2014
- September 2014
- August 2014
- July 2014
- June 2014
- May 2014
- April 2014
- March 2014
- February 2014
- January 2014
- December 2013
- November 2013
- October 2013
- September 2013
- August 2013
- July 2013
- June 2013
- May 2013
- April 2013
- March 2013
- February 2013
- January 2013
- December 2012
- November 2012
- October 2012
- September 2012
- August 2012
- July 2012
- June 2012
- May 2012
- April 2012
- March 2012
- February 2012
- January 2012
- December 2011
- November 2011
- October 2011
- September 2011
- August 2011
- July 2011
- June 2011
- May 2011
- April 2011
- March 2011
- February 2011
- January 2011
- December 2010
- November 2010
- October 2010
- September 2010
- August 2010
- July 2010
- June 2010
- May 2010
- April 2010
- March 2010
- February 2010
- January 2010
- December 2009
- November 2009
- October 2009
- September 2009
- August 2009
- July 2009
- June 2009
- May 2009
- April 2009
- March 2009
- February 2009
- January 2009
- December 2008
- November 2008
- October 2008
- September 2008
- August 2008
- July 2008
- June 2008
- May 2008
- April 2008
- March 2008
- February 2008
- January 2008
- December 2007
- November 2007
- October 2007
- September 2007
- August 2007
- July 2007
- June 2007
- May 2007
- April 2007
- March 2007
- February 2007
- January 2007
- December 2006
- November 2006
- October 2006
- September 2006
- August 2006
- July 2006
- June 2006
- May 2006
- April 2006
- March 2006
- February 2006
- January 2006
- December 2005
- November 2005
- October 2005
- September 2005
- August 2005
- July 2005
 Eddy Elfenbein is a Washington, DC-based speaker, portfolio manager and editor of the blog Crossing Wall Street. His