Archive for February, 2015
-
The Nasdaq Finally Falls
Eddy Elfenbein, February 25th, 2015 at 8:42 pmAfter 10-straight up days, the Nasdaq finally fell today. The index lost a grand total of 0.98 points today which is -0.01973%. I hope we’re able recover from this setback.

Before the 10-day streak, the index had rallied 10 times in 16 sessions. The Nasdaq Composite closed today at 4,967.14. The all-time close was 5,048.62 on March 10, 2000.
-
The 20 Best Investing Blogs of 2015
Eddy Elfenbein, February 25th, 2015 at 8:38 pmI’m happy to be named as one of the 20 Best Investing Blogs of 2015 by the good folks at The College Investor. To celebrate, I’ll be having a kegger at the Delta Tau Chi house.
-
Morning News: February 25, 2015
Eddy Elfenbein, February 25th, 2015 at 7:04 amInvestors Who Held Nerve With Greece Reap World’s Best Bond Returns
HSBC, Europe’s Biggest Bank, To Testify on Tax Scandal
Net Neutrality a Big Step Nearer as Congress Republicans Concede Fight
Oil Rises to $59 as Saudis Say Demand Growing
Obama Vetoes Keystone XL Pipeline, Leaving It In Limbo
Hewlett-Packard Shares Take a Beating on Poor Sales
These Charts Show How Far Google and Facebook Are Ahead of Twitter
Lowe’s Reports Fourth Quarter Sales And Earnings Results
Black Friday Was Biggest Sales Day Ever at Home Depot
Comcast’s NBCUniversal Calls for Better Audience Measurement
Lego Reports Rise in Profit in 2014
Putting a Price on Simon Kuznets’s Nobel in Economics
How an Undocumented Immigrant From Mexico Became a Star at Goldman Sachs
Jeff Carter: Risk and Investing
Cullen Roche: Why Expectations-Based Econ Models Don’t Work
Be sure to follow me on Twitter.
-
The SRS for the NCAA Tournament
Eddy Elfenbein, February 24th, 2015 at 11:57 pmThis post is a small a detour from finance, but I found it interesting—and it’s probably interesting to maybe five other people on the planet.
Still, I wanted to calculate the Simple Ratings System for the seeds in the NCAA Basketball Tournament. Not the teams, but the seeds.
I had no idea how to do this, but I focused on the task and eventually figured it out. I love that sense of satisfaction when you accomplish something you thought was beyond you.
First, let me explain what the Simple Ratings System (SRS) is. Well, it’s exactly that—a simple way to give a quantitative rating to a sports team based on its record. Sabermetricians have been using it for years.
Here’s the idea: Take any sports league and calculate the average per-game point differential for every team in the league. Let’s say the Orangutans have scored, on average, 5 points more than their opponents each game.
You also see that the Orangutans’ opponents score, say, 2 points more on average than their opponents. Adding two together means the Orangutans are 7 points better than average. But wait—when we plug in 7 for the Orangutans’ margin of victory, that changes all the numbers for their opponents, and that comes back and changes all the numbers for the Orangutans. This loop will repeat itself again and again and again. Eventually, though, the numbers stop changing and you have your results. (This is what I was trying so hard to figure out.)
I wanted to calculate the SRS for the seeds of the NCAA Basketball Tournament. I took all the games of the last 30 years which is when it expanded to 64 teams. Since every team but one is knocked out, each year has 63 games. I didn’t include the play-in games since those are match-ups of same seeds. I also took out later games where same seeds met. There were 21 games like that and it only happens in the Semi-Finals or Finals.
Here’s what I got:
Seed MOV SOS SRS 1 12.08 -4.03 8.05 2 7.13 -1.96 5.17 3 5.23 -1.65 3.59 4 3.48 -1.57 1.90 5 0.97 -0.10 0.87 6 0.43 0.32 0.74 7 -0.54 0.89 0.35 8 -3.18 0.74 -2.44 9 -4.29 1.11 -3.18 10 -3.12 1.50 -1.62 11 -3.94 1.63 -2.30 12 -4.37 1.29 -3.08 13 -9.13 1.54 -7.59 14 -11.04 3.07 -7.97 15 -16.10 4.83 -11.27 16 -24.51 8.05 -16.46 The chart shows each seed, their Margin of Victory, their Strength of Schedule and their Simple Rating System. The first two add up to the third.
I thought this was an interesting exercise because the NCAA Tournament is specifically designed to have an unbalanced Strength of Schedule. The best teams play the worst. The #1 Seeds are supposed to be the best, and they are.
A few things to notice. After 30 years, a #16 has never beaten a #1. They’re 0-120. As a result, the #1 Seed’s SRS is the same as the #16 Seed’s SOS.
The SRS numbers are ranked in order except for the #8 and #9 Seeds. Those are lower than you would expect (#9 currently leads #8 in the First Round, 61 wins to 59). I assume that’s from being in the lucky position of getting to be the punching bag for the #1 Seed. The #1 Seed is 104-16 in Round 2. I would think the high Strength of Schedule would have corrected for that, but apparently not. I can’t say for sure.
The table also shows something I’ve suspected for a long time — that there isn’t much difference among the middle 8 teams (Seeds #5 to #12). There’s some difference, but not a lot. A game with an expected difference of 3 or 4 points will seem awfully close. Seeds #11 and #12 both have respectable records in the First Round. They’re worth a lot of points on the brackets, but it’s not much of an upset.
(This was my first time trying this, so if any experienced hand spots some mistakes, please let me know.)
Home Depot’s Solid Quarter
Eddy Elfenbein, February 24th, 2015 at 2:49 pmFive years ago, a reader asked me which I liked better, Lowe’s (LOW) or Home Depot (HD). I said it was close, but gave a slight edge to Home Depot. In retrospect, that seems to be largely correct. Both stocks have done well, while Home Depot has done a little bit better.
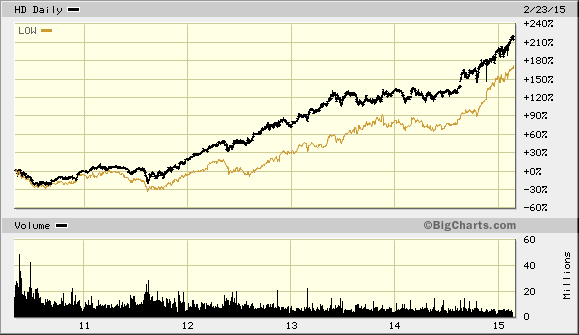
Shares of Home Depot are doing very well today, up about 4% as I write this. The company just delivered a solid earnings report; $1 per share in EPS which was 11 cents better than expectations. They raised their quarterly dividend from 47 to 59 cents per share.
Profit beat expectations as an improving job market encouraged Americans to spend more on renovations. Earlier on Tuesday, luxury home builder Toll Brothers Inc (TOL.N) reported a higher-than-expected quarterly profit and raised the low end of its full-year home delivery forecast as housing demand strengthened.
U.S. homebuilders remain upbeat about market conditions, according to a survey by the National Association of Home Builders published last week.
Home Depot also said it would buy back $18 billion of its shares, replacing a $17 billion buyback authorized in 2013.
The company said it expects full-year 2015 earnings of $5.11 to $5.17 per share, after accounting for share buybacks and sales growth of 3.5 to 4.7 percent.
Like so many other companies, Home Depot also warned about the negative impact of the strong dollar. This is getting to be a major issue for companies.
Yellen’s Testimony
Eddy Elfenbein, February 24th, 2015 at 10:24 amFed Chair Janet Yellen is testifying today on Capitol Hill. Here are her opening remarks.
Chairman Shelby, Ranking Member Brown, and members of the Committee, I am pleased to present the Federal Reserve’s semiannual Monetary Policy Report to the Congress. In my remarks today, I will discuss the current economic situation and outlook before turning to monetary policy.
Current Economic Situation and Outlook
Since my appearance before this Committee last July, the employment situation in the United States has been improving along many dimensions. The unemployment rate now stands at 5.7 percent, down from just over 6 percent last summer and from 10 percent at its peak in late 2009. The average pace of monthly job gains picked up from about 240,000 per month during the first half of last year to 280,000 per month during the second half, and employment rose 260,000 in January. In addition, long-term unemployment has declined substantially, fewer workers are reporting that they can find only part-time work when they would prefer full-time employment, and the pace of quits–often regarded as a barometer of worker confidence in labor market opportunities–has recovered nearly to its pre-recession level. However, the labor force participation rate is lower than most estimates of its trend, and wage growth remains sluggish, suggesting that some cyclical weakness persists. In short, considerable progress has been achieved in the recovery of the labor market, though room for further improvement remains.
At the same time that the labor market situation has improved, domestic spending and production have been increasing at a solid rate. Real gross domestic product (GDP) is now estimated to have increased at a 3-3/4 percent annual rate during the second half of last year. While GDP growth is not anticipated to be sustained at that pace, it is expected to be strong enough to result in a further gradual decline in the unemployment rate. Consumer spending has been lifted by the improvement in the labor market as well as by the increase in household purchasing power resulting from the sharp drop in oil prices. However, housing construction continues to lag; activity remains well below levels we judge could be supported in the longer run by population growth and the likely rate of household formation.
Despite the overall improvement in the U.S. economy and the U.S. economic outlook, longer-term interest rates in the United States and other advanced economies have moved down significantly since the middle of last year; the declines have reflected, at least in part, disappointing foreign growth and changes in monetary policy abroad. Another notable development has been the plunge in oil prices. The bulk of this decline appears to reflect increased global supply rather than weaker global demand. While the drop in oil prices will have negative effects on energy producers and will probably result in job losses in this sector, causing hardship for affected workers and their families, it will likely be a significant overall plus, on net, for our economy. Primarily, that boost will arise from U.S. households having the wherewithal to increase their spending on other goods and services as they spend less on gasoline.
Foreign economic developments, however, could pose risks to the outlook for U.S. economic growth. Although the pace of growth abroad appears to have stepped up slightly in the second half of last year, foreign economies are confronting a number of challenges that could restrain economic activity. In China, economic growth could slow more than anticipated as policymakers address financial vulnerabilities and manage the desired transition to less reliance on exports and investment as sources of growth. In the euro area, recovery remains slow, and inflation has fallen to very low levels; although highly accommodative monetary policy should help boost economic growth and inflation there, downside risks to economic activity in the region remain. The uncertainty surrounding the foreign outlook, however, does not exclusively reflect downside risks. We could see economic activity respond to the policy stimulus now being provided by foreign central banks more strongly than we currently anticipate, and the recent decline in world oil prices could boost overall global economic growth more than we expect.
U.S. inflation continues to run below the Committee’s 2 percent objective. In large part, the recent softness in the all-items measure of inflation for personal consumption expenditures (PCE) reflects the drop in oil prices. Indeed, the PCE price index edged down during the fourth quarter of last year and looks to be on track to register a more significant decline this quarter because of falling consumer energy prices. But core PCE inflation has also slowed since last summer, in part reflecting declines in the prices of many imported items and perhaps also some pass-through of lower energy costs into core consumer prices.
Despite the very low recent readings on actual inflation, inflation expectations as measured in a range of surveys of households and professional forecasters have thus far remained stable. However, inflation compensation, as calculated from the yields of real and nominal Treasury securities, has declined. As best we can tell, the fall in inflation compensation mainly reflects factors other than a reduction in longer-term inflation expectations. The Committee expects inflation to decline further in the near term before rising gradually toward 2 percent over the medium term as the labor market improves further and the transitory effects of lower energy prices and other factors dissipate, but we will continue to monitor inflation developments closely.
Monetary Policy
I will now turn to monetary policy. The Federal Open Market Committee (FOMC) is committed to policies that promote maximum employment and price stability, consistent with our mandate from the Congress. As my description of economic developments indicated, our economy has made important progress toward the objective of maximum employment, reflecting in part support from the highly accommodative stance of monetary policy in recent years. In light of the cumulative progress toward maximum employment and the substantial improvement in the outlook for labor market conditions–the stated objective of the Committee’s recent asset purchase program–the FOMC concluded that program at the end of October.
Even so, the Committee judges that a high degree of policy accommodation remains appropriate to foster further improvement in labor market conditions and to promote a return of inflation toward 2 percent over the medium term. Accordingly, the FOMC has continued to maintain the target range for the federal funds rate at 0 to 1/4 percent and to keep the Federal Reserve’s holdings of longer-term securities at their current elevated level to help maintain accommodative financial conditions. The FOMC is also providing forward guidance that offers information about our policy outlook and expectations for the future path of the federal funds rate. In that regard, the Committee judged, in December and January, that it can be patient in beginning to raise the federal funds rate. This judgment reflects the fact that inflation continues to run well below the Committee’s 2 percent objective, and that room for sustainable improvements in labor market conditions still remains.
The FOMC’s assessment that it can be patient in beginning to normalize policy means that the Committee considers it unlikely that economic conditions will warrant an increase in the target range for the federal funds rate for at least the next couple of FOMC meetings. If economic conditions continue to improve, as the Committee anticipates, the Committee will at some point begin considering an increase in the target range for the federal funds rate on a meeting-by-meeting basis. Before then, the Committee will change its forward guidance. However, it is important to emphasize that a modification of the forward guidance should not be read as indicating that the Committee will necessarily increase the target range in a couple of meetings. Instead the modification should be understood as reflecting the Committee’s judgment that conditions have improved to the point where it will soon be the case that a change in the target range could be warranted at any meeting. Provided that labor market conditions continue to improve and further improvement is expected, the Committee anticipates that it will be appropriate to raise the target range for the federal funds rate when, on the basis of incoming data, the Committee is reasonably confident that inflation will move back over the medium term toward our 2 percent objective.
It continues to be the FOMC’s assessment that even after employment and inflation are near levels consistent with our dual mandate, economic conditions may, for some time, warrant keeping the federal funds rate below levels the Committee views as normal in the longer run. It is possible, for example, that it may be necessary for the federal funds rate to run temporarily below its normal longer-run level because the residual effects of the financial crisis may continue to weigh on economic activity. As such factors continue to dissipate, we would expect the federal funds rate to move toward its longer-run normal level. In response to unforeseen developments, the Committee will adjust the target range for the federal funds rate to best promote the achievement of maximum employment and 2 percent inflation.
Policy Normalization
Let me now turn to the mechanics of how we intend to normalize the stance and conduct of monetary policy when a decision is eventually made to raise the target range for the federal funds rate. Last September, the FOMC issued its statement on Policy Normalization Principles and Plans. This statement provides information about the Committee’s likely approach to raising short-term interest rates and reducing the Federal Reserve’s securities holdings. As is always the case in setting policy, the Committee will determine the timing and pace of policy normalization so as to promote its statutory mandate to foster maximum employment and price stability.
The FOMC intends to adjust the stance of monetary policy during normalization primarily by changing its target range for the federal funds rate and not by actively managing the Federal Reserve’s balance sheet. The Committee is confident that it has the tools it needs to raise short-term interest rates when it becomes appropriate to do so and to maintain reasonable control of the level of short-term interest rates as policy continues to firm thereafter, even though the level of reserves held by depository institutions is likely to diminish only gradually. The primary means of raising the federal funds rate will be to increase the rate of interest paid on excess reserves. The Committee also will use an overnight reverse repurchase agreement facility and other supplementary tools as needed to help control the federal funds rate. As economic and financial conditions evolve, the Committee will phase out these supplementary tools when they are no longer needed.
The Committee intends to reduce its securities holdings in a gradual and predictable manner primarily by ceasing to reinvest repayments of principal from securities held by the Federal Reserve. It is the Committee’s intention to hold, in the longer run, no more securities than necessary for the efficient and effective implementation of monetary policy, and that these securities be primarily Treasury securities.
Summary
In sum, since the July 2014 Monetary Policy Report, there has been important progress toward the FOMC’s objective of maximum employment. However, despite this improvement, too many Americans remain unemployed or underemployed, wage growth is still sluggish, and inflation remains well below our longer-run objective. As always, the Federal Reserve remains committed to employing its tools to best promote the attainment of its objectives of maximum employment and price stability.
Thank you. I would be pleased to take your questions.
Morning News: February 24, 2015
Eddy Elfenbein, February 24th, 2015 at 7:07 amGreek Reform Proposals ‘Sufficient,’ EU Official Says
Oil Continues to Fall, and OPEC Isn’t Helping
Why Are Mystery Paris Drones Flying Over City Landmarks at Night?
Janet Yellen Confronts a Republican Congress
Obama Attacks Advisors Selling Snake Oil, Lauds New DOL Fiduciary Rule
Gazprom Threatens Natural Gas Deliveries to Ukraine
Bill Gates and Other Business Leaders Urge U.S. to Increase Energy Research
Why Lenders Love the $2.5 Million Home Loan
Home Depot Earnings Preview: Better Macroeconomic Conditions To Aid Sales
Comcast Profit Edges Higher on Broadband, Business-Services Strength
Target Raises Ante in E-Commerce Fight with Amazon, Walmart
Toll Brothers Profit Beat Estimates on Higher Home Sales
She Runs S.E.C. He’s a Lawyer. Recusals and Headaches Ensue.
Cullen Roche: The Media’s Overdramatization of the “Grexit” & its Impact on Your Portfolio
Roger Nusbaum: US Loses Monopoly For Kicking the Can
Be sure to follow me on Twitter.
Express Scripts Earns $1.39 per Share
Eddy Elfenbein, February 23rd, 2015 at 5:11 pmExpress Scripts (ESRX) just posted Q4 earnings of $1.39 per share. That beat estimates by one penny per share. The company earned $4.88 per share for the year.
“While we are proud of our heritage and the work we have done for clients, we are even more excited about the future we have ahead of us,” stated George Paz, chairman and chief executive officer. “We believe our growth and focused acquisition approach has positioned us uniquely in the healthcare services landscape to improve health outcomes and lower cost in an aligned model that keeps our clients and patients first, but also returns exceptional results to our shareholders.”
“We believe no one drives market change like we do, and no one matches our focus on serving patients and plan sponsors,” stated Tim Wentworth, president. “That combination is unique and creates significant value for our clients.”
The company also offered guidance for this year of $5.35 to $5.49 per share. That’s an optimistic forecast. Of course, it’s a wide range but I expect it to narrow as the year goes on.
The shares rose 0.74% today and hit a new 52-week high. They’re up another 2.28% after hours.
The Buy-and-Forget Strategy
Eddy Elfenbein, February 23rd, 2015 at 1:59 pmOne of my favorite financial writers, Morgan Housel, highlights some facts about buy-and-forget investing:
Since its beginning in 1957, almost 1,000 companies have been removed from the index, and another 1,000 new companies added.
Siegel calculated how the index would have performed if, rather than replacing old companies with new ones, investors had just stuck with the original components, letting dying companies die and reinvesting proceeds from buyouts into the surviving S&P 500 companies.
It’s pretty amazing.
“Those who bought the original 500 firms and never sold any of them outperformed not only the world’s most famous benchmark stock index but also the performance of most money managers and actively managed equity funds,” Siegel writes.
The normal S&P 500 returned 10.3% a year from its 1957 founding through Dec. 2003.
But if you stuck with the original 500 components, letting dying companies die and reinvesting proceeds from companies that were bought out into the surviving companies (there were 125 of them left by 2003), you earned 11.3% a year.
That’s amazing. It also illustrates how dynamic the broader market can be. New companies are always coming into the index. On balance, I suppose the legacy companies are better investments.
Introducing the CWS Robo-Advisor
Eddy Elfenbein, February 23rd, 2015 at 11:14 amAfter months of coding, I’m pleased to introduce the Crossing Wall Street Robo-Advisor!
It’s piece of cardboard with the word “Don’t!” on it.
I’m hoping to have a financial social media app by spring.
- Tweets by @EddyElfenbein
-
-
Archives
- April 2024
- March 2024
- February 2024
- January 2024
- December 2023
- November 2023
- October 2023
- September 2023
- August 2023
- July 2023
- June 2023
- May 2023
- April 2023
- March 2023
- February 2023
- January 2023
- December 2022
- November 2022
- October 2022
- September 2022
- August 2022
- July 2022
- June 2022
- May 2022
- April 2022
- March 2022
- February 2022
- January 2022
- December 2021
- November 2021
- October 2021
- September 2021
- August 2021
- July 2021
- June 2021
- May 2021
- April 2021
- March 2021
- February 2021
- January 2021
- December 2020
- November 2020
- October 2020
- September 2020
- August 2020
- July 2020
- June 2020
- May 2020
- April 2020
- March 2020
- February 2020
- January 2020
- December 2019
- November 2019
- October 2019
- September 2019
- August 2019
- July 2019
- June 2019
- May 2019
- April 2019
- March 2019
- February 2019
- January 2019
- December 2018
- November 2018
- October 2018
- September 2018
- August 2018
- July 2018
- June 2018
- May 2018
- April 2018
- March 2018
- February 2018
- January 2018
- December 2017
- November 2017
- October 2017
- September 2017
- August 2017
- July 2017
- June 2017
- May 2017
- April 2017
- March 2017
- February 2017
- January 2017
- December 2016
- November 2016
- October 2016
- September 2016
- August 2016
- July 2016
- June 2016
- May 2016
- April 2016
- March 2016
- February 2016
- January 2016
- December 2015
- November 2015
- October 2015
- September 2015
- August 2015
- July 2015
- June 2015
- May 2015
- April 2015
- March 2015
- February 2015
- January 2015
- December 2014
- November 2014
- October 2014
- September 2014
- August 2014
- July 2014
- June 2014
- May 2014
- April 2014
- March 2014
- February 2014
- January 2014
- December 2013
- November 2013
- October 2013
- September 2013
- August 2013
- July 2013
- June 2013
- May 2013
- April 2013
- March 2013
- February 2013
- January 2013
- December 2012
- November 2012
- October 2012
- September 2012
- August 2012
- July 2012
- June 2012
- May 2012
- April 2012
- March 2012
- February 2012
- January 2012
- December 2011
- November 2011
- October 2011
- September 2011
- August 2011
- July 2011
- June 2011
- May 2011
- April 2011
- March 2011
- February 2011
- January 2011
- December 2010
- November 2010
- October 2010
- September 2010
- August 2010
- July 2010
- June 2010
- May 2010
- April 2010
- March 2010
- February 2010
- January 2010
- December 2009
- November 2009
- October 2009
- September 2009
- August 2009
- July 2009
- June 2009
- May 2009
- April 2009
- March 2009
- February 2009
- January 2009
- December 2008
- November 2008
- October 2008
- September 2008
- August 2008
- July 2008
- June 2008
- May 2008
- April 2008
- March 2008
- February 2008
- January 2008
- December 2007
- November 2007
- October 2007
- September 2007
- August 2007
- July 2007
- June 2007
- May 2007
- April 2007
- March 2007
- February 2007
- January 2007
- December 2006
- November 2006
- October 2006
- September 2006
- August 2006
- July 2006
- June 2006
- May 2006
- April 2006
- March 2006
- February 2006
- January 2006
- December 2005
- November 2005
- October 2005
- September 2005
- August 2005
- July 2005
 Eddy Elfenbein is a Washington, DC-based speaker, portfolio manager and editor of the blog Crossing Wall Street. His