Archive for May, 2020
-
U.S. Savings Rate Soars to 33%
Eddy Elfenbein, May 29th, 2020 at 10:54 amThe day after the GDP report, we get reports on personal income and spending. This time was an odd one. For April, personal income rose by 10.5% while personal spending decreased by 13.6%. The lockdown has screwed with even boring economic stats. The savings rate soared to 33% as Americans are stockpiling cash.
The personal savings rate hit a historic 33% in April, the U.S. Bureau of Economic Analysis said Friday. This rate — how much people save as a percentage of their disposable income — is by far the highest since the department started tracking in the 1960s. April’s mark is up from 12.7% in March.
The swiftness and severity of a U.S. economic recovery hinges on whether consumers continue to stockpile cash or start to spend again.
“There is a tremendous uncertainty and virus fear that is lingering, and that is restraining people’s desire to go out and spend as they normally would,” said Gregory Daco, chief U.S. economist at Oxford Economics.
The previous record savings rate was 17.3% in May 1975, according to FactSet. The savings rate was elevated above 13% throughout most of the early 1970s. The increase in savings came as spending declined by a record 13.6% in April.
The stock market was doing well yesterday but dropped in the afternoon. The trend is continuing into today’s market. Traders could be nervous ahead of President Trump’s comments on China at today’s news conference.
-
CWS Market Review – May 29, 2020
Eddy Elfenbein, May 29th, 2020 at 7:08 am“I am not young enough to know everything.” – Oscar Wilde
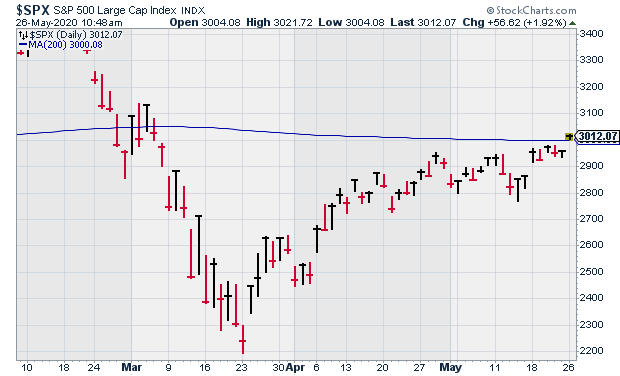
Despite more terrible economic news, the stock market has continued to climb higher. On Tuesday, the S&P 500 topped 3,000 for the first time in nearly three months. During the trading day on Thursday, the index got as high at 3,068 before dropping off in the afternoon.
The S&P 500 also broke above its 200-day moving average (the blue line in the chart below), which is a key technical indicator for chart watchers. That’s often an omen for higher share prices in the future.
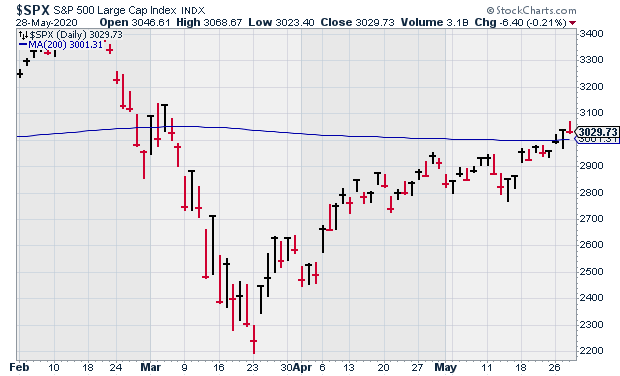
Importantly, we’re also seeing more stocks join in the party. A total of 95.4% of the stocks in the index are above their 50-day moving averages. That’s quite good. Ryan Detrick points out that in ten out of the last 11 times that that has happened, the market was higher a year later. The average gain was 16%.
The good news for stocks has come amid terrible news for the economy. The stock market isn’t merely “climbing a wall of worry.” It’s soaring on misery. On Thursday, we learned that another 2.1 million Americans filed for first-time jobless claims. Next Friday, we’ll get the jobs report for May, and it won’t be a pretty one.
In this week’s issue of CWS Market Review, I’ll update you on the latest for the economy and stock market. I’ll also cover the recent earnings reports from Ross Stores and Hormel Foods.
I’m pleased to see our stocks rally as well. Our Buy List is up 38% since the low from two months ago. Ten of our 25 stocks are up for the year. How about Trex? The deck stock has run a 33.2% gain so far this year. We also just got a new 52-week high from Sherwin-Williams. I’ll have more on our Buy List in a bit, but first, let’s look at the terrible economic news.
Climbing a Wall of Worry
On Thursday, we got a trio of lousy economic data. The jobless-claims report said that 2,123,000 Americans filed for jobless claims. That’s actually the eighth-straight improvement to that number in a row.
We also got the durable-goods report on Thursday. For the second-straight month, we saw a large drop. For April, durable goods fell by 17.2%. That’s on top of a 16.6% drop for March.
Lastly, the government revised the Q1 GDP growth report downward. The initial report had been for -4.8%. That was revised down to -5%.
In late July, we’ll get our first look at Q2 GDP, and it will be very bad. Merrill Lynch recently lowered its Q2 GDP estimates from -30% to -40%. Goldman expects -39%. The Atlanta Fed’s GDPNow expects -41.9%. That’s actually an improvement from earlier data.
I won’t hazard a guess at the Q2 number, but it will be bad. I hear from some folks who are puzzled by the market’s reaction. We should remember a few key facts. The first is that the market already plunged by 34%. It accurately foresaw the bad news we’re getting now. Perhaps the market is predicting a smoother recovery than we have reason to believe.
This year’s Q1 was the worst Q1 in the history of the S&P 500. Q2 is on pace for being the best Q2 in 82 years.
We should also remember that many companies are still making a profit. For the first quarter, the companies in the S&P 500 made about $20 per share. (That’s the index-adjusted figure. Every point in the index is worth about $8.3 billion.) At the start of the year, the expectation for Q1 had been for earnings of $40 per share, so the results were bad, but still profitable.
For Q2, Wall Street expects earnings of $23 per share. The consensus sees that rising to $31 for Q3 and to $36 for Q4. For 2021, analysts expect earnings of $162 per share. If that’s correct, it would be an all-time high. Let me add a major caveat that I’m skeptical of any data that far into the future. The point I want to make is that the main variable is how quickly we can get back to something approaching normal. If that happens in 18 months, then I think it’s reasonable that the market can safely look past the terrible numbers from this spring. This isn’t a normal market, so perhaps it doesn’t need normal analysis.
Not all the economic news has been terrible. Greg Ip had an interesting article in the Wall Street Journal highlighting some emerging signs of growth. For example, Uber said that rides have risen for three-straight weeks and that traffic is up 40% from the trough. Wendy’s said that same-store sales were down 2%. That’s an improvement from the low point of -26% a few weeks earlier. I also think we’ll see a shift away from goods made in China, particularly with regard to pharmaceuticals and technology.
What’s struck me lately is the components of the rally. I like to look at the S&P 500 High Beta Index divided by the S&P 500 Low Vol Index. This ratio is a quick way to read the market’s willingness to shoulder risk. That’s a key part in beginning and sustaining a recovery.
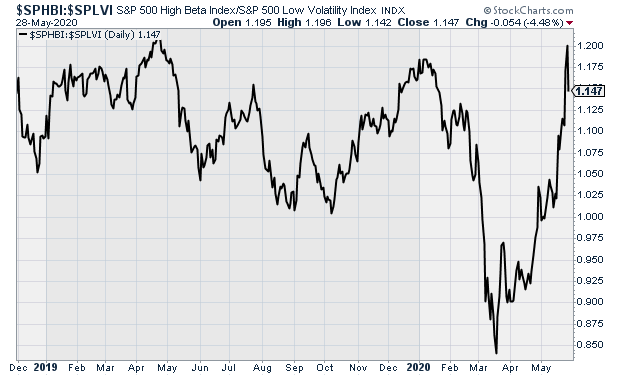
As one would expect, Low Vol crushed High Beta during the panic. Since the turnaround, High Beta has returned the favor and is beating on Low Vol. In fact, the ratio is basically back to where it was four months ago.
To me, this suggests the market sees a quicker and smoother recovery coming than is commonly believed. In particular, I’ve noticed the resurgence of stocks like Sherwin-Williams (SHW) and Middleby (MIDD).
I have to confess that I thought the rally that started on March 23 would be a short burst. I’m happy to have been proven wrong. I encourage investors to remain invested in a widely-diversified portfolio of high-quality stocks like you’ll find on our Buy List. Now let’s take a closer look at our recent earnings reports.
Earnings from Hormel Foods and Ross Stores
We had two earnings reports on May 21, from Hormel Foods and Ross Stores. These were for quarters ending in April.
Let’s start with Hormel Foods (HRL). The Spam folks reported for their fiscal Q2, and it was a tough quarter for them. Organic sales rose 6%, and EPS fell to 42 cents. The latter matched Wall Street’s consensus.
Like so many other companies, Hormel has withdrawn its guidance. For Q2, the company’s operating margin fell from 13.3% to 12.1%. That’s not a good sign.
Hormel said it absorbed about $20 million in “incremental supply-chain costs,” including employee bonuses and more cleaning expenses. Comparable-sales volumes increased by 7%.
Here’s the breakdown by segment:
Refrigerated Foods
Segment profit down 17%
Organic volume down 1%Grocery Products
Segment profit up 22%
Organic volume up 19%Jennie-O Turkey Store
Segment profit up 54%
Volume up 19%International & Other
Organic volume down 1%
Segment profit up 62%The CEO said, “even though the COVID-19 pandemic has caused a dramatic shift in consumer behavior, operational disruptions and extreme volatility in raw material markets, we remain financially strong and well-positioned to weather the pandemic.”
Hormel currently has over $600 million in cash on hand. The company is in a strong financial position with limited debt and consistent cash flows. Total debt is $315 million, up from $250 million at the beginning of the year.
The shares initially pulled back after the earnings report but have since moved higher. Hormel remains a good buy up to $48 per share.
Ross Stores (ROST) also released its earnings on May 21. Or rather, it would have reported earnings if the stores had been open. Instead, the company closed all of its stores, so Ross showed a big operating loss.
For the 13 weeks ending on May 2, Ross Stores lost 87 cents per share. That’s down from a profit of $1.13 per share one year ago. Ross also halted its dividend.
Total Q1 sales were $1.8 billion. That’s down from $3.8 billion for the same quarter one year ago. Q1 also includes a one-time charge of $313 million or 58 cents per share resulting from the extended period of store closures.
Ross’s Q1 guidance had been for $1.16 to $1.21 per share, but on March 19, they withdrew guidance. The company is a well-run outfit, and it’s prepared to ride out the storm. CEO Barbara Rentler said:
“In response to the economic disruption created by this global health crisis, we quickly took decisive actions to increase our liquidity and financial flexibility. These included drawing down $800 million under our revolving credit facility, completing a $2.0 billion public bond offering, suspending our stock-repurchase program, and aggressively cutting costs throughout the Company, including ongoing expenses and capital expenditures. Today we are announcing several additional actions, which include the suspension of our quarterly dividend program and reduced new-store openings for the year.”
Honestly, I’m not terribly concerned about Ross’s latest results. No one can make a profit when all their stores are shut. Still, I’m very confident that Ross will do well once the economy reopens.
On May 14, the deep-discounter began a phased reopening process. So far, approximately 700 stores have reopened. The stock has gained 17% in the last ten sessions. ROST remains a buy up to $100 per share.
Buy List Updates
There are a few of our Buy Below prices that I want to adjust this week.
Disney (DIS) said that Disney World will reopen on July 11. That’s very good news. Bear in mind, they’re not just flinging open the doors. Instead, it’s going to be a controlled process, and attendance will be capped. Epcot and Hollywood Studios will follow on July 15. I’m lifting my Buy Below on Disney to $125 per share.
FactSet (FDS) closed above $300 per share for the first time in three months. FactSet wraps up its fiscal Q3 at the end of May, and the company will report its earnings on June 25. Wall Street currently expects earnings of $2.43 per share. I’m lifting my Buy Below on FDS to $312 per share.
Like FactSet, RPM International (RPM) ends its quarter at the end of May. This is its fiscal Q4. Companies are allowed extra time to report their Q4 results, so RPM usually reports in late July. That places them in the middle of the regular earnings season. I like where this company is going. I’m hiking my Buy Below on RPM to $80 per share.
Trex (TREX) is turning into a home-run stock for us. On Monday, the deck-maker got as high as $132.84 per share during the trading day. We now have a 33.2% YTD gain in Trex. This week I’m raising our Buy Below on Trex to $128 per share.
Middleby (MIDD) may be our most dramatic stock this year. At one point, MIDD was a 60% loser for us. Since then, it’s rallied 60%. Despite that impressive turnaround, it’s still our biggest loser on the year. Don’t throw in the towel! Middleby remains a buy up to $72 per share.

That’s all for now. We’ll get many of the key turn-of-the-month economic reports next week. The ISM Manufacturing report is due out on Monday. The ADP payroll report comes out on Wednesday, along with the ISM Non-Manufacturing report. Thursday is yet another jobless-claims report. Then Friday is the biggie—the May jobs report. The last report showed a staggering loss of 20.5 million jobs. Be sure to keep checking the blog for daily updates. I’ll have more market analysis for you in the next issue of CWS Market Review!
– Eddy
-
Morning News: May 29, 2020
Eddy Elfenbein, May 29th, 2020 at 7:03 amBanks Told by EU to Take Climate Change Into Account in Lending
With ‘Main Street’ In View, Fed Weighs Risks of Job, Productivity Shocks
Mnuchin’s $29 Billion Loan Fund Untapped as Airlines Eye Rebound
Millions Relying on Pandemic Aid Can See Its End, and They’re Scared
Americans Have Stopped Thinking the Economy Is Getting Worse
Twitter Places Warning on a Trump Tweet, Saying It Glorified Violence
Pandemic Forces Car Dealers to Do the Unthinkable: Sell Online
Japan Backs Nearly a Third of $6.6 Billion Loans to Nissan
C.D.C. Recommends Sweeping Changes to American Offices
Elon Musk Earns First Performance-Based Payout From Tesla, Worth More Than $700 Million
SAT and ACT May Never Regain Their Role in College Admissions
Roger Nusbaum: Exchange Traded Endowment Portfolios Not Ready For Prime Time?
Joshua Brown: Explaining How Bank Loans Work
Howard Lindzon: The Shoulda Coulda’s…
Ben Carlson: A One-of-a-Kind Market Environment
Be sure to follow me on Twitter.
-
Wall Street’s Consensus
Eddy Elfenbein, May 28th, 2020 at 1:25 pmHere’s the S&P 500 (black line) along with its trailing earnings (blue line). The two lines are scaled at a ratio of 18 to 1. That means that whenever the lines cross, the P/E Ratio is exactly 18.
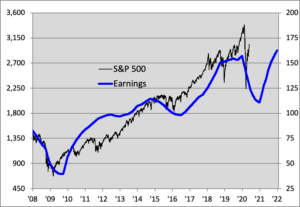
The future part of the earnings line is Wall Street’s consensus.
A few things to mention. I don’t mean to imply 18 is the correct P/E ratio. It just makes the chart look the most readable.
Wall Street sees year-over-year earnings bottoming in Q4, then rising sharply in 2021.
I’m also very skeptical of earnings forecasts that far out in the future, but it’s interesting to see what other people think.
-
Job Losses, Stocks Soar
Eddy Elfenbein, May 28th, 2020 at 11:02 amThis morning’s jobless claims report came in at 2,123,000. Remarkable, this is the eighth improvement to that number in a row.
Also, the Q1 GDP report was revised lower. The initial report had been for -4.8%. Today that was revised down to -5%.
Economists believe the lockdowns that shut wide swaths of the economy and triggered the layoffs of millions of workers will send the GDP sinking at an annual rate of 40% in the current quarter. That would be the biggest quarterly decline on records that go back to 1947. It would be four times the size of the previous decline set back in 1958.
Many forecasters believe growth will rebound sharply in the July-September quarter with the Congressional Budget Office predicting GDP will rise at an annual rate of 21.5%. Still, that gain would not be nearly enough to make up for the economic output that was lost during the first and second quarters.
At the end of July, we’ll get our first look at the Q2 GDP report. It will be historically terrible.
We also got the durable goods report this morning, and for the second straight month we saw a large drop. For April, durable goods fell by 17.2%. That’s on top of a 16.6% drop for March.
The stock market is up again today. The S&P 500 has been as high at 3,052 this morning.
-
Morning News: May 28, 2020
Eddy Elfenbein, May 28th, 2020 at 7:10 amWill the U.S. Soon Treat Hong Kong Like China? Much Is at Stake.
Trump-China Feud Is Increasing Risks for Markets and Economy
Should We Fear Post-Pandemic Inflation?
Big Bankruptcies Sweep the U.S. in Fastest Pace Since May 2009
Why The Small Business Rescue Program Has Slowed Way Down
U.S. States, Cities May Snub Fed Lending Program Over High Rates
Furious at Twitter, Trump Aims Executive Order at Tech Giants
‘Just Sitting in Limbo.’ For Many Professionals, Careers Are on Hold.
Alibaba Extends Its Reach In China As Coronavirus Outbreak Opens Doors
GM, Ford Turn to Fast-Payment Programs to Aid Suppliers Hit By Shutdowns
American Airlines to Cut 30% of Management and Administrative Staff & EasyJet To Cut Workforce By 30% As Coronavirus Pandemic Weighs
Michael Batnick: Animal Spirits: Valuations Don’t Matter
Ben Carlson: How Much of the Bear Market Losses Have Been Recovered?
Jeff Carter: A Trade Made is A Trade Made
Be sure to follow me on Twitter.
-
ATH…Almost….Kinda…Well, Not Really
Eddy Elfenbein, May 27th, 2020 at 4:51 pmReady for some serious cherry-picking of data?
Here goes.
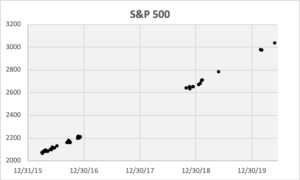
The S&P 500 closed at an all-time high today outside of one minor exception.
Just one day. March 16 to be exact.
If you had invested in the S&P 500 but avoided March 16, then you’d be at an all-time high today.
Ok, Ok. Now for the bad news. On March 16, the S&P 500 fell 11.98% for one of its worst days in history.
Going by today’s close, the S&P 500 is down 10.34% from its all-time reach on February 19. That was all covered by just one day of trading.
Here’s the S&P 500 over the last four years (data may be incomplete).
-
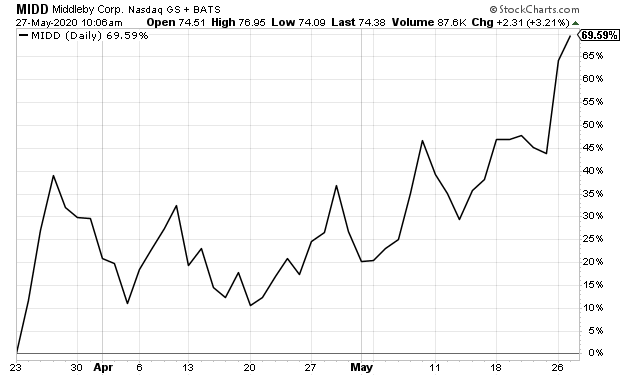
Middleby Soars
Eddy Elfenbein, May 27th, 2020 at 10:06 amThe stock market is having another good day. Yesterday the S&P 500 cracked 3,000 although it couldn’t close above it. This morning, the index has been as high as 3,021. Hopefully we can close above 3,000 today.
The Russell 2000 index of small-cap stocks is doing especially well while the Nasdaq Composite is down for the day.
The European Commission just unveiled a very large stimulus package aimed at helping countries struggling through the economic slowdown. The plan still needs to be approved but the total price tag could be 750 billion euros.
We’ve seen a growing split in this market. “High Beta” stocks, meaning those with greater risk, have been performing much better than the rest of the market. That’s to be expected in a rising market, but it’s been especially dramatic lately. This tells me that the market is becoming more open to risk-taking which is a good thing.
One stock that’s been doing very well lately has been Middleby (MIDD). That’s interesting because it had been such a poor performer before now. At one point, MIDD was down 60% on the year. Since then, it’s up over 70%. That’s still a big YTD loss, but it’s certainly a lot better than before.
-
Morning News: May 27, 2020
Eddy Elfenbein, May 27th, 2020 at 7:03 amEU Plans $823 Billion Fiscal Stimulus Package to Fund Recovery
Dismal Earnings, Bullish Stock Investors and the Fed’s Invisible Hand
The Fed Boldly Saves Markets. Now It’s Worrying About Main Street Business
Hedge Funds Pay Up in U.S. to Poach From Rivals Stung by Turmoil
Salaries Get Chopped for Many Americans Who Manage to Keep Jobs
Volkswagen In Final Talks to Seal Biggest M&A Deals In China EV Sector
Renault and Nissan Rule Out Merger As They Unveil Survival Plan
Tesla Cuts Prices By As Much As 6% in North America to Boost Demand
HBO Max Wants to ‘Crush’ Netflix. Is It Too Late?
Tired of Plastic? These Businesses Have Ideas for You
Nick Maggiulli: Nobody Knows Nothing
Ben Carlson: The Diversification Drag & The Management of Luck
Joshua Brown: Pop Culture As An Edge In Business
Howard Lindzon Welcoming Ross Hoffman – Venture Partner at Social Leverage
Be sure to follow me on Twitter.
-
The S&P 500 Breaks 3,000….Again
Eddy Elfenbein, May 26th, 2020 at 10:49 amI hope you had a relaxing Memorial Day weekend. Wall Street, apparently, needed some time to regroup. The S&P 500 opened this morning above 3,000. This is the first time in nearly three months that the index has traded above 3,000.
The NYSE also reopened its trading floor today. Governor Cuomo rang the opening bell.
Today looks to be a good example of what’s called a “counter-trend” day. That’s a fancy way of saying that the stocks that had been doing terribly are doing the best, and the ones that had been doing well are now lagging the pack.
It’s not necessarily a bad omen. It simply means that there’s some pushback against the dominant theme. The S&P 500 is also above its 200-day moving average. That’s a key technical indicator that a lot of chart-readers like to follow.
-
Archives
- July 2026
- June 2026
- May 2026
- April 2026
- March 2026
- February 2026
- January 2026
- December 2025
- November 2025
- October 2025
- September 2025
- August 2025
- July 2025
- June 2025
- May 2025
- April 2025
- March 2025
- February 2025
- January 2025
- December 2024
- November 2024
- October 2024
- September 2024
- August 2024
- July 2024
- June 2024
- May 2024
- April 2024
- March 2024
- February 2024
- January 2024
- December 2023
- November 2023
- October 2023
- September 2023
- August 2023
- July 2023
- June 2023
- May 2023
- April 2023
- March 2023
- February 2023
- January 2023
- December 2022
- November 2022
- October 2022
- September 2022
- August 2022
- July 2022
- June 2022
- May 2022
- April 2022
- March 2022
- February 2022
- January 2022
- December 2021
- November 2021
- October 2021
- September 2021
- August 2021
- July 2021
- June 2021
- May 2021
- April 2021
- March 2021
- February 2021
- January 2021
- December 2020
- November 2020
- October 2020
- September 2020
- August 2020
- July 2020
- June 2020
- May 2020
- April 2020
- March 2020
- February 2020
- January 2020
- December 2019
- November 2019
- October 2019
- September 2019
- August 2019
- July 2019
- June 2019
- May 2019
- April 2019
- March 2019
- February 2019
- January 2019
- December 2018
- November 2018
- October 2018
- September 2018
- August 2018
- July 2018
- June 2018
- May 2018
- April 2018
- March 2018
- February 2018
- January 2018
- December 2017
- November 2017
- October 2017
- September 2017
- August 2017
- July 2017
- June 2017
- May 2017
- April 2017
- March 2017
- February 2017
- January 2017
- December 2016
- November 2016
- October 2016
- September 2016
- August 2016
- July 2016
- June 2016
- May 2016
- April 2016
- March 2016
- February 2016
- January 2016
- December 2015
- November 2015
- October 2015
- September 2015
- August 2015
- July 2015
- June 2015
- May 2015
- April 2015
- March 2015
- February 2015
- January 2015
- December 2014
- November 2014
- October 2014
- September 2014
- August 2014
- July 2014
- June 2014
- May 2014
- April 2014
- March 2014
- February 2014
- January 2014
- December 2013
- November 2013
- October 2013
- September 2013
- August 2013
- July 2013
- June 2013
- May 2013
- April 2013
- March 2013
- February 2013
- January 2013
- December 2012
- November 2012
- October 2012
- September 2012
- August 2012
- July 2012
- June 2012
- May 2012
- April 2012
- March 2012
- February 2012
- January 2012
- December 2011
- November 2011
- October 2011
- September 2011
- August 2011
- July 2011
- June 2011
- May 2011
- April 2011
- March 2011
- February 2011
- January 2011
- December 2010
- November 2010
- October 2010
- September 2010
- August 2010
- July 2010
- June 2010
- May 2010
- April 2010
- March 2010
- February 2010
- January 2010
- December 2009
- November 2009
- October 2009
- September 2009
- August 2009
- July 2009
- June 2009
- May 2009
- April 2009
- March 2009
- February 2009
- January 2009
- December 2008
- November 2008
- October 2008
- September 2008
- August 2008
- July 2008
- June 2008
- May 2008
- April 2008
- March 2008
- February 2008
- January 2008
- December 2007
- November 2007
- October 2007
- September 2007
- August 2007
- July 2007
- June 2007
- May 2007
- April 2007
- March 2007
- February 2007
- January 2007
- December 2006
- November 2006
- October 2006
- September 2006
- August 2006
- July 2006
- June 2006
- May 2006
- April 2006
- March 2006
- February 2006
- January 2006
- December 2005
- November 2005
- October 2005
- September 2005
- August 2005
- July 2005
 Eddy Elfenbein is a Washington, DC-based speaker, portfolio manager and editor of the blog Crossing Wall Street. His