Archive for December, 2017
-
The 2018 Buy List
Eddy Elfenbein, December 31st, 2017 at 6:17 pmHere are the 25 stocks for the 2018 Buy List. It’s locked and sealed, and I can’t make any changes for 12 months.
For tracking purposes, I assume the Buy List is a $1 million portfolio that’s equally divided among 25 stocks. Below are all 25 positions with the number of shares for each and the closing price for 2017. Whenever I discuss how the Buy List is doing, the list below is what I’m referring to.
Company Ticker Price Shares Balance AFLAC AFL $87.78 455.6847 $40,000.00 Alliance Data Systems ADS $253.48 157.8034 $40,000.00 Becton, Dickinson BDX $214.06 186.8635 $40,000.00 Carriage Services CSV $25.71 1,555.8149 $40,000.00 Cerner CERN $67.39 593.5599 $40,000.00 Check Point Software CHKP $103.62 386.0259 $40,000.00 Church & Dwight CHD $50.17 797.2892 $40,000.00 Cognizant Technology Solutions CTSH $71.02 563.2216 $40,000.00 Continental Building Products CBPX $28.15 1,420.9591 $40,000.00 Danaher DHR $92.82 430.9416 $40,000.00 FactSet Research Systems FDS $192.76 207.5119 $40,000.00 Fiserv FISV $131.13 305.0408 $40,000.00 Hormel Foods HRL $36.39 1,099.2031 $40,000.00 Ingredion INGR $139.80 286.1230 $40,000.00 Intercontinental Exchange ICE $70.56 566.8934 $40,000.00 JM Smucker SJM $124.24 321.9575 $40,000.00 Moody’s MCO $147.61 270.9844 $40,000.00 Ross Stores ROST $80.25 498.4424 $40,000.00 RPM International RPM $52.42 763.0675 $40,000.00 Sherwin-Williams SHW $410.04 97.5515 $40,000.00 Signature Bank SBNY $137.26 291.4177 $40,000.00 Snap-on SNA $174.30 229.4894 $40,000.00 Stryker SYK $154.84 258.3312 $40,000.00 Torchmark TMK $90.71 440.9657 $40,000.00 Wabtec WAB $81.43 491.2195 $40,000.00 Total $1,000,000.00 The five new stocks are Carriage Services, Check Point Software Technologies, Church & Dwight, FactSet Research Systems and Torchmark.
Also, thanks to the recent merger, Becton, Dickinson will take the place of CR Bard.
The five deletions are Axalta Coating Systems, Cinemark Holdings, Express Scripts, HEICO and Microsoft.
Danaher is now our largest stock, with a market cap of $65 billion. The Buy List is mostly large- and mid-cap stocks. Only two are smaller than $7 billion. Continental Building Products is about $1 billion, and Carriage Services is $410 million.
Only AFLAC and Fiserv have been on the Buy List all 13 years. This is Stryker’s 11th year. FactSet is returning for the third time to the Buy List.
Here’s a brief look at our five new stocks.
Carriage Services (CSV) is a Texas-based funeral-home operator. They currently operate 178 funeral homes in 29 states, and 32 cemeteries in 11 states. Barely anyone on Wall Street follows Carriage, but the numbers look good.
Check Point Software Technologies (CHKP) is an Israeli-based computer-security firm. It’s not cheap at 19.7 times this year’s earnings, but I think that’s not a bad price considering their growth.
Church & Dwight (CHD) is a company I’ve wanted to add for many years. They’re a consumer-products stalwart. C&D owns several well-known brands like Arm & Hammer, OxiClean and, of course, Trojan.
FactSet Research Systems (FDS) is a financial-data and software company. They help provide all the numbers that investors love to crunch. The stock was previously on the Buy List from 2006 to 2009 and again in 2013. I probably should have had them on the whole time.
Torchmark (TMK) is a stock I’ve wanted to add to the Buy List for years. This is a very well-run insurance company based in Texas. Torchmark specializes in serving the middle-income market. The company almost always grows its operating income by 7% to 10% per share each year.
The 2017 Buy List
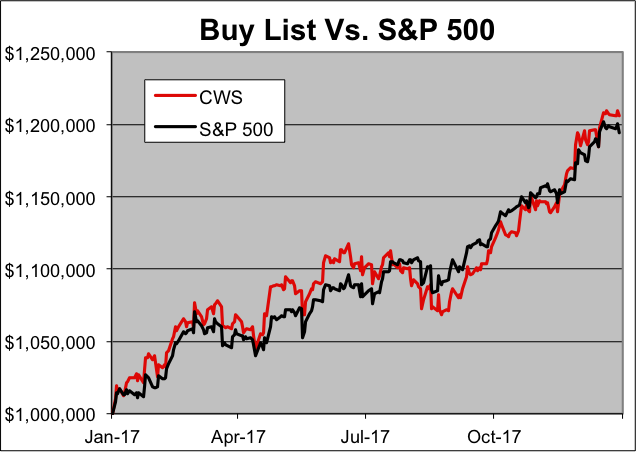
Eddy Elfenbein, December 31st, 2017 at 5:32 pmThe 2017 trading year is on the books! For 2017, the S&P 500 gained 19.42% while our Buy List gained 20.58%. However, if we include dividends (and total return is what really counts), then the S&P 500 gained 21.83% while out Buy List gained 21.79%.
In other words, we lost to the market by 0.04%! That comes to down to one penny over the whole year for every $25 invested.
I’m very competitive, so I hate losing to the market, even if it’s by a teeny amount. I will, however, add a few words in my defense. This was a difficult market to beat because a small number of very large companies did very well. That tended to distort the market’s overall return. About 55% of the stocks in the S&P 500 failed to beat the S&P 500.
Still, over the long haul, our Buy List has done very well. Over the last 12 years, the total compounded gain for the Buy List is 228.09%, compared with 176.11% for the S&P 500.
Our biggest winner this year was Moody’s (MCO), which gained more than 56%. HEICO (HEI) came in second. HEI was our #1 performer in 2016. Twenty-one of our 25 stocks finished in the black in 2017. Our biggest loser was Signature Bank (SBNY), which lost 8.6%.
For people who care about such things, the “beta” of our Buy List in 2017 was 1.0092. The correlation of the daily changes of the Buy List to the changes of the S&P 500 was 83.6%.
The chart below details the Buy List’s performance. I’ve listed each stock along with the number of shares and the starting and ending prices. For tracking purposes, I assume the Buy List is a $1 million portfolio that starts out equally divided among the 25 stocks.
Stock Shares 12/30/16 Beginning 12/29/17 Ending Profit/Loss AFL 574.7126 $69.60 $40,000 $87.78 $50,448.27 26.12% ADS 175.0547 $228.50 $40,000 $253.48 $44,372.87 10.93% AXTA 1470.5882 $27.20 $40,000 $32.36 $47,588.23 18.97% CERN 844.4163 $47.37 $40,000 $67.39 $56,905.21 42.26% CNK 1042.7529 $38.36 $40,000 $34.82 $36,308.66 -9.23% CBPX 1731.6017 $23.10 $40,000 $28.15 $48,744.59 21.86% CTSH 713.9033 $56.03 $40,000 $71.02 $50,701.41 26.75% BCR 178.0468 $224.66 $40,000 $331.24 $58,976.22 47.44% DHR 513.8746 $77.84 $40,000 $92.82 $47,697.84 19.24% ESRX 581.4799 $68.79 $40,000 $74.64 $43,401.66 8.50% FISV 376.3643 $106.28 $40,000 $131.13 $49,352.65 23.38% HEI 648.0881 $61.72 $40,000 $94.35 $61,147.11 52.87% HRL 1149.0951 $34.81 $40,000 $36.39 $41,815.57 4.54% INGR 320.1024 $124.96 $40,000 $139.80 $44,750.32 11.88% ICE 708.9685 $56.42 $40,000 $70.56 $50,024.82 25.06% MSFT 643.7078 $62.14 $40,000 $85.54 $55,062.77 37.66% MCO 424.3131 $94.27 $40,000 $147.61 $62,632.86 56.58% ROST 609.7561 $65.60 $40,000 $80.25 $48,932.93 22.33% RPM 743.0801 $53.83 $40,000 $52.42 $38,952.26 -2.62% SHW 148.8427 $268.74 $40,000 $410.04 $61,031.46 52.58% SBNY 266.3116 $150.20 $40,000 $137.26 $36,553.93 -8.62% SJM 312.3536 $128.06 $40,000 $124.24 $38,806.81 -2.98% SNA 233.5494 $171.27 $40,000 $174.30 $40,707.66 1.77% SYK 333.8619 $119.81 $40,000 $154.84 $51,695.18 29.24% WAB 481.8116 $83.02 $40,000 $81.43 $39,233.92 -1.92% Total $1,000,000 $1,205,845.20 Note that HEICO (HEI) split 5-for-4 on April 19.
Note on CR Bard (BCR). The company was bought out by Becton Dickinson (BDX). The deal was completed on December 29, the final trading day of the year. For the year-end price, we used the final price for BCR, which was $332.24, although BCR didn’t trade during the day on December 29.
Here’s how the Buy List performed throughout the year:
Here’s the data behind the dividend-adjusted returns. I’ve listed each stock’s beginning price, ending price and dividend-adjusted starting price. My source for dividend-adjusted prices is StockCharts.
Symbol Start Finish Adju Start Gain Gain w/Divs AFL $69.60 $87.78 $68.03 26.12% 29.03% ADS $228.50 $253.48 $226.49 10.93% 11.92% AXTA $27.20 $32.36 $27.20 18.97% 18.97% CERN $47.37 $67.39 $47.37 42.26% 42.26% CNK $38.36 $34.82 $37.20 -9.23% -6.40% CTSH $56.03 $71.02 $55.67 26.75% 27.57% CBPX $23.10 $28.15 $23.10 21.86% 21.86% BCR $224.66 $331.24 $223.86 47.44% 47.97% DHR $77.84 $92.82 $77.46 19.24% 19.83% ESRX $68.79 $74.64 $68.79 8.50% 8.50% FISV $106.28 $131.13 $106.28 23.38% 23.38% HEI $61.72 $94.35 $61.65 52.87% 53.04% HRL $34.81 $36.39 $34.10 4.54% 6.72% INGR $124.96 $139.80 $123.30 11.88% 13.38% ICE $56.42 $70.56 $55.73 25.06% 26.61% SJM $128.06 $124.24 $124.85 -2.98% -0.49% MSFT $62.14 $85.54 $60.78 37.66% 40.74% MCO $94.27 $147.61 $93.11 56.58% 58.53% ROST $65.60 $80.25 $64.96 22.33% 23.54% RPM $53.83 $52.42 $52.60 -2.62% -0.34% SHW $268.74 $410.04 $266.06 52.58% 54.12% SBNY $150.20 $137.26 $150.20 -8.62% -8.62% SNA $171.27 $174.30 $168.17 1.77% 3.65% SYK $119.81 $154.84 $118.70 29.24% 30.45% WAB $83.02 $81.43 $82.55 -1.92% -1.36% Total 20.58% 21.79% Every Buy List Stock
Eddy Elfenbein, December 31st, 2017 at 1:45 pmHere are all 81 Buy List stocks and when they made the cut.
Stocks ’06 ’07 ’08 ’09 ’10 ’11 ’12 ’13 ’14 ’15 ’16 ’17 ’18 ABT X ADS X X X AFL X X X X X X X X X X X X X APH X X X AXTA X BAX X X BBBY X X X X X X X X X X X BCR X X X X X X BDX X X X X BER/WRB X X BIIB X BLL X BMET X X BRO X CA X X X CBPX X X CERN X X X CHD X CHKP X CLC X CNK X CSV X CTSH X X X X X X X DCI X X X X DELL X DHR X X X X X X DLX X DTV X X X EBAY/PYPL X X ESRX X X X X EV X X EXPD X F X X X X X X FDS X X X X X X FIC X X FISV X X X X X X X X X X X X X GDW/WB X GGG X GILD X X HCBK X HD X HEI X X HOG X X X HRL X X X X HRS X X IBM X ICE X X INGR X X INTC X JNJ X X X JOSB X X X X X X JPM X X X LLY X X LNCR X LUK X X X X MCD X MCO X X MDT X X X X X X X X X MOG-A X X X X X X X X MSFT X X X X X NICK X X X X X X X ORCL X X X X X QCOM X X RAI X X X RESP X X ROST X X X X X X RPM X X SBNY X X X X SEIC X X X X X SHW X X SJM X X SNA X X X X SRCL X SYK X X X X X X X X X X X SYY X X X X X X X TMK X UNH X X X VAR X X WAB X X X X WFC X X X X WXS/WEX X X X X A few notes. AFLAC and Fiserv are the only two left that have been on every year. Stryker is on for the 11th year in a row.
Cinemark and Axalta depart after just one year on the Buy List. FactSet returns to the Buy List for a third time.
CWS Market Review – December 31, 2017
Eddy Elfenbein, December 31st, 2017 at 11:40 amThe 2017 trading year has come to a close. Overall, this was a very good year for the stock market. Plus, it was one of the least-volatile years on record.
For the year, the S&P 500 gained 19.42%. Including dividends, the S&P 500 gained 21.83%.
Our Buy List had another good year. For 2017, we gained 20.58%. Including dividends, we were up 21.79%.
That’s right—we lost to the market by 0.04%. In simpler terms, that’s one penny over the course of a year for every $25 invested.
I’m very competitive, so I hate losing at anything, even by such a small amount. In my defense, this was an unusual year for stocks. That’s because a small group of very large companies did well. Roughly 55% of the stocks in the S&P 500 failed to beat the index this year. I also think of how things would be different if Axalta had accepted the $37-per-share offer from Nippon Paint.
Still, our long-term track record is very good. Over the 12 years of the Buy List, our total compounded gain is 228.09% compared with 176.11% for the S&P 500.
The Final Numbers for 2017
With the Buy List, I always try to be as transparent as possible. The table below details the Buy List’s performance for 2017. I’ve listed each stock along with the number of shares and the starting and ending prices. For tracking purposes, I assume the Buy List is a $1 million portfolio that starts out equally divided among the 25 stocks.
Stock Shares 12/30/16 Beginning 12/29/17 Ending Profit/Loss AFL 574.7126 $69.60 $40,000 $87.78 $50,448.27 26.12% ADS 175.0547 $228.50 $40,000 $253.48 $44,372.87 10.93% AXTA 1470.5882 $27.20 $40,000 $32.36 $47,588.23 18.97% CERN 844.4163 $47.37 $40,000 $67.39 $56,905.21 42.26% CNK 1042.7529 $38.36 $40,000 $34.82 $36,308.66 -9.23% CBPX 1731.6017 $23.10 $40,000 $28.15 $48,744.59 21.86% CTSH 713.9033 $56.03 $40,000 $71.02 $50,701.41 26.75% BCR 178.0468 $224.66 $40,000 $331.24 $58,976.22 47.44% DHR 513.8746 $77.84 $40,000 $92.82 $47,697.84 19.24% ESRX 581.4799 $68.79 $40,000 $74.64 $43,401.66 8.50% FISV 376.3643 $106.28 $40,000 $131.13 $49,352.65 23.38% HEI 648.0881 $61.72 $40,000 $94.35 $61,147.11 52.87% HRL 1149.0951 $34.81 $40,000 $36.39 $41,815.57 4.54% INGR 320.1024 $124.96 $40,000 $139.80 $44,750.32 11.88% ICE 708.9685 $56.42 $40,000 $70.56 $50,024.82 25.06% MSFT 643.7078 $62.14 $40,000 $85.54 $55,062.77 37.66% MCO 424.3131 $94.27 $40,000 $147.61 $62,632.86 56.58% ROST 609.7561 $65.60 $40,000 $80.25 $48,932.93 22.33% RPM 743.0801 $53.83 $40,000 $52.42 $38,952.26 -2.62% SHW 148.8427 $268.74 $40,000 $410.04 $61,031.46 52.58% SBNY 266.3116 $150.20 $40,000 $137.26 $36,553.93 -8.62% SJM 312.3536 $128.06 $40,000 $124.24 $38,806.81 -2.98% SNA 233.5494 $171.27 $40,000 $174.30 $40,707.66 1.77% SYK 333.8619 $119.81 $40,000 $154.84 $51,695.18 29.24% WAB 481.8116 $83.02 $40,000 $81.43 $39,233.92 -1.92% Total $1,000,000 $1,205,845.20 Note that HEICO (HEI) split 5-for-4 on April 19.
The 2018 Buy List
Now let’s turn our attention to the new Buy List. Here are the 25 stocks for 2018:
AFLAC (AFL)
Alliance Data Systems (ADS)
Becton, Dickinson (BDX)
Carriage Services (CSV)
Cerner (CERN)
Check Point Software Technologies (CHKP)
Church & Dwight (CHD)
Continental Building Products (CBPX)
Cognizant Technology Solutions (CTSH)
Danaher (DHR)
FactSet Research Systems (FDS)
Fiserv (FISV)
Hormel Foods (HRL)
Ingredion (INGR)
Intercontinental Exchange (ICE)
Moody’s (MCO)
Ross Stores (ROST)
RPM International (RPM)
Sherwin-Williams (SHW)
Signature Bank (SBNY)
JM Smucker (SJM)
Snap-on (SNA)
Stryker (SYK)
Torchmark (TMK)
Wabtec (WAB)The five new stocks are Carriage Services (CSV), Check Point Software Technologies (CHKP), Church & Dwight (CHD), FactSet Research Systems (FDS) and Torchmark (TMK). I’ll have more on those in a bit.
Also, thanks to the merger, Becton, Dickinson (BDX) will take the place of CR Bard. I’m starting out BDX with a Buy Below price of $228 per share.
The five sells are Axalta Coating Systems (AXTA), Cinemark Holdings (CNK), Express Scripts (ESRX), HEICO (HEI) and Microsoft (MSFT).
Here’s the new $1 million portfolio, now divided equally among 25 stocks. Below are all 25 positions with the number of shares for each and the closing price for 2017. Whenever I discuss how well the Buy List is doing, the list below is what I’m referring to. The Buy List is now locked and sealed, and I can’t make any changes for 12 months.
Company Ticker Price Shares Balance AFLAC AFL $87.78 455.6847 $40,000.00 Alliance Data Systems ADS $253.48 157.8034 $40,000.00 Becton, Dickinson BDX $214.06 186.8635 $40,000.00 Carriage Services CSV $25.71 1,555.8149 $40,000.00 Cerner CERN $67.39 593.5599 $40,000.00 Check Point Software CHKP $103.62 386.0259 $40,000.00 Church & Dwight CHD $50.17 797.2892 $40,000.00 Cognizant Technology Solutions CTSH $71.02 563.2216 $40,000.00 Continental Building Products CBPX $28.15 1,420.9591 $40,000.00 Danaher DHR $92.82 430.9416 $40,000.00 FactSet Research Systems FDS $192.76 207.5119 $40,000.00 Fiserv FISV $131.13 305.0408 $40,000.00 Hormel Foods HRL $36.39 1,099.2031 $40,000.00 Ingredion INGR $139.80 286.1230 $40,000.00 Intercontinental Exchange ICE $70.56 566.8934 $40,000.00 JM Smucker SJM $124.24 321.9575 $40,000.00 Moody’s MCO $147.61 270.9844 $40,000.00 Ross Stores ROST $80.25 498.4424 $40,000.00 RPM International RPM $52.42 763.0675 $40,000.00 Sherwin-Williams SHW $410.04 97.5515 $40,000.00 Signature Bank SBNY $137.26 291.4177 $40,000.00 Snap-on SNA $174.30 229.4894 $40,000.00 Stryker SYK $154.84 258.3312 $40,000.00 Torchmark TMK $90.71 440.9657 $40,000.00 Wabtec WAB $81.43 491.2195 $40,000.00 Total $1,000,000.00 Danaher is now the largest stock with a market cap of $65 billion. The Buy List is largely large- and mid-cap stocks. Only two are smaller than $7 billion. Continental Building Products (CBPX) is about $1 billion, and Carriage Services (CSV) is $410 million.
Only AFLAC and Fiserv have been on the Buy List all 13 years. This is Stryker’s 11th year. FactSet is returning for the third time to the Buy List.
Our Five New Members
Here’s a brief look at our five new stocks plus their starting Buy Below prices. I’ll have more to say on each stock in upcoming issues.
Carriage Services (CSV) is one of those stocks that I’m sure has you thinking, “Poor Eddy has lost his mind.” Carriage is a funeral-home operator based in Texas. The company is also far smaller than most of the other companies on the Buy List. Still, it’s good to have a below-the-radar company in your portfolio. Barely anyone follows Carriage, but the numbers look good. I’m giving Carriage a Buy Below price of $28 per share.
Check Point Software Technologies (CHKP) is an Israeli-based computer-security firm. It’s not cheap at 19.7 times this year’s earnings, but I think that’s not a bad price considering their growth. Buy up to $111 per share.
Church & Dwight (CHD) is a company I’ve wanted to add for many years. They’re a very strong number in consumer staples. They own several well-known brands like Arm & Hammer, OxiClean and, of course, Trojan. Church & Dwight is a buy up to $54 per share.
FactSet Research Systems (FDS) is a financial-data and software company. They help provide all the numbers that investors love to crunch. The stock was previously on the Buy List from 2006 to 2009 and again in 2013. I probably should have had them on the whole time. I’m starting FactSet as a buy up to $202 per share.
Torchmark (TMK) is a stock I’ve wanted to add to the Buy List for years. This is a very well-run insurance company based in Texas. The company almost always grows its operating income by 7% to 10% per share each year. Buy below $97 per share.
One last item. RPM International (RPM) will release its fiscal Q2 earnings on Thursday, January 4. The consensus on Wall Street is for earnings of 59 cents per share. That’s up from 52 cents the year before.
That’s all for now. The new trading year begins bright and early on Tuesday morning. We’ll get some of the key turn-of-the-month econ reports. ISM comes out on Tuesday. The ADP payroll report is on Thursday. Then the big jobs report comes out next Friday. Be sure to keep checking the blog for daily updates. I want to wish everyone a happy, healthy and profitable New Year. I’ll have more market analysis for you in the next issue of CWS Market Review!
– Eddy
The Trading Year Ends
Eddy Elfenbein, December 29th, 2017 at 6:39 pm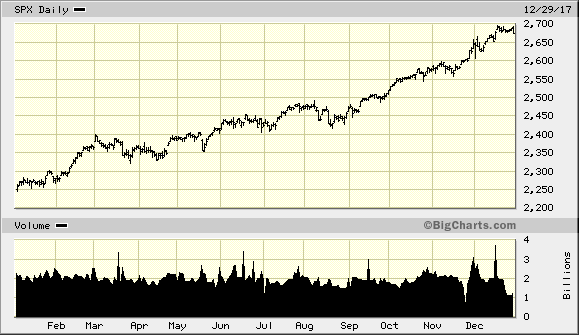
The 2017 trading year has come to a close. It was a good year for the stock market, and it was a historically calm year for stocks.
All told, the S&P 500 gained 19.42%. Including dividends, it was up 21.83%.
Our Buy List gained 20.58% on the year. With dividends, it was up 21.79%.
Morning News: December 29, 2017
Eddy Elfenbein, December 29th, 2017 at 7:01 amRivals Erode Bitcoin’s Store of Value
China Offers Tax Incentives to Persuade U.S. Companies to Stay
Why Shenzhen Is the Big 2017 Loser
As MiFID Nears, This Risk Officer Is Looking Forward to February
Trump Stretches Meaning of Deregulation in Touting Achievements
Last-Minute Rush to Prepay Taxes Gives Way to Confusion and Anger
SoftBank Succeeds in Tender Offer for Large Stake in Uber
General Electric: What To Look For In 2018
India’s Richest Man Bails Out Brother Fueling Record RCom Rally
Airbus Confirms $50 Billion Jet Order, One of the Biggest Aviation Deals in History
Apple Apologizes After Outcry Over Slowed iPhones
Ben Carlson: The First Rule of Personal Finance
Roger Nusbaum: What It Means To Be An Advisor
Mark Hines: Do You Know When to Fold Your Trades?
Cullen Roche: 2017 Fixed Income Review – Bond Permabears Wrong Again
Be sure to follow me on Twitter.
Wall Street’s Year-End Forecasts
Eddy Elfenbein, December 28th, 2017 at 2:09 pm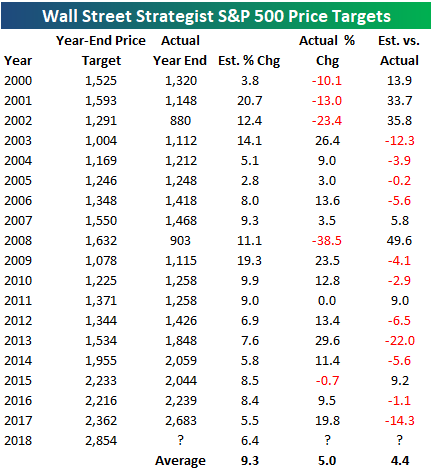
The chart above is from Bespoke Investment Group, and it lists Wall Street’s consensus for the market’s return over the coming year compared with how well the market actually did.
As you can see, Wall Street’s track record ain’t that good. On average, Wall Street has missed by 13.1%. If you simply said 9% every year, you would have beaten that.
Looking at the chart, it’s interesting how narrow Wall Street’s predictions are. Most of the projections listed above are between +5% and +10%. None was negative. The standard deviation of the market’s actual returns is four times that of the forecasts.
Here’s a scatterplot. The Y-axis is Wall Street’s forecasts and the X-axis is what really happened. The r-square is 0.01.
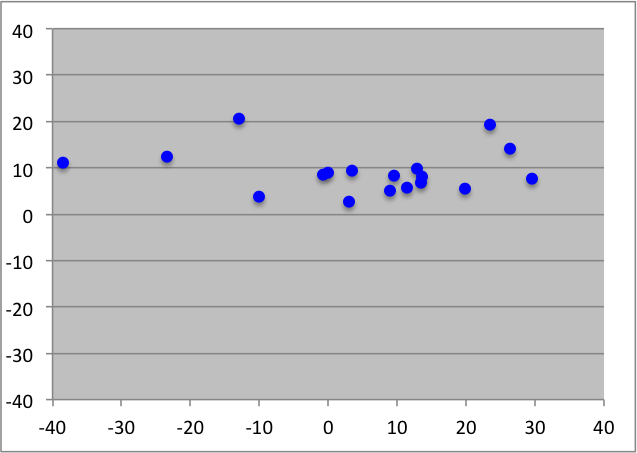
They kept the data ranges the same for both axes to show you how narrow Wall Street’s forecasts are.
Now here’s the same scatterplot but with one crucial difference. I set the coming year’s forecast against the just-completed year. The correlation is semi-strong (r-square of 0.59), but what’s striking is that the slope is negative.
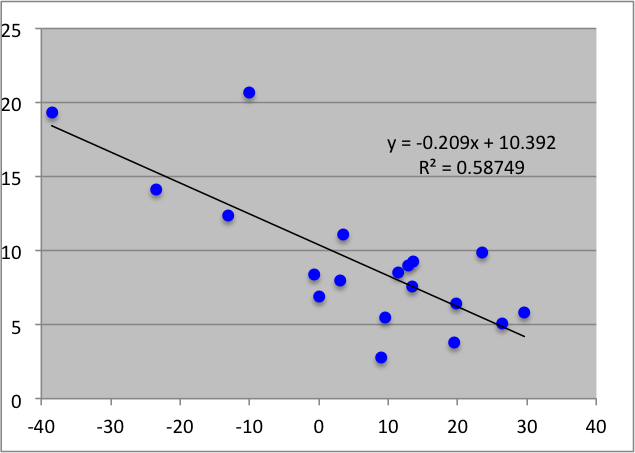
What this means is that Wall Street’s forecasts don’t tell you much about the coming year, but they say a decent amount about the year that just ended. The downward slope means that historically, analysts have predicted a bad year will be followed by a mildly good one, and a good one will be followed by a mildly bad one.
In other words, these folks get paid tons of money to predict simple regression to the mean. What the equation means is that to be a Wall Street analyst, start with 10% as your baseline prediction. Then take whatever the market did last year and divide it by 5. Now subtract that from 10%, and presto, you now have your expert forecast (or at least 58% of the way there)!
Update on BCR/BDX
Eddy Elfenbein, December 28th, 2017 at 11:10 amThis should happen tomorrow. Here’s a press release from this morning:
BD (Becton, Dickinson and Company) (BDX), a leading global medical technology company, issued the following statement regarding today’s clearance by the Ministry of Commerce of the People’s Republic of China (MOFCOM) for BD to acquire C. R. Bard (BCR), contingent on BD divesting its soft tissue core needle biopsy product line:
“MOFCOM clearance was the final regulatory approval needed to complete the Bard acquisition,” said Vincent A. Forlenza, chairman and CEO of BD. “We look forward to closing the transaction and welcoming Bard’s products and associates to the BD family.”
The proposed acquisition remains subject to the satisfaction of customary closing conditions. BD and Bard currently expect the proposed acquisition to close on Friday, Dec. 29.
Separately, BD’s proposed divestiture of its soft tissue core needle biopsy product line to Merit Medical is conditioned on MOFCOM approval of Merit as the purchaser.
Morning News: December 28, 2017
Eddy Elfenbein, December 28th, 2017 at 7:05 amOnce a Cash Cow, Venezuela’s Oil Company Now Verges on Collapse
South Korea Clamps Down on Bitcoin Trading Amid Market Frenzy
Bitcoin Tumbles Over Exchange-Closure Fears
Dollar Touches 1-Month Low as It Heads for Worst Year Since 2003
Flattening U.S. Yield Curve Nears Decade Lows in Final 2017 Push
Bond Giants Lay Out Their Top Trades for 2018
Shell, Barclays Detail Billions in Charges Related to U.S. Tax Changes
Prepaying Your Property Taxes? I.R.S. Cautions It Might Not Pay Off
Here’s What Retailers Have to Prove in 2018
Apple and Amazon in Talks to Set Up in Saudi Arabia
Is Airbus Finally Ready To Shut Down A380 Production?
Tesla, Inc. to Announce Vehicle Deliveries Next Week
Howard Lindzon: So Excited for 2018…
Jeff Carter: The New Trump Tax Law and REITs
Josh Brown: Three Things That Will Never Change in Wealth Management & Who Are You Competing With? & 50 Phrases to Run From
Be sure to follow me on Twitter.
Morning News: December 27, 2017
Eddy Elfenbein, December 27th, 2017 at 7:08 amOil Falls From 2015 Highs as Rally Runs Out of Steam
Copper Rallies to Three-Year High as China Plant Halts Output
Bitcoin Rebounds to Surpass $16,000 as Five-Day Selloff Ends
World’s Wealthiest Became $1 Trillion Richer in 2017
Frenzied Shopping Season, Record Hangover
Barclays Takes $1.3 Billion One-Time Charge From U.S. Tax Bill
Uber Working on Deal to Sell Xchange Leasing to Fair
Tesla’s Elon Musk Promises Pick-up Truck and New Features
China’s Geely Accelerates Global Growth With Volvo Truck Stake
How Big Tech Is Going After Your Health Care
’Nobody Thought It Would Come to This’: Drugmaker Teva Faces a Crisis
Prosecutors Affirm Push for Samsung Heir to Get 12-Year Sentence
Ben Carlson: Stock Market Valuations Won’t Predict the Next Crash
Michael Batnick: One Final Puff
Roger Nusbaum: New Cannabis ETF
Be sure to follow me on Twitter.
-
Archives
- July 2026
- June 2026
- May 2026
- April 2026
- March 2026
- February 2026
- January 2026
- December 2025
- November 2025
- October 2025
- September 2025
- August 2025
- July 2025
- June 2025
- May 2025
- April 2025
- March 2025
- February 2025
- January 2025
- December 2024
- November 2024
- October 2024
- September 2024
- August 2024
- July 2024
- June 2024
- May 2024
- April 2024
- March 2024
- February 2024
- January 2024
- December 2023
- November 2023
- October 2023
- September 2023
- August 2023
- July 2023
- June 2023
- May 2023
- April 2023
- March 2023
- February 2023
- January 2023
- December 2022
- November 2022
- October 2022
- September 2022
- August 2022
- July 2022
- June 2022
- May 2022
- April 2022
- March 2022
- February 2022
- January 2022
- December 2021
- November 2021
- October 2021
- September 2021
- August 2021
- July 2021
- June 2021
- May 2021
- April 2021
- March 2021
- February 2021
- January 2021
- December 2020
- November 2020
- October 2020
- September 2020
- August 2020
- July 2020
- June 2020
- May 2020
- April 2020
- March 2020
- February 2020
- January 2020
- December 2019
- November 2019
- October 2019
- September 2019
- August 2019
- July 2019
- June 2019
- May 2019
- April 2019
- March 2019
- February 2019
- January 2019
- December 2018
- November 2018
- October 2018
- September 2018
- August 2018
- July 2018
- June 2018
- May 2018
- April 2018
- March 2018
- February 2018
- January 2018
- December 2017
- November 2017
- October 2017
- September 2017
- August 2017
- July 2017
- June 2017
- May 2017
- April 2017
- March 2017
- February 2017
- January 2017
- December 2016
- November 2016
- October 2016
- September 2016
- August 2016
- July 2016
- June 2016
- May 2016
- April 2016
- March 2016
- February 2016
- January 2016
- December 2015
- November 2015
- October 2015
- September 2015
- August 2015
- July 2015
- June 2015
- May 2015
- April 2015
- March 2015
- February 2015
- January 2015
- December 2014
- November 2014
- October 2014
- September 2014
- August 2014
- July 2014
- June 2014
- May 2014
- April 2014
- March 2014
- February 2014
- January 2014
- December 2013
- November 2013
- October 2013
- September 2013
- August 2013
- July 2013
- June 2013
- May 2013
- April 2013
- March 2013
- February 2013
- January 2013
- December 2012
- November 2012
- October 2012
- September 2012
- August 2012
- July 2012
- June 2012
- May 2012
- April 2012
- March 2012
- February 2012
- January 2012
- December 2011
- November 2011
- October 2011
- September 2011
- August 2011
- July 2011
- June 2011
- May 2011
- April 2011
- March 2011
- February 2011
- January 2011
- December 2010
- November 2010
- October 2010
- September 2010
- August 2010
- July 2010
- June 2010
- May 2010
- April 2010
- March 2010
- February 2010
- January 2010
- December 2009
- November 2009
- October 2009
- September 2009
- August 2009
- July 2009
- June 2009
- May 2009
- April 2009
- March 2009
- February 2009
- January 2009
- December 2008
- November 2008
- October 2008
- September 2008
- August 2008
- July 2008
- June 2008
- May 2008
- April 2008
- March 2008
- February 2008
- January 2008
- December 2007
- November 2007
- October 2007
- September 2007
- August 2007
- July 2007
- June 2007
- May 2007
- April 2007
- March 2007
- February 2007
- January 2007
- December 2006
- November 2006
- October 2006
- September 2006
- August 2006
- July 2006
- June 2006
- May 2006
- April 2006
- March 2006
- February 2006
- January 2006
- December 2005
- November 2005
- October 2005
- September 2005
- August 2005
- July 2005
 Eddy Elfenbein is a Washington, DC-based speaker, portfolio manager and editor of the blog Crossing Wall Street. His