Archive for December, 2021
-
The 2022 Buy List
Eddy Elfenbein, December 31st, 2021 at 9:15 pmHere are the 25 stocks for the 2022 Buy List. It’s locked and sealed, and I can’t make any changes for 12 months.
For tracking purposes, I assume the Buy List is a $1 million portfolio that’s equally divided among 25 stocks. Below are all 25 positions with the number of shares for each and the closing price for 2021. Whenever I discuss how the Buy List is doing, the list below is what I’m referring to.
Company Ticker Price Shares Balance Abbott Laboratories ABT $140.74 284.212022 $40,000.00 AFLAC AFL $58.39 685.048810 $40,000.00 Broadridge Financial Solutions BR $182.82 218.794443 $40,000.00 Carrier Global CARR $54.24 737.463127 $40,000.00 Church & Dwight CHD $102.50 390.243902 $40,000.00 Danaher DHR $329.01 121.576852 $40,000.00 FactSet FDS $486.01 82.302833 $40,000.00 Fair Isaac FICO $433.67 92.236032 $40,000.00 Fiserv FISV $103.79 385.393583 $40,000.00 HEICO HEI $144.22 277.354042 $40,000.00 Hershey HSY $193.47 206.750401 $40,000.00 Intercontinental Exchange ICE $136.77 292.461797 $40,000.00 Moody’s MCO $390.58 102.411798 $40,000.00 Miller Industries MLR $33.40 1,197.604790 $40,000.00 Otis Worldwide OTIS $87.07 459.400482 $40,000.00 Reynolds Consumer Products REYN $31.40 1,273.885350 $40,000.00 Ross Stores ROST $114.28 350.017501 $40,000.00 Science Applications International SAIC $83.59 478.526139 $40,000.00 Stepan SCL $124.29 321.827983 $40,000.00 Sherwin-Williams SHW $352.16 113.584734 $40,000.00 Silgan SLGN $42.84 933.706816 $40,000.00 Stryker SYK $267.42 149.577444 $40,000.00 Thermo Fisher TMO $667.24 59.948444 $40,000.00 Trex TREX $135.03 296.230467 $40,000.00 Zoetis ZTS $244.03 163.914273 $40,000.00 Total $1,000,000.00 The five news buys are Carrier Global (CARR), Fair Isaac (FICO), Otis Worldwide (OTIS), Reynolds Consumer Products (REYN) and Science Applications International (SAIC). Fair Isaac is a returning member. It was on our Buy List in 2006 and 2007.
The five sells are Ansys (ANSS), Cerner (CERN), Check Point Software (CHKP), Disney (DIS) and Middleby (MIDD).
Only AFLAC (AFL) and Fiserv (FISV) have been on the Buy List all 17 years. This is Stryker’s (SYK) 15th year.
Thermo Fisher Scientific (TMO) is our largest stock with a market value of $263 billion. Miller Industries (MLR) is by far our smallest with a market value of $381 million. Stepan (SCL) is our second smallest and its market value is more than seven times that of Miller.
Here are the corporate descriptions of our five new stocks:
Carrier Global Corporation is located in Palm Beach Gardens, FL, United States and is part of the Ventilation, Heating, Air-Conditioning, and Commercial Refrigeration Equipment Manufacturing Industry. Carrier Global Corporation has 56,000 total employees across all of its locations and generates $17.46 billion in sales (USD). There are 1,495 companies in the Carrier Global Corporation corporate family.
FICO powers decisions that help people and businesses around the world prosper. Founded in 1956 and based in Silicon Valley, the company is a pioneer in the use of predictive analytics and data science to improve operational decisions. FICO holds more than 200 US and foreign patents on technologies that increase profitability, customer satisfaction and growth for businesses in financial services, manufacturing, telecommunications, health care, retail and many other industries. Using FICO solutions, businesses in more than 120 countries do everything from protecting 2.6 billion payment cards from fraud, to helping people get credit, to ensuring that millions of airplanes and rental cars are in the right place at the right time.
Otis is the world’s leading elevator and escalator manufacturing, installation and service company. We move 2 billion people a day and maintain approximately 2.1 million customer units worldwide, the industry’s largest Service portfolio. Headquartered in Connecticut, USA, Otis is 69,000 people strong, including 40,000 field professionals, all committed to meeting the diverse needs of our customers and passengers in more than 200 countries and territories worldwide.
RCP’s mission is to simplify daily life so consumers can enjoy what matters most. RCP is a market-leading consumer products company with a presence in 95% of households across the United States. RCP produces and sells products across three broad categories: cooking products, waste & storage products and disposable tableware; that are sold under iconic brands such as Reynolds and Hefty, as well as under store brands that are strategically important to RCP’s customers. Overall, across both branded and store brand offerings, RCP holds the #1 or #2 U.S. market share position in the majority of product categories in which it participates.
SAIC® is a premier Fortune 500® technology integrator driving our nation’s technology transformation. Our robust portfolio of offerings across the defense, space, civilian, and intelligence markets includes secure high-end solutions in engineering, digital, artificial intelligence, and mission solutions. Using our expertise and understanding of existing and emerging technologies, we integrate the best components from our own portfolio and our partner ecosystem to deliver innovative, effective, and efficient solutions that are critical to achieving our customers’ missions.
We are more than 26,000 strong; driven by mission, united by purpose, and inspired by opportunities. Headquartered in Reston, Virginia, SAIC has annual revenues of approximately $7.2 billion.
The 2021 Buy List
Eddy Elfenbein, December 31st, 2021 at 5:53 pmThe 2021 trading year is on the books!
It was a good one for us. Our 2021 Buy List gained 21.25% this year. Including dividends, we were up 22.25%. This was one of our best years ever.
Trex (TREX) repeated as our top-performing stock, with a gain of 61.29%. That was followed by Middleby (MIDD) at 52.62% and Danaher (DHR) at 48.11%. We had seven stocks up more than 40% this year.
Zoetis (ZTS) was our best turnaround stock. By March, it was a 12% loser, but it finished the year up 47.45%. I’m glad we held on.
Our biggest loser of the year was Disney (DIS), which lost 14.51%. That happened despite the company’s reporting massive earnings surprises in February and May.
Check Point Software (CHKP) was our second-biggest loser, with a loss of 12.30%. Miller Industries (MLR) was our worst turnaround story. It ran out to a 24% gain by April but finished the year down 12.15%.
The 2021 Buy List
Here’s a breakdown of how our Buy List performed in 2021. For tracking purposes, I assume the Buy List is a $1 million portfolio. All 25 stocks are equally weighted at the start of the year.
Stock Shares 12/31/20 Beginning 12/31/21 Ending Profit/Loss ABT 365.330167 $109.49 $40,000.00 $140.74 $51,416.57 28.54% AFL 899.482797 $44.47 $40,000.00 $58.39 $52,520.80 31.30% ANSS 109.950522 $363.80 $40,000.00 $401.12 $44,103.35 10.26% BR 261.096606 $153.20 $40,000.00 $182.82 $47,733.68 19.33% CERN 509.683996 $78.48 $40,000.00 $92.87 $47,334.35 18.34% CHKP 300.955534 $132.91 $40,000.00 $116.56 $35,079.38 -12.30% CHD 458.557836 $87.23 $40,000.00 $102.50 $47,002.18 17.51% DHR 180.066625 $222.14 $40,000.00 $329.01 $59,243.72 48.11% DIS 220.774920 $181.18 $40,000.00 $154.89 $34,195.83 -14.51% FDS 120.300752 $332.50 $40,000.00 $486.01 $58,467.37 46.17% FISV 351.308625 $113.86 $40,000.00 $103.79 $36,462.32 -8.84% HEI 302.114804 $132.40 $40,000.00 $144.22 $43,571.00 8.93% HSY 262.587803 $152.33 $40,000.00 $193.47 $50,802.86 27.01% ICE 346.951167 $115.29 $40,000.00 $136.77 $47,452.51 18.63% MIDD 310.269935 $128.92 $40,000.00 $196.76 $61,048.71 52.62% MLR 1,052.077854 $38.02 $40,000.00 $33.40 $35,139.40 -12.15% MCO 137.816979 $290.24 $40,000.00 $390.58 $53,828.56 34.57% ROST 325.706376 $122.81 $40,000.00 $114.28 $37,221.72 -6.95% SHW 163.285299 $244.97 $40,000.00 $352.16 $57,502.55 43.76% SLGN 1,078.748652 $37.08 $40,000.00 $42.84 $46,213.59 15.53% SCL 335.232987 $119.32 $40,000.00 $124.29 $41,666.11 4.17% SYK 163.238655 $245.04 $40,000.00 $267.42 $43,653.28 9.13% TMO 85.877453 $465.78 $40,000.00 $667.24 $57,300.87 43.25% TREX 477.783086 $83.72 $40,000.00 $135.03 $64,515.05 61.29% ZTS 241.691843 $165.50 $40,000.00 $244.03 $58,980.06 47.45% Total $1,000,000.00 $1,212,455.83 21.25% Here’s the data behind the dividend-adjusted returns. I’ve listed each stock’s beginning price, ending price and dividend-adjusted starting price.
Stock Start Finish Adju Start Gain Gain w/Divs ABT $109.49 $140.74 $107.82 28.54% 30.53% AFL $44.47 $58.39 $43.40 31.30% 34.54% ANSS $363.80 $401.12 $363.80 10.26% 10.26% BR $153.20 $182.82 $150.95 19.33% 21.11% CERN $78.48 $92.87 $77.56 18.34% 19.74% CHKP $132.91 $116.56 $132.91 -12.30% -12.30% CHD $87.23 $102.50 $86.21 17.51% 18.90% DHR $222.14 $329.01 $221.46 48.11% 48.56% DIS $181.18 $154.89 $181.18 -14.51% -14.51% FDS $332.50 $486.01 $329.52 46.17% 47.49% FISV $113.86 $103.79 $113.86 -8.84% -8.84% HEI $132.40 $144.22 $132.23 8.93% 9.07% HSY $152.33 $193.47 $149.30 27.01% 29.58% ICE $115.29 $136.77 $114.03 18.63% 19.94% MIDD $128.92 $196.76 $128.92 52.62% 52.62% MLR $38.02 $33.40 $37.32 -12.15% -10.50% MCO $290.24 $390.58 $288.09 34.57% 35.58% ROST $122.81 $114.28 $121.62 -6.95% -6.04% SHW $244.97 $352.16 $243.04 43.76% 44.90% SLGN $37.08 $42.84 $36.60 15.53% 17.05% SCL $119.32 $124.29 $118.11 4.17% 5.23% SYK $245.04 $267.42 $242.61 9.13% 10.23% TMO $465.78 $667.24 $464.85 43.25% 43.54% TREX $83.72 $135.03 $83.72 61.29% 61.29% ZTS $165.50 $244.03 $164.59 47.45% 48.27% Total 21.25% 22.25% For the year, the S&P 500 gained 26.89%. Including dividends, the index was up 28.71%.
While we underperformed the overall market, I’m not disappointed with a gain of more than 22%. We also closed the gap significantly towards the end of the year. Here’s how we did against the S&P 500:

Our 16-year track is still well ahead of the S&P 500: 490.52% to 428.98%.
It’s not unusual for us to lag the market during bullish years. Our “beta” this year was 0.858. The daily changes on our Buy List had an 87.2% correlation with the daily changes of the S&P 500.
Every Buy List Stock
Eddy Elfenbein, December 31st, 2021 at 5:32 pmHere are all 98 Buy List stocks and when they made the cut.
Stocks ’06 ’07 ’08 ’09 ’10 ’11 ’12 ’13 ’14 ’15 ’16 ’17 ’18 ’19 ’20 ’21 ’22 ABT X X X ADS X X X AFL X X X X X X X X X X X X X X X X X ANSS X X APH X X X AXTA X BAX X X BBBY X X X X X X X X X X X BCR X X X X X X BDX X X X X X X BER/WRB X X BIIB X BLL X BMET X X BR X X X X BRO X CA X X X CARR X CBPX X X X CERN X X X X X X CHD X X X X X CHKP X X X X CLC X CNK X CSV X CTSH X X X X X X X X DCI X X X X DELL X DHR X X X X X X X X X X DIS X X X DLX X DTV X X X EBAY/PYPL X X EGBN X X ESRX X X X X EV X X EXPD X F X X X X X X FDS X X X X X X X X X X FICO/FIC X X X FISV X X X X X X X X X X X X X X X X X GDW/WB X GGG X GILD X X GL/TMK X X X HCBK X HD X HEI X X X X HOG X X X HRL X X X X X X HRS X X HSY X X X X IBM X ICE X X X X X X INGR X X INTC X JNJ X X X JOSB X X X X X X JPM X X X LLY X X LNCR X LUK X X X X MCD X MCO X X X X X X MDT X X X X X X X X X MIDD X X MLR X X MOG-A X X X X X X X X MSFT X X X X X NICK X X X X X X X ORCL X X X X X OTIS X QCOM X X RAI X X X RESP X X REYN X ROST X X X X X X X X X X RPM X X X X RTN X SAIC X SBNY X X X X X SCL X X X SEIC X X X X X SHW X X X X X X SJM X X X SLGN X X X SNA X X X X SRCL X SYK X X X X X X X X X X X X X X X SYY X X X X X X X TMO X X TREX X X X UNH X X X VAR X X WAB X X X X WFC X X X X WXS/WEX X X X X ZTS X X AFLAC and Fiserv are the only two left that have been on every year. Stryker is on for the 15th year in a row.
Morning News: December 31, 2021
Eddy Elfenbein, December 31st, 2021 at 7:06 amGold Heads Toward Largest Percentage Decline Since 2015
Bank of Mexico Plans to Launch Digital Currency by 2024
China Is Running Out of Water and That’s Scary for Asia
What Default? With Confetti and Fanfare, Evergrande Says It’s Ready to Build
Libor’s Decades-Long Dominance of Rates Is Over, Axing Liquidity
The Fed’s Moves Pumped Up Stocks. In 2022, It May Pull the Plug.
All the Things Wall Street Won’t Miss About 2021
Business Leaders Struggle With Endless Upheaval
The Missing Data in the Inflation Debate
EU Records First Drop in Sparkling Wine Exports in Decade as Champagne Loses Its Fizz
High-End Champagne Shortage Could Ruin Your New Year’s Eve
Tesla Has Busy New Year’s Eve Plans in Push to Record Deliveries
Tesla Recalls Almost Half A Million Electric Cars Over Safety Issues
Are Apple AirTags Being Used to Track People and Steal Cars?
Bank Accidentally Deposits $176 Million Into People’s Accounts on Christmas Day
Be sure to follow me on Twitter.
Jobless Claims Fall to 198,000
Eddy Elfenbein, December 30th, 2021 at 9:28 amThis has been a dull week so far for the stock market. This morning’s jobless claims report came in at 198,000. That’s near the 52-year low we said three weeks ago when jobless claims were 188,000.
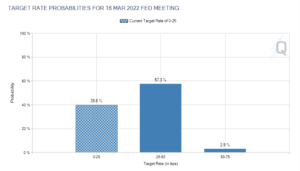
The futures market now sees a 60% chance of a Fed rate hike by its March meeting.
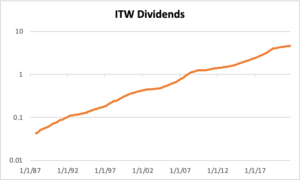
Here’s something I was looking at so I thought I’d share it with you. Illinois Tool Works (ITW) has increased its dividend for 50 straight years. The dividend has gone from 3 cents per share in 1993 to $1.22 now.
Here’s what the growth of ITW’s dividend looks like:
Morning News: December 30, 2021
Eddy Elfenbein, December 30th, 2021 at 7:03 amErdogan’s Push for Low Rates Backfires as Borrowing Costs Soar
AI-Powered Stock Fund Bails Out of Mega-Cap FANG+ Stocks
Gold Oscillates Around $1,800 as Firm Dollar Weighs
This Altcoin Smoked Bitcoin and Ether With 1,300% Gain This Year
Samsung, Micron Warn Xian Lockdown May Disrupt Memory Chip Manufacturing
U.S. Stocks End a Wild Year With Big Gains
What Social Trends Told Us About the American Economy in 2021
Strong Labor Market in 2021 Faces Down Omicron Threat
Selling Cars, Plus Coffee, Tea or a Fancy Dinner
The Metaverse’s Dark Side: Here Come Harassment and Assaults
Walmart Drew One In Four Dollars Spent on Click and Collect — With Room to Grow in 2022
Billionaire Peter Thiel Hires Austria’s Disgraced Former Chancellor
Travel Startups Say Omicron Disruptions Create Opportunities
Facebook’s Pushback: Stem the Leaks, Spin the Politics, Don’t Say Sorry
Huge Number of CEOs Fear Losing Their Gigs in 2022, Survey Finds
Be sure to follow me on Twitter.
Morning News: December 29, 2021
Eddy Elfenbein, December 29th, 2021 at 7:06 amWhat A Year of Brexit Brought U.K. Companies: Higher Costs and Endless Forms
Dollar’s Best Days Look Numbered Amid Rush to Front-Run Fed
Biden Eyes Raskin as Top Fed Banking Regulator
Shareholder Activism’s Rebound to Confront Game-Changing Rules
A Lavish Tax Dodge for the Ultrawealthy Is Easily Multiplied
U.S. Retailers May Pay the Price for ‘Extended’ Holiday Return Season
Should Retailers Split E-Commerce From Stores?
IPOs’ Record Year Ends on Low Note for Most Newcomers
Chinese Professor Lands $3.4 Billion Fortune With SenseTime IPO
Morgan Stanley to Boost Stake in China Brokerage to 94%
Google and Tech Rivals Tap Cash Reserves to Realize Cloud Ambitions
Three Planes to Fly Potatoes to Ease Japan French-Fries Shortage
How Discord, Born From an Obscure Game, Became a Social Hub for Young People
5 Ways Young People Are Using Discord
Musk Nears Tesla Share Sale Target With $1 Billion Offload
Be sure to follow me on Twitter.
CWS Market Review – December 28, 2021
Eddy Elfenbein, December 28th, 2021 at 7:49 pm(This is the free version of CWS Market Review. In our premium issue, I’ve recently unveiled our Buy List for 2022. To see the new list, make sure you’re a premium subscriber. You can get the premium newsletter for $20 per month or $200 for the whole year.)
The Honey Badger Market
This continues to be the Honey Badger Market. It just doesn’t care. The stock market seems to effortlessly brush aside every problem standing in its way.
Highest inflation in 40 years? No problem.
Supply-chain issues? Move over.
Omicron? Please.
Higher and higher the market goes. Since October 4, the stock market has gained more than 11%. This looks to be one of the strongest quarters for the stock market in years.
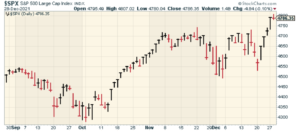
Earlier today, the S&P 500 broke through 4,800. Although we closed down by a small bit today, the index is getting close to doubling from its March 2020 low. Who would have predicted that?!
Yesterday, the S&P 500 closed at its 69th record high this year. That’s nearly a record high for record highs. Only 1995 had more.
Not only that, but the Santa Claus Rally is off to its best start in 20 years.
There are lots of definitions for what the Santa Claus Rally entails, but if we say it’s the last week of December and the first two trading days of the new year, then the rally got off to a big start this year.
On Monday, the S&P 500 gained 1.4%. That’s the biggest start to the season in two decades. Every time the Santa Claus Rally has started with a gain of 1% or more, the whole period has been a positive one for the market.
By the way, the S&P 500 first broke 480 on January 31, 1994, nearly 28 years ago. That means that despite all the sturm und drang of the last 28 years, the stock market still rose tenfold, which comes to more than 8.5% per year—and that doesn’t include dividends.
Despite being the final week of trading for this year, this is a slow week for financial news. That will change next week with the December jobs report due out on January 7. There’s a decent chance that the unemployment rate will fall below 4%.
Soon after that, the Q4 earnings season will begin. That’s Judgment Day for Wall Street. Let’s take a closer look at what we can expect.
Preview of the Q4 Earnings Season
What’s the reason for the market’s bullishness? It’s not always so easy to divine the market’s thinking from its behavior. As we know, the market likes to be a bit of a drama queen. Still, I suspect that Wall Street is starting to feel that the upcoming Q4 earnings season will be a good one. After all, Q3 was pretty good.
Also, expectations for Q4 have improved markedly. That’s counter to the usual playbook. Typically, earnings estimates start out too high and are gradually pared back as earnings season approaches. They’re lowered just enough so Wall Street can beat expectations.
Ironically, it’s expected that your company beat expectations. If you merely meet expectations, well…no one saw that coming and your stock can get clobbered. The stock market is all about exceeding expectations.
Let’s look at some numbers. In early 2020, before Covid wrecked the economy, Wall Street had been expecting very good earnings for Q4 of 2021. Of course, it’s always a little sketchy to predict something that far in advance.
For Q4 2021, Wall Street was expecting the S&P 500 to report Q4 earnings of $49 per share. That’s the index-adjusted number (every one point is about $8.5 billion). As Covid set in, the number crunchers on Wall Street lowered their forecasts.
By the start of this year, Wall Street was expecting Q4 earnings of just $44 per share.
Since then, the news has been much better. It’s the twin effects of very diminished expectations and actually good earnings. The S&P 500 earned over $52 per share for both Q2 and Q3. That compares with less than $20 per share in Q1 of 2020. That was a scary time.
According to the latest figures, Wall Street now expects the S&P 500 to earn $50.45 per share for Q4 of 2021. If that’s right, that would be a remarkable turnaround in just a few months. Now you can see what has the stock market so excited. It’s not just fluff. Corporate earnings have improved by an impressive degree.
Here’s a look at the S&P 500 (red line, left scale) and its earnings (black line, right scale. The two lines are scaled and a ratio of 20 to 1. That means whenever the lines cross, the market’s P/E ratio is exactly 20.
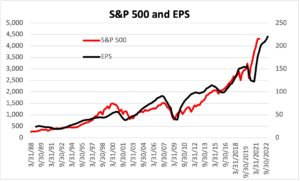
Assuming Wall Street’s Q4 estimate is correct (and it’s probably pretty close), then the S&P 500 will have earned $202 per share for this year. For 2022, Wall Street forecasts earnings of $220 per share. That means the S&P 500 is going for 21.7 times earnings. The earnings yield, which is the inverse of the P/E Ratio, is 4.6%.
While that’s certainly low, it’s not out of line when you compare it with the 10-year Treasury which is currently yielding around 1.5%. In other words, the stock market has run up a lot, but there’s been good reason for it. I wouldn’t be so quick to call this a speculative bubble. It’s probably closer to saying that the fear bubble from last year has popped.
Here’s a brief aside. Look at this headline from CNBC:

How would you interpret the news? I would assume that it means that home prices rose 18.4% for the month of October. Right? But that’s not what happened.
Instead, home prices rose 18.4% in the 12 months ending in October. Maybe I’m being pedantic, but that’s quite a big difference between headline and payoff.
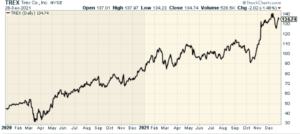
Closer Look at Trex
Jack Bogle once said that “reversion to the mean is the iron rule of financial markets.” One exception to that may be Trex (TREX). We added it to our Buy List last year and it was our top-performing stock. During 2020, shares of Trex gained more than 86%.
Instead of reverting to the mean, Trex is having another stellar year, and it looks to repeat as our top-performing stock with a YTD gain of 61%.
If you’re not familiar with Trex, the company is a major maker of wood-alternative decking and railing. In my opinion, what they make looks a lot like wood, but it’s cheaper and involves a lot less maintenance.
Trex is also better for the environment. Pressure-treated wood still dominates which means there’s plenty of room for Trex to grow. It’s also nice to know that with Trex, you don’t have to take another tree out of the Amazon rainforest to make your backyard deck.
Check out their products at their homepage (www.trex.com), and you’ll see why Trex has become so popular.

One of the reasons why I like Trex is their commitment to sustainability. Trex is made from 95% recycled material. Every year, the company effectively takes 500 tons of plastic out of landfills and uses it for alternative wood. It’s not just good for the planet, but it’s smart business.
Trex takes all those used bags and bottles and combines them with recycled sawdust from cabinet and furniture manufacturers – and that’s what Trex is made of. By the way, this also saves a lot of water.
Some other key advantages are that Trex weighs less than wood and is also more resistant to mold and insects. You don’t need expensive staining or sanding, and repairs are much less frequent.
You’ll often hear people say that Trex looks fake. I think that used to be true, but it’s much less the case today. Commercial railing is another big business for Trex. Their railings are especially common at stadiums and arenas across North America.
Trex is sold in 40 different countries and at over 6,700 retailers. The company IPO’d 20 years ago, and it’s been a big winner for shareholders. I don’t think we’re anywhere near the end of this story.
Now let’s look at some numbers. Trex will probably do about $1.2 billion in business for 2021. I think that can rise to $1.4 billion, give or take, in 2022.
For earnings, last year Trex made $1.55 per share. When the final numbers are in for 2021, Trex will have probably made about $2.10 per share. But for 2022, I think Trex can make as much as $2.60 per share. That’s an optimistic forecast, but it’s possible.
Last month, Trex reported Q3 earnings of 64 cents per share. That was six cents higher than expectations and 73% higher than a year ago. Quarterly sales rose 45% to $336 million.
I’ve been impressed by the way Trex is managing itself. On one hand, the company faces higher prices for raw materials and higher labor costs. Trex was able to expand its gross margins by 150 basis points last quarter. Some of these comparisons are distorted because last year was so unusual. The important fact is that Trex has been able to pass along higher prices without damaging sales. There will be more price increases in 2022.
Here’s an interesting stat. On the earnings call, management said that composites have been gaining market share at the rate of 1% each year. Now that’s accelerated to 2%.
Trex said it sees Q4 revenue of $295 million to $305 million. The midpoint is up 31% from last year’s Q4. The company also expects “strong double-digit revenue gains” next year. Trex plans to open a new manufacturing facility on 300 acres in Little Rock, Arkansas.
I like that Trex can maintain an operating profit margin near 25%. That’s very impressive. Also, Trex has a solid balance sheet and doesn’t carry a dime in long-term debt. The price isn’t dirt cheap but there’s a lot of potential for Trex.
That’s all for now. I want to wish everyone a happy and healthy New Year. I’ll have more for you in the next issue of CWS Market Review.
– Eddy
P.S. Don’t forget to check out our ETF.
The S&P 500 Breaks 4,800
Eddy Elfenbein, December 28th, 2021 at 10:22 amYesterday, the S&P 500 reached its 69th new high of the year. It’s still running. The index broke above 4,800 this morning. So far, AFLAC (AFL), Broadridge (BR), Cerner (CERN), Middleby (MIDD), Thermo Fisher (TMO) and Zoetis (ZTS) are at new highs. Seven of our Buy List stocks are up over 40% this year.
This morning’s Case-Shiller Index said that home prices are up 19.1% over the past year. Bill McBride points out that housing inventory is down 60% from the same time in 2019.
Despite being the end of the year, there’s not much news this week. Next week will be more interesting with the jobs report on Friday.
Morning News: December 28, 2021
Eddy Elfenbein, December 28th, 2021 at 7:05 amBitcoin’s Volatility Is on Display Again in Slide Below $50,000
China Vows Proactive Moves to Stabilize Economy in 2022
Japan’s Factory Output Soars As Car Production Returns
Omicron Variant Is Expected to Dent Global Economy in Early 2022
Gold Edges Higher as Traders Weigh Record Covid-19 Infections
Dubai Can’t Shake Off the Stain of Smuggled African Gold
Financial Literacy or Luck? The Year Small-Time Traders Made A Big Impact
Food Prices Are Reportedly Expected to Rise Again in January
Farm Aid: Chipotle CEO Brian Niccol on America’s Farming Crisis
The $900 Billion Cash Pile Inflating Startup Valuations
How the Metaverse Won Christmas
Walmart Sparks Public Outcry in China
How to Spot Those Pesky (and Expensive) Lodging Fees
Riot Games to Pay $100 Million in Gender Discrimination Case
Be sure to follow me on Twitter.
-
Archives
- July 2026
- June 2026
- May 2026
- April 2026
- March 2026
- February 2026
- January 2026
- December 2025
- November 2025
- October 2025
- September 2025
- August 2025
- July 2025
- June 2025
- May 2025
- April 2025
- March 2025
- February 2025
- January 2025
- December 2024
- November 2024
- October 2024
- September 2024
- August 2024
- July 2024
- June 2024
- May 2024
- April 2024
- March 2024
- February 2024
- January 2024
- December 2023
- November 2023
- October 2023
- September 2023
- August 2023
- July 2023
- June 2023
- May 2023
- April 2023
- March 2023
- February 2023
- January 2023
- December 2022
- November 2022
- October 2022
- September 2022
- August 2022
- July 2022
- June 2022
- May 2022
- April 2022
- March 2022
- February 2022
- January 2022
- December 2021
- November 2021
- October 2021
- September 2021
- August 2021
- July 2021
- June 2021
- May 2021
- April 2021
- March 2021
- February 2021
- January 2021
- December 2020
- November 2020
- October 2020
- September 2020
- August 2020
- July 2020
- June 2020
- May 2020
- April 2020
- March 2020
- February 2020
- January 2020
- December 2019
- November 2019
- October 2019
- September 2019
- August 2019
- July 2019
- June 2019
- May 2019
- April 2019
- March 2019
- February 2019
- January 2019
- December 2018
- November 2018
- October 2018
- September 2018
- August 2018
- July 2018
- June 2018
- May 2018
- April 2018
- March 2018
- February 2018
- January 2018
- December 2017
- November 2017
- October 2017
- September 2017
- August 2017
- July 2017
- June 2017
- May 2017
- April 2017
- March 2017
- February 2017
- January 2017
- December 2016
- November 2016
- October 2016
- September 2016
- August 2016
- July 2016
- June 2016
- May 2016
- April 2016
- March 2016
- February 2016
- January 2016
- December 2015
- November 2015
- October 2015
- September 2015
- August 2015
- July 2015
- June 2015
- May 2015
- April 2015
- March 2015
- February 2015
- January 2015
- December 2014
- November 2014
- October 2014
- September 2014
- August 2014
- July 2014
- June 2014
- May 2014
- April 2014
- March 2014
- February 2014
- January 2014
- December 2013
- November 2013
- October 2013
- September 2013
- August 2013
- July 2013
- June 2013
- May 2013
- April 2013
- March 2013
- February 2013
- January 2013
- December 2012
- November 2012
- October 2012
- September 2012
- August 2012
- July 2012
- June 2012
- May 2012
- April 2012
- March 2012
- February 2012
- January 2012
- December 2011
- November 2011
- October 2011
- September 2011
- August 2011
- July 2011
- June 2011
- May 2011
- April 2011
- March 2011
- February 2011
- January 2011
- December 2010
- November 2010
- October 2010
- September 2010
- August 2010
- July 2010
- June 2010
- May 2010
- April 2010
- March 2010
- February 2010
- January 2010
- December 2009
- November 2009
- October 2009
- September 2009
- August 2009
- July 2009
- June 2009
- May 2009
- April 2009
- March 2009
- February 2009
- January 2009
- December 2008
- November 2008
- October 2008
- September 2008
- August 2008
- July 2008
- June 2008
- May 2008
- April 2008
- March 2008
- February 2008
- January 2008
- December 2007
- November 2007
- October 2007
- September 2007
- August 2007
- July 2007
- June 2007
- May 2007
- April 2007
- March 2007
- February 2007
- January 2007
- December 2006
- November 2006
- October 2006
- September 2006
- August 2006
- July 2006
- June 2006
- May 2006
- April 2006
- March 2006
- February 2006
- January 2006
- December 2005
- November 2005
- October 2005
- September 2005
- August 2005
- July 2005
 Eddy Elfenbein is a Washington, DC-based speaker, portfolio manager and editor of the blog Crossing Wall Street. His