Archive for March, 2019
-
CWS Market Review – March 29, 2019
Eddy Elfenbein, March 29th, 2019 at 7:08 am“The conventional view serves to protect us from the painful job of thinking.”
– John Kenneth GalbraithAfter ten years, the yield curve has finally gone flat. Ironically, this was caused by good economic news. A flat curve is a natural response to a growing economy, but the flat curve has some important implications for the economy, the stock market and our portfolios.
In this week’s CWS Market Review, we’ll take a deep dive into all things yield curve. I’ll also discuss the good earnings report from FactSet. The stock gapped up to a new 52-week high. I’ll also preview next week’s earnings report from RPM International, and I have a bunch of new Buy Below prices. But first, let’s look at what the yield curve has to say.
What Does the Flat Yield Curve Mean?
Wall Street has been in a tizzy over the yield curve. As we know, Wall Street loves to stress about something. Or anything. Wall Street’s favorite mode is being “concerned.” If need be, this can be upgraded to “distressed.” Most of the time, I tell you that this week’s “concern of the year” is over-rated and not to worry about it.
This is different. An inverted yield curve truly is a big deal. The hitch is that it’s not immediate. Let me take a step back. By yield curve, I mean the difference between short-term and long-term interest rates. Normally, the yield curve is upward sloping, meaning you get paid more the longer you lend your money. That makes sense, but every so often, the yield curve goes flat, or even gets inverted. That’s when short-term rates rise above long-term rates.
An inverted yield curve is one of the few good predictors of a bad economy. For a field with lots of stats, we still have little idea of how well the economy is doing at the moment. Economists have a terrible track record of predicting recessions, but the yield curve could have won a few Nobel Prizes based on its track record. The spread between the 2- and 10-year Treasuries has been an omen of bad times consistently for the last 35 years.
Check out this tidbit from MarketWatch:
Researchers at the San Francisco Fed say the 3-month/10-year curve is the most reliable indicator, while Cleveland Fed researchers note that inversions of that measure have preceded the past seven recessions with only two false positives — an inversion in late 1966 and a very flat curve in late 1998.
That’s way better than most economists.
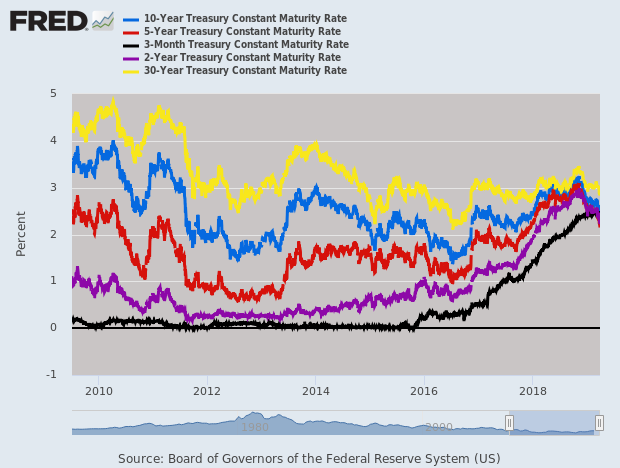
To show you how much things have changed, in 2011, the 2/10 Spread reached 291 basis points. It’s now down to 16. The spread between the 10-year and three-month yield is currently negative by four basis points.
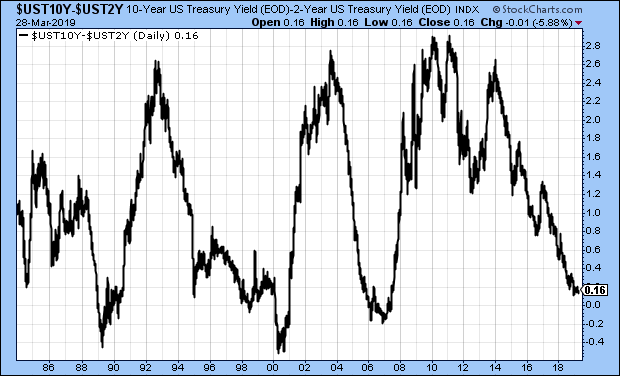
While the yield curve is important, I’ll caution you that it’s not an instant tripwire. Let’s look at some recent history. The 2/10 Spread inverted in May 1998. It then went back before becoming very inverted in 2000, but the recession didn’t officially begin until 2001. Even in the last recession, the 2/10 Spread inverted in late 2005. The recession didn’t start for two more years.
It’s a mistake to dismiss the yield curve as a technical indicator like the 200-day moving average. The yield curve has real world ramifications. A few years ago, I ran the numbers and found that the stock market does much better when the spread between the 90-day and 10-year Treasury yield is 121 basis points or more. If you’re a bank, an inverted curve means it’s not profitable to borrow short and lend long. (And yet, starting a bank in 2010 was probably one of the most profitable things you could do.)
In the 12 months following a negative 2/10 Spread, the economy has been in recession about 50% of the time. There is, however, the chance that the yield curve may have lost its predictive powers with the advent of the Fed’s new policies. These things can change. When we had a gold standard, inverted curves were the norm.
I don’t have any plans to alter our investing strategy. Our stocks are stronger than what a yield curve can do. With a flat curve, I would expect to see better valuations among defensive stocks. As I’ll explain later, stocks like Hershey (HSY) and Church & Dwight (CHD) have recently hit new highs. Think of it this way: an inverted yield curve is like rougher seas. If your ship is sturdy, then it doesn’t matter.
FactSet Is a Buy up to $258 per Share
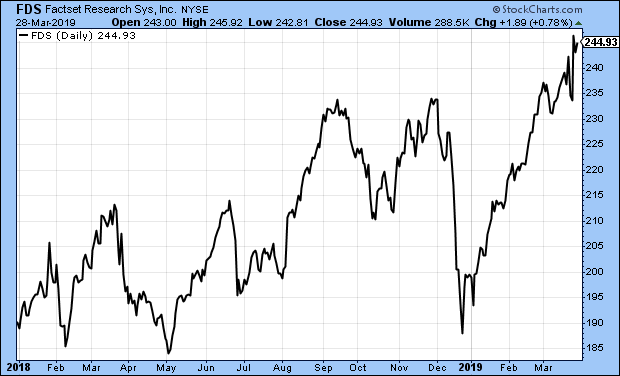
On Tuesday, FactSet (FDS) reported earnings for its fiscal second quarter and the results were pretty good. This is for the quarter that covered December, January and February.
For Q2, FactSet earned $2.42 per share compared with $2.12 per share last year. Wall Street had been expecting $2.33 per share. Quarterly revenue rose 5.9% to $354.9 million, and organic revenue rose 5.7%. Annual Subscription Value, or ASV, rose to $1.44 billion. I was pleased to see that FactSet increased its adjusted operating margin to 33.2% from 31.4% a year ago.
“As we close the first half of the year, we are pleased to have built upon our long track record of continuous and steady growth. Our team capitalized on growing demand for our core solutions with focused execution as we continued to serve as a trusted partner to our clients,” said Phil Snow, FactSet CEO. “Looking ahead to the second half of the year, we will continue to execute against our proven strategy of providing smarter, connected data and technology solutions that make for an open and flexible user experience.”
As of the end of the quarter, FactSet has a client count of 5,405. That’s an increase of 108. The user count increased by 6,854 to 122,063. Annual client retention was greater than 95% of ASV.
FactSet also updated its financial guidance. The company expects revenue to range between $1.41 billion and $1.45 billion. They see adjusted operating margin between 31.5% and 33.5%. Lastly, they see full-year earnings between $9.50 and $9.65 per share. That’s an increase of five cents to the low end. This was a solid report for FDS.
After the report, shares of FDS opened higher, then lost it all, then rallied back very impressively. This week, FDS hit a new 52-week high. I’m lifting my Buy Below on FactSet to $258 per share.
Preview of RPM International’s Earnings
We have one earnings report next week. RPM International (RPM) is due to report its fiscal Q3 earnings on Thursday morning, April 4. This will be our final off-cycle report until Q1 earnings season begins in mid-April.
I’ll be honest – RPM has been a disappointment this year. The last earnings report was pretty ugly. For its fiscal Q2, RPM reported earnings of 52 cents per share. Sales rose 3.6% to $1.36 billion. Wall Street had been expecting 68 cents per share.
The CEO had some excuses: “Like many manufacturers, our bottom line was impacted by a continued rise in costs for raw materials, freight, labor and energy, as well as adverse foreign-exchange translation.” We already knew the company was facing these issues, but I didn’t realize the problem was so acute. For Q3, RPM expects earnings between 10 and 12 cents per share.
I’m not done yet with RPM. There’s still a lot of time to turn things around, but I want to see some evidence soon. All companies hit rough patches, but not all manage through them the same.
Buy List Updates
Continental Building Products (CBPX) rallied after its last earnings report. Since then, it’s given back the entire gain, and then some. I still like Continental and this is a good price. This week, I’m dropping my Buy Below down to $26 per share.
Eagle Bancorp (EGBN) is another good stock that’s been weak lately. In five trading days, EGBN fell 13%. I’m not worried about Eagle. The stock is going for about ten times this year’s earnings. I’m lowering my Buy Below to $55 per share.
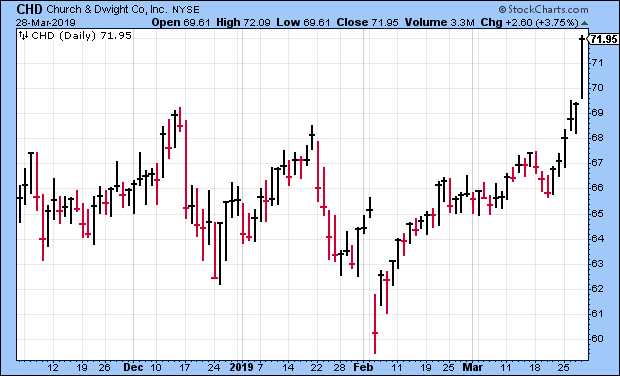
Remember when Church & Dwight (CHD) fell sharply after missing earnings by one penny? The stock lost more than 7% in one day. As it turns out, a stock that’s raised its dividend for 23 years in a row is worth sticking with. Since then, CHD made back everything it lost and just hit a 52-week high on Thursday. I’m raising my Buy Below on CHD to $75 per share.
There are a few other Buy Below changes I want to make. Fiserv (FISV) continues to look very good. I’m expecting another good earnings report. This week, I’m lifting our Buy Below on Fiserv to $92 per share. Hershey (HSY) is another stock that just hit a 52-week high. I’m raising our Buy Below on Hershey to $120 per share. JM Smucker (SJM) is doing very well this year. The jam stock is up 24% for us so far in 2019. I’m increasing the Buy Below on SJM to $122.
That’s all for now. The first quarter ends with the close of trading today. This looks to be one of the best quarters for the stock market in years. The second quarter starts up next week. On Monday, we’ll get the ISM and retail sales reports. Tuesday is durable goods. Then on Wednesday, we’ll see the ADP payroll report. That leads up to the March jobs report on Friday. The last report was quite low. I’ll be curious to see if it gets revised higher. Be sure to keep checking the blog for daily updates. I’ll have more market analysis for you in the next issue of CWS Market Review!
– Eddy
-
Morning News: March 29, 2019
Eddy Elfenbein, March 29th, 2019 at 7:02 amLira Wobbles as U.S. Ties With Turkey Fray
China, U.S. Pore Over Details of Agreement Text to End Trade War
A Tax On A Tax: U.S. Customs Demands Bigger Bonds as Trade Tariffs Rise
The ETF Tax Dodge Is Wall Street’s “Dirty Little Secret”
Un-Spinning the Trump, Obama GDP Numbers
Lyft’s Trading Debut to Be Watched by IPO-Hungry Tech Companies
Who’ll Get Rich When Lyft, Uber and Other ‘Unicorns’ Go Public
Goldman’s China-Backed Fund Bucks Trade Tensions to Buy U.S. Firm
Huawei Shrugs Off U.S. Clampdown With a $100 Billion Year
Wells Fargo C.E.O. Timothy Sloan Abruptly Steps Down
JPMorgan’s Role in Nigerian Oil Deal Has Come Back to Haunt It
Joshua Brown: An Economist Walks Into a Brothel & Non-Partisan
Cullen Roche: Three Things I Think I Think – Yield Curves and Stuff
Ben Carlson: Personal Finance For Normal People
Michael Batnick: The Perfect Track Record & Eye Roll
Be sure to follow me on Twitter.
-
Morning News: March 28, 2019
Eddy Elfenbein, March 28th, 2019 at 7:09 amYield Curve Inversion Suggests New All-Time Highs For Stocks
Bond Yields on the Canvas, Turkey’s Lira on the Ropes
China Makes Unprecedented Proposals on Tech, Trade Talks Progress
No Earrings, Tattoos or Cleavage: Inside China’s War on Fun
Swedbank Fires CEO Over Money Laundering Allegations
Huawei Slammed by U.K. for Jeopardizing National Security
Boeing Faces Capitol’s Glare as It Presses to Fix the 737 Max
Lyft, the Perpetual No. 2, Gets Its Moment in the Spotlight
WWE’s Next Battle Royale: Investor Fans vs. Shorts
Pimco and BlackRock Have a Contrarian Bet on Inflation
Wow Air Just Went Bust in Yet Another Blow to the Budget Airline Industry
Why Are Economists So Bad at Forecasting Recessions?
Lawrence Hamtil: The Dow as a Multi-Factor Index
Jeff Miller: Are Interest Rates Impacting Your Trades?
Jeff Carter: What Do You Look For To Invest At Seed? & Work For A Startup, Or Not?
Be sure to follow me on Twitter.
-
Morning News: March 27, 2019
Eddy Elfenbein, March 27th, 2019 at 7:08 amEurope Adopts Tough New Online Copyright Rules Over Tech Industry Protests
He’s No ‘Sycophant’ for Trump, Expected Fed Nominee Says
Tax Changes Hit Overseas Profits of Some U.S. Companies
Centene to Buy WellCare in $17.3 Billion Health-Care Deal
Southwest Cuts Forecast After 737s Grounded; Shares Drop
How Boeing and the FAA Plan to Restore Public’s Faith in 737 Max
Hollywood Had Questions. Apple Didn’t Answer Them.
Inside Google’s Rebooted Robotics Program
U.S. Pushes Chinese Owner of Grindr to Divest the Dating App
Great Wall, Ford Hitch Up to Burgeoning Chinese Demand for Pickup Trucks
Tesla’s New Chairman Says Elon Musk Uses Twitter ‘Wisely’
Great Wall, Ford Hitch Up to Burgeoning Chinese Demand for Pickup Trucks
Bed Bath & Beyond Soars on Activist Plans
Nick Maggiulli: Nothing Is Safe
Roger Nusbaum: A Solution For Sequence Of Return Risk?
Michael Batnick: Multiples Are Not Valuation & Footing the Bill
Be sure to follow me on Twitter.
-
FactSet Earned $2.42 per Share for Q2
Eddy Elfenbein, March 26th, 2019 at 10:14 amThis morning, FactSet (FDS) reported earnings for its fiscal second quarter, and the results were pretty good. This is for the quarter that covered December, January and February.
For Q2, FactSet earned $2.42 per share compared with $2.12 per share last year. Wall Street had been expecting $2.33 per share. Quarterly revenue rose 5.9% to $354.9 million, and organic revenue rose 5.7%. Annual Subscription Value, or ASV, rose to $1.44 billion. I was pleased to see that FactSet increased its adjusted operating margin to 33.2% from 31.4% a year ago.
“As we close the first half of the year, we are pleased to have built upon our long track record of continuous and steady growth. Our team capitalized on growing demand for our core solutions with focused execution as we continued to serve as a trusted partner to our clients,” said Phil Snow, FactSet CEO. “Looking ahead to the second half of the year, we will continue to execute against our proven strategy of providing smarter, connected data and technology solutions that make for an open and flexible user experience.”
As of the end of the quarter, FactSet has a client count of 5,405. That’s an increase of 108. The user count increased by 6,854 to 122,063. Annual client retention was greater than 95% of ASV.
FactSet also updated its financial guidance. The company expects revenues to range between $1.41 billion and $1.45 billion. They see adjusted operating margin between 31.5% and 33.5%. Lastly, they see full-year earnings between $9.50 and $9.65 per share. That’s an increase of five cents to the low end. This was a solid report for FDS.
The stock opened up 2% higher but has since given back some of those gains.
Update: Well, I didn’t see that coming. FDS opened higher, lost it all, then rallied back. FDS closed up $12.21 to $245.78, a gain of 5.23%. That’s a new 52-week high.
-
Morning News: March 26, 2019
Eddy Elfenbein, March 26th, 2019 at 7:13 amChina Pledges Openness in Hopes of Reaching a Trade Deal
China’s Huawei Sees Little Impact on Sales From U.S. Broadside
Goldman Joins Chorus Warning Against Yield Curve Panic
Fed Researcher Warns Climate Change Could Spur Financial Crisis
Uber Buys Careem for $3.1 Billion to Conquer Middle East Market
Apple Spotlights Services with TV, Gaming and Credit Card Offerings
Samsung Predicts Disappointing Results as Chip Prices Fall
McDonald’s $300 Million Tech Deal Will Revolutionize Menus
Germany’s Second-Richest Family Discovers a Dark Nazi Past
WeWork’s Losses Swell to Nearly $2 Billion as It Seeks Global Expansion
Why Is Silicon Valley So Obsessed With the Virtue of Suffering?
Michael Batnick: How Concentration Affects Portfolio Performance
Joshua Brown: A Missing Caveat to Last Week’s Sell-Off & The False Breakout
Ben Carlson: Talk Your Book: Creating a Buffer, How Often Is It a Stock-Picker’s Market? & Why Are IPOs Oversubscribed?
Be sure to follow me on Twitter.
-
What Does the Yield Curve Inversion Mean?
Eddy Elfenbein, March 25th, 2019 at 12:22 pmAfter more than a decade, the yield curve has finally become flat. By yield curve, I mean the difference between short-term and long-term interest rates.
Normally, the yield curve is upward sloping, meaning you get paid more the longer you lend your money. That makes sense. But every so often, the yield curve goes flat, or even gets inverted. That’s when short-term rates rise above long-term rates.
An inverted yield curve is one of the few good predictors of a bad economy. For a field with lots of stats, we still have little idea of how well the economy is doing at the moment. Economists have a terrible track record of predicting recessions, but the yield curve could have won a few Nobel Prizes based on its track record. The spread between the 2- and 10-year Treasuries has been an omen of bad times consistently for the last 35 years. Notice how often a negative spread precedes a gray recession bar.

That spread is still slightly positive but on Friday’s close, the yield on the three-month Treasury was 2.46%. That’s two basis points more than the 10-year yield. For context, in 2010, the two-year was more than 380 basis points less than the 10-year yield.
The yield curve is important but I’ll caution investors that it’s not an instant tripwire. For example, the 2-10 spread inverted in May 1998. It then went back before becoming very inverted in 2000. The recession didn’t officially begin until 2001. Even in the last recession, the 2-10 spread inverted in late 2005. The recession didn’t start for two more years.
Still, it’s important. It’s a mistake to dismiss the yield curve as a technical indicator like the 200-day moving average. The yield has real world ramifications. A few years ago, I ran the numbers and found that the stock market does much better when the spread between the 90-day and 10-year Treasury yield is 121 basis points or more.
If you’re a bank, an inverted curve means it’s not profitable to borrow short and lend long. (However, starting a bank in 2010 was probably one of the most profitable things you could do.)
Think of it this way: the yield curve is a yellow light, not a red one. We’re still going to proceed, but with caution.
-
Morning News: March 25, 2019
Eddy Elfenbein, March 25th, 2019 at 7:11 amOne by One, Global Bond Markets Are Flashing the Same Warning
Here’s How the Shake-Out Is Reverberating Around Global Markets
China Pledges Openness in Hopes of Reaching a Trade Deal
Flattened Yield Curve Reason to Be Nervous, But U.S. Economy Solid: Fed’s Evans
Pinterest Is Rare ‘Unicorn’ Preparing an I.P.O. Without Hemorrhaging Cash
Apple’s Reinvention as a Services Company Starts for Real Monday
Boeing Was ‘Go, Go, Go’ to Beat Airbus With the 737 Max
Boeing Plans to Meet Regulators, Pilots to Explain 737 Max Fixes
Qatar Airways Backs Boeing Despite MAX Crash Crisis
Nike Fined $14 Million for Blocking Cross-Border Sales of Soccer Merchandise
Uber to Seal $3.1 Billion Deal to Buy Careem This Week
Cullen Roche: An Open Letter to the US Senate – Vote No on Stephen Moore
Jeff Miller: An Avalanche of Housing Data
Roger Nusbaum: The 4% Rule Is Dead! No It’s Not! & Curve Inversion & You
Jeff Carter: The Lessons of Theranos & Decision Dilemmas
Be sure to follow me on Twitter.
-
The History of Wall Street
Eddy Elfenbein, March 24th, 2019 at 12:07 am -
CWS Market Review – March 22, 2019
Eddy Elfenbein, March 22nd, 2019 at 7:08 am“Capital isn’t scarce; vision is.” – Sam Walton
The Federal Reserve made news this week by finally recognizing reality. That’s an odd headline for a news story. The facts didn’t change in any meaningful way, nor did the economy. Rather, the only change was that a committee of economists agreed to admit what had been perfectly obvious to everyone: the economy doesn’t need higher interest rates, and probably won’t for some time.
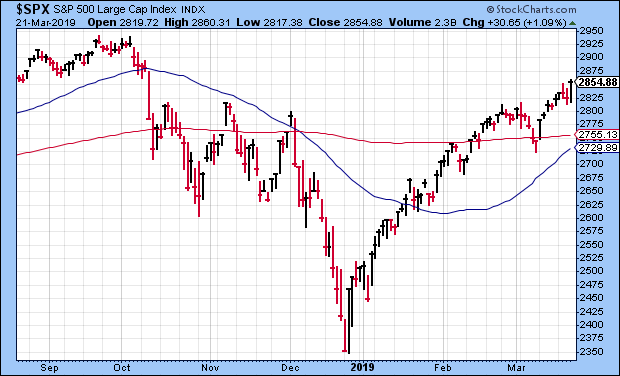
In 2019, that’s enough to rally on. On Thursday, the S&P 500 soared more than 1% to close at 2,854.88. That’s its highest close since October 9. Based on daily closes, the index has now made back 87% of what it lost during last year’s bout of unpleasantness.
In this week’s issue of CWS Market Review, I’ll go over what the Fed said and what it means for us. I also want to discuss Disney in some depth. The stock has gone nowhere recently, but I still like it. I’ll tell you why. Later on, I’ll preview the earnings report from FactSet. We also got a nice dividend boost from Raytheon. This is the 15th year in a row that Raytheon has sweetened its payout. But first, let’s look at this week’s Fed meeting and why we were right all along.
The Federal Reserve Catches up with Reality
Over the last few months, I’ve felt like a broken record. I’ve consistently said that the Federal Reserve has been vastly overestimating the need for more interest-rate increases. That’s why I’ve been so optimistic for our Buy List stocks.
This week, I’m happy to report that the Fed now agrees with us. In this week’s policy statement, the Fed said it’s not raising interest rates now. The central bank also kept the language that it “will be patient” in regard to further rate hikes. I think it’s clear that Chairman Powell has seen the need to alter course for a few months. The last rate hike was clearly not needed.
The important part of this week’s Fed news was the economic forecasts. The FOMC has 17 members. Though not all of them vote, all 17 members do get a chance to list their economic forecasts for the next few years. I’ll be honest – the Fed has a pretty bad record with its forecasts, but so does everyone else.
The FOMC members see the economy growing by 2.1% this year. That’s down from 2.3% when the last projections came out in December. They also lowered their inflation forecast (technically, the PCE index) by 0.1%. That’s not so important, but the big change came with interest rates. Of the 17 members, 11 see no need to change interest rates this year. Four members see the need for one hike, while two think two more are needed. In other words, the median vote wants to stand pat for the entire year. Hooray!
As for 2020, the FOMC sees the need for just one rate hike and no more changes in 2021. This is a remarkable turnaround. It wasn’t that long ago that the Fed thought it had to continue hiking rates this year and next. Why is this so important? The biggest factor impacting the direction of the market is real short-term interest rates. As long as those are low, then the math favors stocks. It’s not a guarantee of a bull, but it makes the bull feel a lot more comfortable.
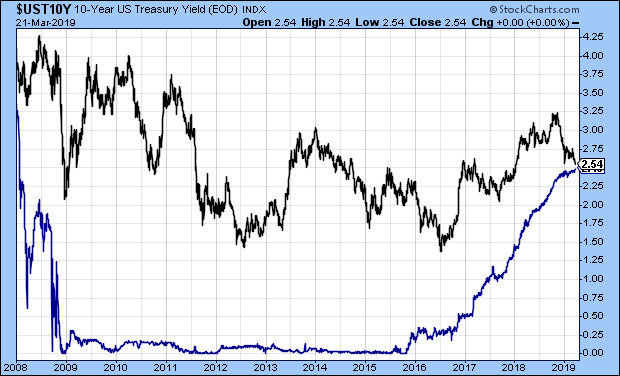
The futures market actually thinks there’s a 40% chance that the Fed will cut rates before the year is out. Hmmm. Call me a doubter. On Thursday, the yield on the three-month Treasury closed at a 10-year high. At the same time, the yield on the 10-year Treasury closed at a 14-month low. Since November, the yield on the 10-year has dropped by 70 basis points. That’s good news for mortgages and for housing in general. The chart above shows the 10-year yield (black) along with the three-month yield (blue). They’re nearly even. On Thursday, the two closed just five basis points apart.
This continues to be a favorable environment for investors. We’ll know a lot more once Q1 earnings season starts next month. Now let’s look at one of our stocks that seems to be stuck in a rut.
What’s Wrong with Disney?
I added Disney (DIS) to the Buy List at the start of this year and I’m not sorry I did. The stock, however, is down 1% for us. In fact, the stock is exactly where it was four years ago. I’m not concerned one bit.
Let’s back up a moment. The Mouse House had a great earnings report for Q4. The company made $1.84 per share which creamed estimates by 29 cents per share. Revenue fell to $15.30 billion, but that still beat expectations of $15.14 billion.
The big story here is that Disney is making a major push into streaming. Of course, Disney is into a lot of things. The parks are doing well. The movie business is down from last year, but that’s only because of some tough comparisons with some blockbusters in 2017.
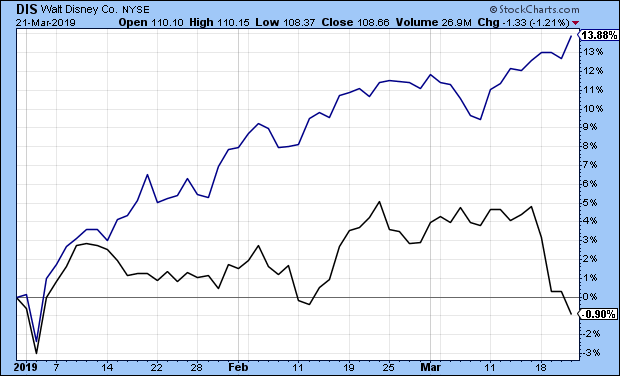
Here’s Disney YTD (in black) with the S&P 500 (in blue).
That brings us to this week and the big news that the mega-deal between Disney and Twenty-First Century Fox is now official. The deal is worth $71 billion. This is huge, and it will impact the entire entertainment industry. As I said, Disney is getting ready for the Streaming Wars.
Now that Disney owns Fox, they also own a boatload of movies and classic-movie franchises. (Just to be clear, Disney does not own Fox TV.) Disney also owns a 60% stake in Hulu. The deal also brings the X-Men and Fantastic Four characters back to Marvel, which is owned by Disney.
The backstory here is that Disney sees Netflix’s success and it’s not going to roll over. Disney is ready to take on Netflix, or anybody. There are still a lot of questions about the merger. There will be layoffs, but we don’t know yet how many.
It’s as if Disney and Netflix were two competing visions of the future. Disney is the old-line media company with tons of content. Netflix is a tech company that offers tons of choices.
I suspect the stock has been flat because there are simply a lot of concerns that Bob Iger can pull this off. There are worries that Disney will have to keep spending to stay competitive. As a result, some on Wall Street think Iger will have to lower earnings guidance for this year. That could be. The Investor Day webcast is coming up on April 11. The company plans to unveil its Disney+ streaming service.
I think it’s noteworthy that Netflix’s CEO thinks there’s plenty of room for competitors. Americans spend one billion hours a day watching video content. I think Disney is in great shape. The assets they now control are staggering, and the stock is going for a decent valuation. Disney is a buy up to $118 per share.
FactSet Earnings Preview
On Tuesday, March 26, FactSet (FDS) is due to report its fiscal Q2 earnings. This is for the quarter covering December, January and February. The stock has been a nice 21% winner this year for us.
In December, the fiscal-Q1 earnings report was quite a good one. Factset reported a 15% jump in earnings. That beat the Street by six cents per share. Also, organic revenue rose by 6.4%.
With FactSet, the key stat to watch is Annual Subscription Value, or ASV. At the end of Q1, ASV had increased to $1.42 billion. I was pleased to see that FactSet’s operating margin rose to 28.6%. FactSet’s client count stands at nearly 5,300, while user count is now over 115,000. Their annual retention rate is over 95%. People love their service.
In December, FactSet reiterated its 2019 guidance. FDS sees earnings ranging between $9.45 and $9.65 per share. That’s up from $8.53 per share last year. FactSet also sees organic ASV rising by $75 million to $90 million in 2019, and they see operating margins between 31.5% and 32.5%. That’s quite good.
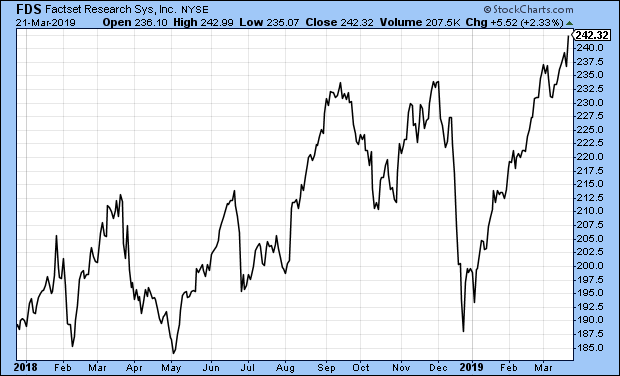
The stock got dinged after the last earnings report. In December, I wrote, “I don’t see anything wrong with the earnings report. FactSet continues to be an excellent company. Now it has a cheaper share price. If you can buy FDS near $200 per share, then you got a good deal.” FDS closed Thursday at $242.32 per share.
FDS closed higher in 11 of the last 12 weeks. I’ll caution you that the shares are well above my Buy Below price. I’ll probably adjust that next week, but I want to see the earnings report first. Wall Street expects Q2 earnings of $2.33 per share.
Raytheon Hikes Its Dividend by 8.6%
On Wednesday of this week, Raytheon (RTN) announced an 8.6% increase to its dividend. This is the fifteenth year in a row that Raytheon has hiked its dividend. The quarterly payout will rise from 86.75 cents to 94.25 cents per share. That’s an increase of 8.6%.
“With today’s announcement, we have increased our annual dividend for 15 consecutive years,” said Thomas A. Kennedy, Raytheon Chairman and CEO. “The dividend increase is a key part of our capital deployment strategy, and reflects our confidence in the company’s growth outlook and our continued focus on creating value for shareholders.”
The new dividend will be paid on May 9 to shareholders of record as of the close of business on April 10. Raytheon is one of our new stocks for 2019, and it’s already up 18.6% for us this year. RTN is still 20% below its 52-week high. Based on Thursday’s closing price, Raytheon yields just over 2%. Raytheon is a buy up to $190 per share.
That’s all for now. Next week is the final week of March, and by extension, the final week of the first quarter. This looks to be one of the best quarters for the market in years. (True, last year’s Q4 was pretty ugly.) On Tuesday, we’ll get reports on housing starts and consumer confidence. On Thursday, the Q4 GDP report will be updated. The initial report showed growth of just 2.6% for the final three months of 2018. Be sure to keep checking the blog for daily updates. I’ll have more market analysis for you in the next issue of CWS Market Review!
– Eddy
P.S. Happy birthday to the AdvisorShares Focused Equity (CWS). Our ETF just turned 2.5 years old. We’re celebrating with an after-market call this Wednesday, March 27 at 4 pm ET. Howard Lindzon will be our special guest. Please join us. You can register here.
-
Archives
- July 2026
- June 2026
- May 2026
- April 2026
- March 2026
- February 2026
- January 2026
- December 2025
- November 2025
- October 2025
- September 2025
- August 2025
- July 2025
- June 2025
- May 2025
- April 2025
- March 2025
- February 2025
- January 2025
- December 2024
- November 2024
- October 2024
- September 2024
- August 2024
- July 2024
- June 2024
- May 2024
- April 2024
- March 2024
- February 2024
- January 2024
- December 2023
- November 2023
- October 2023
- September 2023
- August 2023
- July 2023
- June 2023
- May 2023
- April 2023
- March 2023
- February 2023
- January 2023
- December 2022
- November 2022
- October 2022
- September 2022
- August 2022
- July 2022
- June 2022
- May 2022
- April 2022
- March 2022
- February 2022
- January 2022
- December 2021
- November 2021
- October 2021
- September 2021
- August 2021
- July 2021
- June 2021
- May 2021
- April 2021
- March 2021
- February 2021
- January 2021
- December 2020
- November 2020
- October 2020
- September 2020
- August 2020
- July 2020
- June 2020
- May 2020
- April 2020
- March 2020
- February 2020
- January 2020
- December 2019
- November 2019
- October 2019
- September 2019
- August 2019
- July 2019
- June 2019
- May 2019
- April 2019
- March 2019
- February 2019
- January 2019
- December 2018
- November 2018
- October 2018
- September 2018
- August 2018
- July 2018
- June 2018
- May 2018
- April 2018
- March 2018
- February 2018
- January 2018
- December 2017
- November 2017
- October 2017
- September 2017
- August 2017
- July 2017
- June 2017
- May 2017
- April 2017
- March 2017
- February 2017
- January 2017
- December 2016
- November 2016
- October 2016
- September 2016
- August 2016
- July 2016
- June 2016
- May 2016
- April 2016
- March 2016
- February 2016
- January 2016
- December 2015
- November 2015
- October 2015
- September 2015
- August 2015
- July 2015
- June 2015
- May 2015
- April 2015
- March 2015
- February 2015
- January 2015
- December 2014
- November 2014
- October 2014
- September 2014
- August 2014
- July 2014
- June 2014
- May 2014
- April 2014
- March 2014
- February 2014
- January 2014
- December 2013
- November 2013
- October 2013
- September 2013
- August 2013
- July 2013
- June 2013
- May 2013
- April 2013
- March 2013
- February 2013
- January 2013
- December 2012
- November 2012
- October 2012
- September 2012
- August 2012
- July 2012
- June 2012
- May 2012
- April 2012
- March 2012
- February 2012
- January 2012
- December 2011
- November 2011
- October 2011
- September 2011
- August 2011
- July 2011
- June 2011
- May 2011
- April 2011
- March 2011
- February 2011
- January 2011
- December 2010
- November 2010
- October 2010
- September 2010
- August 2010
- July 2010
- June 2010
- May 2010
- April 2010
- March 2010
- February 2010
- January 2010
- December 2009
- November 2009
- October 2009
- September 2009
- August 2009
- July 2009
- June 2009
- May 2009
- April 2009
- March 2009
- February 2009
- January 2009
- December 2008
- November 2008
- October 2008
- September 2008
- August 2008
- July 2008
- June 2008
- May 2008
- April 2008
- March 2008
- February 2008
- January 2008
- December 2007
- November 2007
- October 2007
- September 2007
- August 2007
- July 2007
- June 2007
- May 2007
- April 2007
- March 2007
- February 2007
- January 2007
- December 2006
- November 2006
- October 2006
- September 2006
- August 2006
- July 2006
- June 2006
- May 2006
- April 2006
- March 2006
- February 2006
- January 2006
- December 2005
- November 2005
- October 2005
- September 2005
- August 2005
- July 2005
 Eddy Elfenbein is a Washington, DC-based speaker, portfolio manager and editor of the blog Crossing Wall Street. His