CWS Market Review – March 6, 2015
“Wherefore let him that thinketh he standeth take heed lest he fall.”
– Corinthians 10:12
Next week marks the sixth anniversary of the start of the one of the greatest bull markets in history. I’ve called this rally the most-hated bull market in history since its length and height have consistently defied the predictions of so many. Every new high seems to disappoint the forecasters of doom and gloom. It’s odd how good news upsets some people.
Nearly six years ago, on March 9, 2009, the S&P 500 closed at 676.53. The day before, the index had reached a beastly low of 666.79. Consider how painful that was. The market was still less than half of what it had been nine years before. Adjusted for inflation, the Dow was where it was in 1966. Think of that! Forty-three years of no real gains.
Here we are six years later, and the S&P 500 is up 210%. Including dividends, the index is up 252%. (See, dividends really do add up.) The S&P 500 reached another new high this week.
March has been popular for market peaks and valleys. On March 9, 2000, the Nasdaq Composite closed above 5,000 for the first time in history. It wouldn’t last. Before the end of 2002, the index would lose three-fourths of its value. But on Monday of this week, the Nasdaq finally (finally!) broke above 5,000.
Three years later, March 2003, marked another turning point. This time it marked the end of a nasty slump. On March 11, 2003, the S&P 500 reached a closing low of 800.73. The next day, the index would get as low as 788.90. But it was good news after that. The next high, reached in October 2007, was almost an exact double of the March 2003 low.
The Strong Dollar Trade Continues
So what’s in store for this March? I won’t venture a guess, but this time of year has traditionally been pretty good for the market. Gary Alexander of Navellier Market Mail notes that the market has risen over March and April for the last ten years in a row. The big date to circle this year is March 9. That’s when Mario Draghi said that the European Central Bank will start buying bonds. Lots and lots of bonds. The plan is to buy 60 billion in euros every month until Europe. As you might expect, this helped the strong dollar get even stronger. The euro fell below $1.10 for the first time since September 2003. It’s been a huge effort for Draghi to get Europe to go along with his plan. Interestingly, the ECB just raised their forecast for growth in Europe.
This is why the Strong Dollar Trade continues to dominate investing. Check out this chart of the dollar index.

Since July, the dollar has soared against world currencies, and this has dramatically altered the investing landscape. Commodity prices have plunged. Last Friday’s CPI report showed consumer prices fell 0.7% in January. Except for three months during the Financial Crisis, January had the biggest drop in consumer prices since 1949.
I’ve talked a lot about the Strong Dollar Trade in recent issues, but now we’re seeing it impact corporate earnings. The corporate sector is currently experiencing an earnings slump. Profits aren’t falling; they’re mostly staying flat, and a big part of the reason is the Strong Dollar.
I think the following chart highlights what I’m talking about. This chart shows the S&P 500 with the black line, and it follows the left scale. The gold line is the earnings for the index, and it follows the right scale. I’ve scaled the two lines at a ratio of 16 to 1, so whenever the lines cross, the market’s P/E Ratio is exactly 16. I don’t mean to imply that’s the fair value for the index. It’s simply a guidepost for the chart.
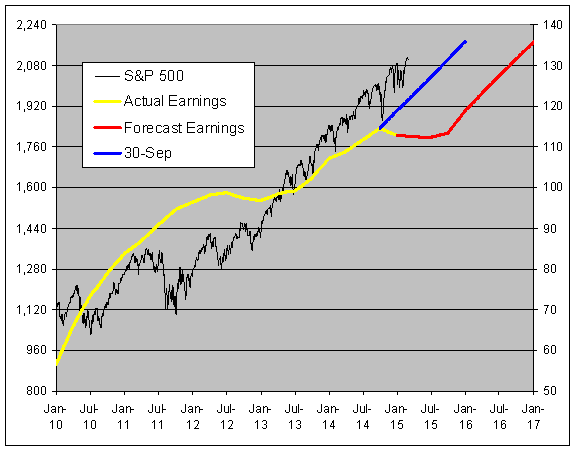
The red line is the future part of the earnings line. It’s based on analysts’ estimates. The blue line is where analysts’ estimates were at the end of the third quarter. So in the last five months, Wall Street’s outlook has slowly moved from the blue line to the red line. Most of that is due to the surging greenback. A perfect example from our Buy List would be the earnings report from Moog (MOG-A). The CEO said business is going well, but they lowered guidance due to the rising dollar. The 2015 earnings expectations for ExxonMobil (XOM) have dropped by half over the past several weeks.
An earnings slump isn’t unprecedented. From the chart, you can see that corporate profits flatlined during the last half of 2013 and the first half of 2013. At the time, the market was very nervous about the earnings slowdown. The P/E Ratio dropped well below 16 (black below gold). Only as more evidence came out that earnings growth was returning did the market move back up. But this time is different. The market’s P/E Ratio is much higher (black above gold). I think that implies that investors are betting that the impact of the strong dollar won’t last.
As investors, it’s important to identify problems that are the company’s fault and those that are part of the environment. If it’s the company’s fault, then that’s a big problem. But if it’s due to the environment, then I’m much more forgiving. After all, environments change.
The recent economic news has been somewhat mixed. On Friday, the government revised Q4 GDP downward from 2.6% in the initial report to 2.2%. On Monday, the ISM report for February came in at 53.5. That’s not a bad number, but it’s the fourth decline in a row.
After the ECB, the next important central-bank meeting will be when the Federal Reserve gets together on March 17-18. It’s now expected that the Fed will ditch the word “patient” to describe its approach to raising rates. Following this meeting, the Fed will update its economic projections. The Fed’s forecasts have been very poor, and they currently expect to raise interest rates far earlier than necessary. I think we may see some adjustments in the revised projections. Until then, I don’t believe investors have any reason to fear the earnings slowdown.
How to Invest $50,000 Right Now
I’m often asked if a person needs to buy every stock on our Buy List, and thankfully, the answer is no. Owning every stock on the Buy List is a laudable goal, but an investor can have a healthy and well-diversified portfolio by owning as few as eight stocks. Once you own more than eight to ten stocks, the benefits of diversification start to decline, though they’re still visible.
A few years ago, I ran some numbers and found that an eight-stock portfolio had a daily correlation of 95% with the S&P 500. That means that the remaining 492 provided the remaining 5%.
I wanted to give you an example of how someone could build a diversified eight-stock portfolio from our Buy List. Please let me stress that this is just an example, not some kind of model portfolio. I want you to get the principles of portfolio construction.
Here’s a sample eight-stock portfolio.
| Company | Ticker | Price | Dividend | Shares | Balance | Income | Yield |
| AFLAC | AFL | $62.80 | $1.56 | 100 | $6,280.00 | $156.00 | 2.48% |
| Ford Motor | F | $16.11 | $0.60 | 400 | $6,444.00 | $240.00 | 3.72% |
| Hormel Foods | HRL | $57.94 | $1.00 | 100 | $5,794.00 | $100.00 | 1.73% |
| Microsoft | MSFT | $43.11 | $1.24 | 150 | $6,466.50 | $186.00 | 2.88% |
| Qualcomm | QCOM | $70.93 | $1.68 | 90 | $6,383.70 | $151.20 | 2.37% |
| Snap-on | SNA | $147.34 | $2.12 | 45 | $6,630.30 | $95.40 | 1.44% |
| Stryker | SYK | $92.99 | $1.38 | 70 | $6,509.30 | $96.60 | 1.48% |
| Wells Fargo | WFC | $54.84 | $1.40 | 100 | $5,484.00 | $140.00 | 2.55% |
| Totals | $49,991.80 | $1,165.20 | 2.33% |
Let me highlight a few key points. First, notice how well diversified this portfolio is. There are two tech stocks (MSFT, QCOM), two financials (AFL, WFC), one healthcare (SYK), one consumer staples (HRL), one consumer discretionary (F) and one industrial (SNA). I’m always amazed by investors who think diversification means owning both Facebook and Twitter.
You’ll also notice that these stocks are strong dividend payers, and many have long histories of raising their dividends each year. In fact, Qualcomm (QCOM) and Wells Fargo (WFC) may be raising their dividends soon. It won’t be long before this portfolio is paying out more than $300 every quarter, which averages to $100 per month.
Here’s another important factor, and it’s one that’s often overlooked. These are all fairly liquid stocks. An investor will have little trouble having his order for 100 shares of Hormel filled quickly, and close to the last trade. That means this eight-stock portfolio can be easily filled with just eight trades. If we assume $10 per trade, and there are discount brokers that go even lower, that works out to $80 in transaction costs, which is just 0.16% of the portfolio.
But here’s the thing—that’s a one-time cost. From then on, we have a no-cost portfolio. Even if you’re a stickler for rebalancing, that shouldn’t be a concern for three years, maybe longer. If you’re mindful of these principles, you can build a high-quality portfolio from the stocks on our Buy List.
Buy List Updates
Speaking of our Buy List, this has been a fairly quiet period for us. I did, however, want to highlight a news items. Ford (F) had a sluggish sales report for February, but Ford execs said that the changeover is still in process. Dealers won’t be fully stocked until the middle of the year; as a result, inventories are very tight. Of course, that’s a good problem to have, but it needs to be addressed. Only 21% of F-150 sales last month were the new model. Ford’s trying to manage its inventory by holding back on incentives. Shares of Ford fell 2.4% on Tuesday, but it’s too early to make a judgment on the new trucks. We’ll have a better idea in two or three months. Ford continues to be a good buy up to $17 per share.
Shares of eBay (EBAY) just hit a new 52-week high. This has been a nice rally for them. In October, the stock dropped below $47 per share. I told you to “stick with this one.” Now it’s at $59 per share.
AFLAC (AFL) finished the day on Thursday at $62.80 per share. That’s its highest close in nearly a year. Yes, I know the weak yen hurts AFLAC, but the yen has stabilized (somewhat) over the last three months around 120. AFLAC is still going for about 10 times earnings.
Last week, I highlighted the strong earnings report from Ross Stores (ROST). On Friday, the stock jumped nearly 7% and nearly made it to $107 per share this week.
Stryker’s (SYK) board approved a $2 billion share buyback. As you may have gathered, I’m not a big fan of buybacks, but I don’t fault the companies. The announcements are great PR. Stryker’s market cap is $35 billion, so this buyback is a sizeable amount. Still, I’d rather have that money as dividends.
Wells Fargo (WFC) has worked its way back from a slight sell-off earlier this year. On Thursday, the Federal Reserve gave Wells a passing grade for its latest stress test. Wells is so well run that there wasn’t much of a concern of them failing. The stress test results will play a role in determining if the Fed will allow Wells to raise its dividend. Last April, the bank increased its dividend by five cents to 30 cents per share. I think we’ll see a similar increase this year.
That’s all for now. Next week should be a quiet week for the American market. On Monday, the Labor Department will report on the number of job openings. The number of job openings soared nearly 30%, so it will be interesting to see if that trend continues. On Thursday, the Census Bureau will release its retail-sales report. This is always a good way to get a feel of how strong consumer spending is. Oracle’s Q3 earnings report is due on March 17. In December, they said they expect earnings to range between 69 and 74 cents per share. Be sure to keep checking the blog for daily updates. I’ll have more market analysis for you in the next issue of CWS Market Review!
– Eddy
Posted by Eddy Elfenbein on March 6th, 2015 at 7:08 am
The information in this blog post represents my own opinions and does not contain a recommendation for any particular security or investment. I or my affiliates may hold positions or other interests in securities mentioned in the Blog, please see my Disclaimer page for my full disclaimer.
-
Archives
- June 2026
- May 2026
- April 2026
- March 2026
- February 2026
- January 2026
- December 2025
- November 2025
- October 2025
- September 2025
- August 2025
- July 2025
- June 2025
- May 2025
- April 2025
- March 2025
- February 2025
- January 2025
- December 2024
- November 2024
- October 2024
- September 2024
- August 2024
- July 2024
- June 2024
- May 2024
- April 2024
- March 2024
- February 2024
- January 2024
- December 2023
- November 2023
- October 2023
- September 2023
- August 2023
- July 2023
- June 2023
- May 2023
- April 2023
- March 2023
- February 2023
- January 2023
- December 2022
- November 2022
- October 2022
- September 2022
- August 2022
- July 2022
- June 2022
- May 2022
- April 2022
- March 2022
- February 2022
- January 2022
- December 2021
- November 2021
- October 2021
- September 2021
- August 2021
- July 2021
- June 2021
- May 2021
- April 2021
- March 2021
- February 2021
- January 2021
- December 2020
- November 2020
- October 2020
- September 2020
- August 2020
- July 2020
- June 2020
- May 2020
- April 2020
- March 2020
- February 2020
- January 2020
- December 2019
- November 2019
- October 2019
- September 2019
- August 2019
- July 2019
- June 2019
- May 2019
- April 2019
- March 2019
- February 2019
- January 2019
- December 2018
- November 2018
- October 2018
- September 2018
- August 2018
- July 2018
- June 2018
- May 2018
- April 2018
- March 2018
- February 2018
- January 2018
- December 2017
- November 2017
- October 2017
- September 2017
- August 2017
- July 2017
- June 2017
- May 2017
- April 2017
- March 2017
- February 2017
- January 2017
- December 2016
- November 2016
- October 2016
- September 2016
- August 2016
- July 2016
- June 2016
- May 2016
- April 2016
- March 2016
- February 2016
- January 2016
- December 2015
- November 2015
- October 2015
- September 2015
- August 2015
- July 2015
- June 2015
- May 2015
- April 2015
- March 2015
- February 2015
- January 2015
- December 2014
- November 2014
- October 2014
- September 2014
- August 2014
- July 2014
- June 2014
- May 2014
- April 2014
- March 2014
- February 2014
- January 2014
- December 2013
- November 2013
- October 2013
- September 2013
- August 2013
- July 2013
- June 2013
- May 2013
- April 2013
- March 2013
- February 2013
- January 2013
- December 2012
- November 2012
- October 2012
- September 2012
- August 2012
- July 2012
- June 2012
- May 2012
- April 2012
- March 2012
- February 2012
- January 2012
- December 2011
- November 2011
- October 2011
- September 2011
- August 2011
- July 2011
- June 2011
- May 2011
- April 2011
- March 2011
- February 2011
- January 2011
- December 2010
- November 2010
- October 2010
- September 2010
- August 2010
- July 2010
- June 2010
- May 2010
- April 2010
- March 2010
- February 2010
- January 2010
- December 2009
- November 2009
- October 2009
- September 2009
- August 2009
- July 2009
- June 2009
- May 2009
- April 2009
- March 2009
- February 2009
- January 2009
- December 2008
- November 2008
- October 2008
- September 2008
- August 2008
- July 2008
- June 2008
- May 2008
- April 2008
- March 2008
- February 2008
- January 2008
- December 2007
- November 2007
- October 2007
- September 2007
- August 2007
- July 2007
- June 2007
- May 2007
- April 2007
- March 2007
- February 2007
- January 2007
- December 2006
- November 2006
- October 2006
- September 2006
- August 2006
- July 2006
- June 2006
- May 2006
- April 2006
- March 2006
- February 2006
- January 2006
- December 2005
- November 2005
- October 2005
- September 2005
- August 2005
- July 2005
 Eddy Elfenbein is a Washington, DC-based speaker, portfolio manager and editor of the blog Crossing Wall Street. His