CWS Market Review – June 5, 2015
“I can assure you that any specific projections I write down will
turn out to be wrong, perhaps markedly so.” – Janet Yellen
Thanks for the tip, Janet, but frankly, we were already pretty skeptical of the Fed’s forecasting abilities. To be fair, the Fed’s lackluster track record precedes Yellen’s tenure. But the track record is clear: the Federal Reserve has consistently been overly optimistic on the U.S. economy.
Lately, the Fed has sounded far more aggressive on the need to raise interest rates, while the markets are much more doubtful. When in doubt, I side with the markets over economists. Last year, Janet Yellen implied that rate hikes would happen by the middle of 2015. Well, we’re nearly there, and short rates are still flat as a pancake. It looks like the Fed may not move until the fall. Some folks, like Christine Lagarde at the IMF, think the Fed should wait until next year.
Wall Street is slowly beginning to realize that higher rates are on the way, though they may tarry. In response to the expectation for higher rates, there’s been a pronounced rotation developing just below the surface. This is very important, and I want all investors to understand what’s happening. In this week’s CWS Market Review, we’ll take a closer look at this rotation and how it impacts our portfolios. I’ll also take an early look at Q2 earnings, plus I have some updates on our Buy List stocks. But first, let’s examine the internal shift spreading across the canyons of lower Manhattan.
The Elfenbein Theory of the Stock Market
On my blog two weeks ago, I unveiled the “Elfenbein Theory Which Explains the Entire Stock Market.” I expect my Nobel Prize shortly. Until then, you can read the full post here.
The quick version is that there’s a general pattern to sector rotations in the stock market. These patterns tend to mirror the movement of interest rates, both long-term and short-term. Here’s the matrix I used:
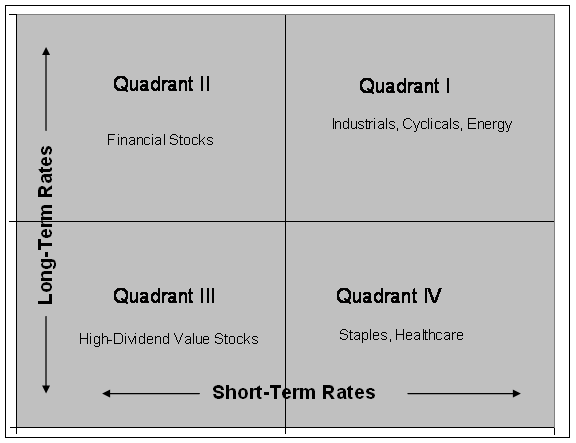
As the stock market has accepted that interest rates will rise, this has caused a shift within the market. It’s interesting that this shift is happening while the overall market has been rather placid. It goes to show that just looking at the major market indexes only tells you part of the story.
What’s happening is that stocks with high-dividend yields have generally lagged the market, while sectors closely tied to the economic cycle have done well. You can see this most clearly by looking at the relative performance of areas like REITs and Utility stocks.
When interest rates move up, investors naturally shun the safety of dividends in hopes of finding more growth elsewhere. Check out this intra-day chart of the Dow Utility Average (in black) along with the Dow Transportation Average (in gold). The two lines have nearly become mirror images!
The important point isn’t that Transports have done well while Utes haven’t. It’s that the Trannies have done well specifically when Utes haven’t. That, my friends, is the key.
What it means is that investors are leaving dividends behind and moving towards cyclical areas. By cyclicals, I mean sectors like Transportation (trucking has been especially strong). This would also include the Tech sector, which has done pretty well this year. The best performer this year on our Buy List is Cognizant Technology Solutions (CTSH), with a 22.4% gain.
There’s an important but subtle distinction about this rotation. The market’s strength has mostly been in areas we call the “early cyclicals.” That’s shorthand for “everything but commodities,” and that’s why the Energy and Material areas are still rather weak. ExxonMobil (XOM) is hovering just above its 52-week low.
An important area to watch is the Consumer Discretionaries. These are large-ticket items, so they tend to be cyclical. But these items are often financed by consumers, so the sector has some correlation with financial stocks. I urge investors not to be overly mechanistic when thinking about the market because a lot of lines get blurred.
When we look at the short end of the yield curve, sure enough, we see some hints that the market is pricing in a rate increase. One price I like to watch is the spread between the six-month and one-year Treasury yields. This is a good clue as to what the six-month yield will be six months from now. From 2012 through 2014, there was a barely a difference between the six-month and one-year yields. Most of the time, the spread was about four or five basis points (or 0.04% to 0.05%). That’s basically nothing, and a few times, there was no spread at all.
This year has been a different story. The spread between six-month and one-year Treasuries recently hit 20 basis points, or 0.2%. That may not sound like much, but it’s the widest spread in more than five years. In short, the bond market is saying, “We’re not asking for much for the next six months, but after that, you’d better start paying up.”
The futures market now thinks there’s a 60% probability the Fed will raise rates by December. That pretty much comports with the yield spread I just mentioned. Interestingly, the Fed meets again on June 16-17. Don’t expect a rate hike then, but I’m sure the committee members will be focused on one soon. But that discussion hinges on the economy.
It’s clear that the broader economy once again faced a slowdown this winter. This was the third time in the last five years that Q1 GDP growth was negative. The more recent data, however, have been more optimistic.
This week, we learned that the ISM Manufacturing Index expanded for the first time this year. The Employment and Non-Manufacturing Indexes both showed expansions, but at a lower rate than last month. The trade deficit for April declined to $40.9 billion. That was $3 billion less than economists were expecting. Also, the Fed’s “Beige Book” was broadly positive.
I’m writing to you on Friday morning ahead of the big May jobs report. On Wednesday, ADP, the payroll firm, said that 201,000 private-sector jobs were created last month. For Friday’s report, the consensus on Wall Street is for a gain of 220,000 net new jobs. According to the last report, 223,000 new jobs were created in April. The unemployment rate ticked down to 5.4%, which was the lowest in six years.
By the way, can you imagine how people would have reacted in, say, 2012 to the news that unemployment would be at 5.4% and the Fed still wouldn’t have raised rates? How the world has changed. Naturally, the unemployment rate is somewhat distorted by the fall in the workforce participation rate. Some of that is demographics, but not all. Sadly, there are a lot of able-bodied people who have dropped out of the work pool entirely.
Sorry, But the Earnings Recession Isn’t Over
Second-quarter earnings season is still a few weeks away, but let’s look at where we stand. Q1 earnings were pretty bad, a 5.5% drop from last year’s Q1. The only good part is that analysts had been expecting even worse. This came after a 5.4% earnings drop for Q4.
Wall Street currently expects earnings for the S&P 500 of $28.57. That’s the index-adjusted figure (each point in the S&P 500 is about $8.85 billion). That represents a 2.6% drop from last year’s Q2. When all the numbers are in, I think there’s a good chance that Q2 earnings will only be down slightly from last year. Unfortunately, this would be the third quarter in a row of falling earnings.
After that, Wall Street expects earnings to rise by 1.3% for Q3. Then earnings start to rip higher. Wall Street expects double-digit growth for Q4 and all of 2016. That, of course, is a long way off but it suggests that once the near-term issues of the strong dollar and weakness in Europe pass, the earnings outlook is bright.
Now for some Buy List stocks that look especially attractive at the moment. While Wabco (WAB) is technically a transport, it does well when rails do well. The stock has been a great performer for us this year. I also like Signature Bank (SBNY). This is another one that doesn’t make a lot of noise, but it’s very good. Among the tech stocks, I still like Qualcomm (QCOM). It’s especially good if you see it below $69 per share.
Updates on our Buy List Stocks
Ross Stores (ROST) is due to split 2-for-1 next Friday, June 11. This week, I’m lowering my Buy Below to $104 per share. The Buy Below will split along with the stock, so the after the split, Ross will be a buy up to $52 per share. This is a very good stock.
This week, I want to make some minor adjustments to our Buy Below prices. I’m lowering Oracle’s (ORCL) Buy Below to $46 per share. I’m also lowering Bed Bath & Beyond (BBBY) to $75 per share. There’s nothing wrong with either stock. I simply don’t want investors chasing after them. Both stocks are due to report earnings later this month. They’re our only two Buy List stocks on the February/May/August/November reporting cycle.
I also want to raise my Buy Below price on Fiserv (FISV) to $82 per share. Fiserv tends to be pretty quiet, so I forget how good it is. I also want to raise the Buy Below on eBay (EBAY) to $65 per share. The shares have done very well since the last earnings report.
That’s all for now. Next week looks to be a slow week, but there will be a few key economic reports. On Tuesday, the Department of Commerce will report on wholesale inventories. On Wednesday, the Treasury Department will update us on the budget. The numbers here have been improving. Then on Thursday, the Census Bureau will report on retail sales for May. Be sure to keep checking the blog for daily updates. I’ll have more market analysis for you in the next issue of CWS Market Review!
– Eddy
Posted by Eddy Elfenbein on June 5th, 2015 at 7:08 am
The information in this blog post represents my own opinions and does not contain a recommendation for any particular security or investment. I or my affiliates may hold positions or other interests in securities mentioned in the Blog, please see my Disclaimer page for my full disclaimer.
-
Archives
- June 2026
- May 2026
- April 2026
- March 2026
- February 2026
- January 2026
- December 2025
- November 2025
- October 2025
- September 2025
- August 2025
- July 2025
- June 2025
- May 2025
- April 2025
- March 2025
- February 2025
- January 2025
- December 2024
- November 2024
- October 2024
- September 2024
- August 2024
- July 2024
- June 2024
- May 2024
- April 2024
- March 2024
- February 2024
- January 2024
- December 2023
- November 2023
- October 2023
- September 2023
- August 2023
- July 2023
- June 2023
- May 2023
- April 2023
- March 2023
- February 2023
- January 2023
- December 2022
- November 2022
- October 2022
- September 2022
- August 2022
- July 2022
- June 2022
- May 2022
- April 2022
- March 2022
- February 2022
- January 2022
- December 2021
- November 2021
- October 2021
- September 2021
- August 2021
- July 2021
- June 2021
- May 2021
- April 2021
- March 2021
- February 2021
- January 2021
- December 2020
- November 2020
- October 2020
- September 2020
- August 2020
- July 2020
- June 2020
- May 2020
- April 2020
- March 2020
- February 2020
- January 2020
- December 2019
- November 2019
- October 2019
- September 2019
- August 2019
- July 2019
- June 2019
- May 2019
- April 2019
- March 2019
- February 2019
- January 2019
- December 2018
- November 2018
- October 2018
- September 2018
- August 2018
- July 2018
- June 2018
- May 2018
- April 2018
- March 2018
- February 2018
- January 2018
- December 2017
- November 2017
- October 2017
- September 2017
- August 2017
- July 2017
- June 2017
- May 2017
- April 2017
- March 2017
- February 2017
- January 2017
- December 2016
- November 2016
- October 2016
- September 2016
- August 2016
- July 2016
- June 2016
- May 2016
- April 2016
- March 2016
- February 2016
- January 2016
- December 2015
- November 2015
- October 2015
- September 2015
- August 2015
- July 2015
- June 2015
- May 2015
- April 2015
- March 2015
- February 2015
- January 2015
- December 2014
- November 2014
- October 2014
- September 2014
- August 2014
- July 2014
- June 2014
- May 2014
- April 2014
- March 2014
- February 2014
- January 2014
- December 2013
- November 2013
- October 2013
- September 2013
- August 2013
- July 2013
- June 2013
- May 2013
- April 2013
- March 2013
- February 2013
- January 2013
- December 2012
- November 2012
- October 2012
- September 2012
- August 2012
- July 2012
- June 2012
- May 2012
- April 2012
- March 2012
- February 2012
- January 2012
- December 2011
- November 2011
- October 2011
- September 2011
- August 2011
- July 2011
- June 2011
- May 2011
- April 2011
- March 2011
- February 2011
- January 2011
- December 2010
- November 2010
- October 2010
- September 2010
- August 2010
- July 2010
- June 2010
- May 2010
- April 2010
- March 2010
- February 2010
- January 2010
- December 2009
- November 2009
- October 2009
- September 2009
- August 2009
- July 2009
- June 2009
- May 2009
- April 2009
- March 2009
- February 2009
- January 2009
- December 2008
- November 2008
- October 2008
- September 2008
- August 2008
- July 2008
- June 2008
- May 2008
- April 2008
- March 2008
- February 2008
- January 2008
- December 2007
- November 2007
- October 2007
- September 2007
- August 2007
- July 2007
- June 2007
- May 2007
- April 2007
- March 2007
- February 2007
- January 2007
- December 2006
- November 2006
- October 2006
- September 2006
- August 2006
- July 2006
- June 2006
- May 2006
- April 2006
- March 2006
- February 2006
- January 2006
- December 2005
- November 2005
- October 2005
- September 2005
- August 2005
- July 2005
 Eddy Elfenbein is a Washington, DC-based speaker, portfolio manager and editor of the blog Crossing Wall Street. His