The 2019 Buy List
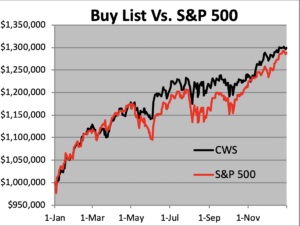
The 2019 trading year is on the books! For 2019, the S&P 500 gained 28.88% while our Buy List gained 29.99%. Including dividends, the S&P 500 gained 31.49% while our Buy List gained 31.57%.
That’s right, we beat the market by eight basis points!
This was a close finish. By August, our Buy List had a 6% lead over the market, but much of that eroded away in the final weeks of the year.
For the long-term, we’ve done quite well. Over the last 14 years, our Buy List has gained 309.61% while the S&P 500 has gained 247.13%.
Our biggest winner of the year was Moody’s (MCO) which gained nearly 70%. Fifteen of our 25 stocks were up more than 30% for the year. Every stock except Cognizant Technology Solutions (CTSH) and Eagle Bank (EGBN) finished in the black.
For people who care about such things, the “beta” of our Buy List in 2019 was 0.8125. That’s pretty low for us. The correlation of the daily changes of the Buy List to the changes of the S&P 500 was 89.96%.
The chart below details the Buy List’s performance. I’ve listed each stock along with the number of shares and the starting and ending prices. For tracking purposes, I assume the Buy List is a $1 million portfolio that starts out equally divided among the 25 stocks.
| Stock | Shares | 12/31/18 | Beginning | 12/31/19 | Ending | Profit/Loss |
| AFL | 877.96313 | $45.56 | $40,000.00 | $52.90 | $46,444.25 | 16.11% |
| BDX | 177.52530 | $225.32 | $40,000.00 | $271.97 | $48,281.56 | 20.70% |
| BR | 415.58442 | $96.25 | $40,000.00 | $123.54 | $51,341.30 | 28.35% |
| CBPX | 1571.70923 | $25.45 | $40,000.00 | $36.43 | $57,257.37 | 43.14% |
| CERN | 762.77651 | $52.44 | $40,000.00 | $73.39 | $55,980.17 | 39.95% |
| CHD | 608.27251 | $65.76 | $40,000.00 | $70.34 | $42,785.89 | 6.96% |
| CHKP | 389.67365 | $102.65 | $40,000.00 | $110.96 | $43,238.19 | 8.10% |
| CTSH | 630.11972 | $63.48 | $40,000.00 | $62.02 | $39,080.03 | -2.30% |
| DHR | 387.89760 | $103.12 | $40,000.00 | $153.48 | $59,534.52 | 48.84% |
| DIS | 364.79708 | $109.65 | $40,000.00 | $144.63 | $52,760.60 | 31.90% |
| EGBN | 821.18661 | $48.71 | $40,000.00 | $48.63 | $39,934.30 | -0.16% |
| FDS | 199.87008 | $200.13 | $40,000.00 | $268.30 | $53,625.14 | 34.06% |
| FISV | 544.29174 | $73.49 | $40,000.00 | $115.63 | $62,936.45 | 57.34% |
| GL | 536.69663 | $74.53 | $40,000.00 | $105.25 | $56,487.32 | 41.22% |
| HRL | 937.20712 | $42.68 | $40,000.00 | $45.11 | $42,277.41 | 5.69% |
| HSY | 373.20396 | $107.18 | $40,000.00 | $146.98 | $54,853.52 | 37.13% |
| ICE | 530.99695 | $75.33 | $40,000.00 | $92.55 | $49,143.77 | 22.86% |
| MCO | 285.63268 | $140.04 | $40,000.00 | $237.41 | $67,812.05 | 69.53% |
| ROST | 480.76923 | $83.20 | $40,000.00 | $116.42 | $55,971.15 | 39.93% |
| RPM | 680.50357 | $58.78 | $40,000.00 | $76.76 | $52,235.45 | 30.59% |
| RTN | 260.84121 | $153.35 | $40,000.00 | $219.74 | $57,317.25 | 43.29% |
| SBNY | 389.06721 | $102.81 | $40,000.00 | $136.61 | $53,150.47 | 32.88% |
| SHW | 101.66218 | $393.46 | $40,000.00 | $583.54 | $59,323.95 | 48.31% |
| SJM | 427.85325 | $93.49 | $40,000.00 | $104.13 | $44,552.36 | 11.38% |
| SYK | 255.18341 | $156.75 | $40,000.00 | $209.94 | $53,573.21 | 33.93% |
| Total | $1,000,000.00 | $1,299,897.68 | 29.99% |
On August 8, 2019, Torchmark changed its name to Globe Life. The ticker symbol changed from TMK to GL.
Here’s how the Buy List performed throughout the year:
Here’s the data behind the dividend-adjusted returns. I’ve listed each stock’s beginning price, ending price and dividend-adjusted starting price.
 Eddy Elfenbein is a Washington, DC-based speaker, portfolio manager and editor of the blog Crossing Wall Street. His