CWS Market Review – August 21, 2020
“Although it’s easy to forget sometimes, a share of stock is not a lottery ticket. It’s part ownership of a business.” – Peter Lynch
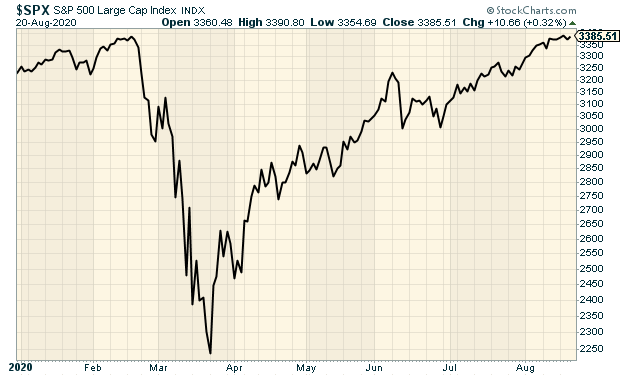
It finally happened: the stock market made a new all-time high. On Tuesday, the S&P 500 closed at 3,389.78. That eclipsed the old peak, which was reached one day shy of six months before. Take that, Covid.
This means that this year, we’ve had one of the sharpest bear markets in histor, followed by one the sharpest bull markets in history. It’s all happened this year, and we’re not even to Labor Day.
A lot of people have asked me: How can it be that the economy is so beaten up while the stock market is doing so well? More than a few have wondered if there’s some shadowy manipulation going on behind the scenes. Please. But there’s nothing unusual going on, and it’s not a secret government plot.
In this week’s issue, we’ll take a closer look at the seeming disconnect between the market and the economy. I’ll also go over Thursday’s earnings report from Ross Stores. The deep-discounter surprised us by earning a small profit. I’ll also preview next week’s earnings report from Hormel Foods. Believe it or not, Spam’s sales have benefited from the age of Covid. I’ll also look at some recent news from our Buy List stocks. But first, let’s look at the dichotomy of the economy and the stock market.
The Disconnect Between the Economy and the Stock Market
Unemployment is over 10%, yet Apple (AAPL) just crossed $2 trillion in market value. How can the stock market be rallying when the economy is flat on its back and so many people are suffering? It’s a good question, and the answer goes to the heart of investing.
I’m happy to tell you that it’s not the result of any dark conspiracy. Instead, these are two very different trends. The stock market looks forward as investors try to anticipate events that will happen a few months down the road. However, most economic data are backward looking. The most recent GDP report covered the time period of two to five months ago. In fact, we rarely have a good idea of how the economy is doing at this exact moment.
Not only that, but most economic data are subject to countless revisions. Sometimes data are updated years after the fact. We don’t even have a good idea of the workings of economic history.
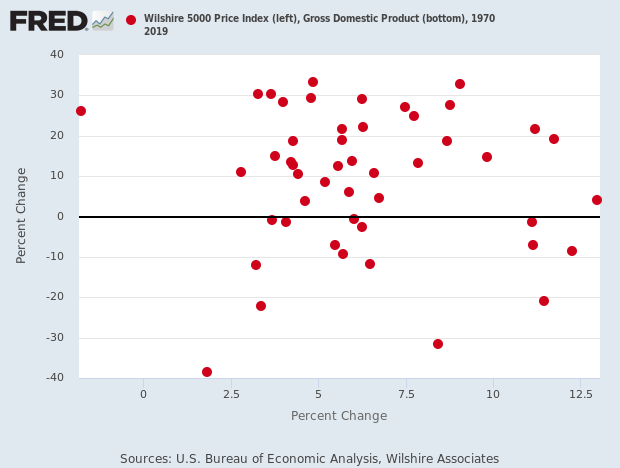
Here’s an interesting graph. I took the annual change in the economy (the horizontal axis) and compared it with changes in the stock market (the vertical axis). It looks like a totally random scatter plot. I don’t see any correlation whatsoever.
That’s not to say that there is no relationship between financial markets and the real economy. My friend Josh Brown likes to use this analogy. Imagine you see a woman walking her dog in the park. The woman generally walks in a straight line. The dog, however, darts around in every direction.
Since the woman has the dog on a leash, they eventually go in the same direction; it’s just that one does it following a more chaotic route. Here, the woman is the economy, and our frenetic canine is the stock market. Sure, it will take many more steps, but the dog will get where the woman is going.
It’s also not unreasonable to think this might be a proper valuation for the stock market. Remember, the two keys for valuation are earnings (which have dried up) and interest rates. Those have gone down significantly. The yield on the 10-year Treasury recently reached its all-time low.
Low bond yields are very good for stock valuations. This is because they make bonds tougher competition for stocks. That’s why stocks have to rally to keep up. As well as stocks have done, they’re still trailing bonds this year. Of course, it’s nice to have the Federal Reserve as your top customer.
Also, lower bond yields make it easier for companies to borrow money. Just recently we’ve seen stocks like Intercontinental Exchange and Middleby raise money from the bond market. With yields so low, why not?
We should also consider that the economy is no longer shrinking. In fact, it’s probably rising at a rapid clip. Not enough to bring us back to status quo ante, but very fast by historical standards. This is probably what the stock market was anticipating a few months ago. According to the Atlanta Fed’s GDPNow estimate, their model sees growth of more than 25% for Q3.
The bottom line is to not worry about a rising market amid a soggy economy. It’s not an historical outlier. One of the best parts of our investing strategy is that we don’t worry if the current market “makes sense” or not. Instead, we just focus on good companies. Speaking of which, let’s look at the recent earnings report from one of our favorite retailers.
Ross Stores’s Surprise Profit
After Thursday’s close, Ross Stores (ROST) reported its fiscal Q2 results. Once again, this quarter, which was the 13 weeks ending in August 1, was heavily impacted by the economic lockdown. Ross closed all of its stores on March 20, and the company started reopening some stores on May 14. By the end of June, most of its stores were open again.
Impressively, Ross actually made a profit for its Q2. Sure, it’s a small profit, but remember, the deep discounter posted an 87-cent loss for Q1. For Q2, Ross made $22 million which works out to six cents per share. Small, but it beat Wall Street’s consensus which had been expecting a loss of 26 cents per share. For context, Ross made $1.14 per share for last year’s Q2.
Business is still tough. Total sales dropped from $4.0 million last year to $2.7 million this year. Comparable-store sales, which is a key metric for retailers, dropped by 12%.
CEO Barbara Rentler said the re-openings were helped by pent-up demand and aggressive markdowns to clear out old inventory. She noted that the average store was open for 75% of the quarter. That took a toll on ROST’s operating margin.
Looking ahead, Ms. Rentler said, “As we move into the third quarter, trends have not materially changed from the second quarter, with comparable store sales for the first two-and-a-half weeks trending down mid-teens versus last year. There remains significant uncertainty on how the pandemic will continue to evolve and affect consumer demand and the economy, and the potential exists for additional government-mandated shutdowns if COVID-19 cases remain elevated or further increase. Given these risks, we will continue to plan and manage our business very cautiously. Due to the limited visibility we have on these risks, we are not providing sales or earnings guidance at this time.”
The bottom line is that Ross is doing as well as can be expected. Shares of Ross trended lower the last two days. Perhaps some traders were anticipating bad results. Well, they didn’t get it. This report was much better than expectations, and it tells me that Ross will thrive once the economy gets back to normal. Ross Stores remains a buy up to $92 per share.
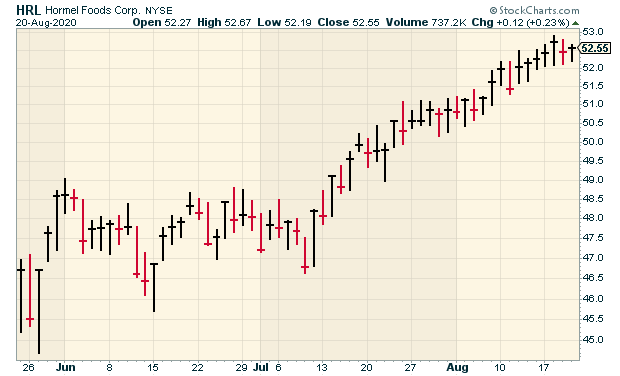
Hormel Foods Earnings Preview
Hormel Foods (HRL) is scheduled to report its fiscal Q3 earnings on Tuesday, August 25. After that, we won’t have much in the way of earnings reports until mid-October. The only exceptions are FactSet (FDS) and RPM International (RPM), which should report sometime in September.
I often tell investors that Hormel is a lot more than Spam. At the same time, don’t overlook Spam. It’s been particularly popular this year. At Bloomberg Opinion, Alan Minter notes that in the 15 weeks ending June 13, sales of Spam jumped 70%. During Covid, Americans stocked up on Spam, and they’re still buying it. Last year was Spam’s fifth year in a row of record growth. Spam is particularly popular with Asian-American and Hispanic customers.
In May, Hormel reported a tough quarter for its fiscal Q2. That’s right as the lockdowns started. Organic sales rose 6%, but earnings fell to 42 cents per share, which matched Wall Street’s consensus.
Hormel currently has over $600 million cash on hand. The company is in a strong financial position with limited debt and consistent cash flows. Total debt is $315 million, up from $250 million at the beginning of the year.
As a defensive stock, Hormel didn’t fall nearly as much as the rest of the market did in February and March. It also didn’t rise as quickly as the market did since then. Still, it’s up 16% this year which is well ahead of the S&P 500. For next week’s report, Wall Street’s consensus is for sales growth of 3.3% and earnings of 34 cents per share.
Buy List Updates
In May, shares of Ansys (ANSS) slipped after their guidance fell below expectations. It’s up 25% since then, and on Thursday, the shares got to another new all-time high. This is why we focus on high-quality stocks. Ansys has been a big winner for us this year.
Deutsche Bank initiated coverage on Check Point Software (CHKP) with a Hold rating. They have a price target of $128. I usually don’t pay much attention to analyst upgrades, but I wanted to pass this news along.
Marc Rubinstein has a very good post on Intercontinental Exchange (ICE) and what makes it tick. ICE just shelled out a huge chunk of money to buy Ellie Mae, a firm in the mortgage business. ICE plans to float $6.5 billion in bonds to finance the deal. This week, I’m raising my Buy Below price on ICE to $110 per share.
This week, Middleby (MIDD) said that it’s going to float $550 million in convertible bonds. The bonds are due in five years, and the interest rate is 1%. Middleby is doing this as part of a plan to “enhance our capital structure and provide greater financial flexibility.” These moves usually rankle investors in the short term. Sure enough, shares of MIDD are off by 10% over the last three sessions. Don’t worry about Middleby. The stock remains a good buy up to $106 per share.
Trex (TREX) got to another new high for us this week. Through Thursday, Trex is up 63% for us this year.
That’s all for now. This is a slow time for Wall Street. Many of the big shots are enjoying the waning days of summer on Martha’s Vineyard or at the Hamptons. There are, however, a few key economic reports coming out next week. On Tuesday, we’ll get reports on new-home sales and consumer confidence. On Wednesday, it’s durable goods. Then on Thursday, they’ll update the Q2 GDP report. If you recall, the initial report showed a decline of 32.9%. We’ll also get another jobless-claims report. Be sure to keep checking the blog for daily updates. I’ll have more market analysis for you in the next issue of CWS Market Review!
– Eddy
Posted by Eddy Elfenbein on August 21st, 2020 at 7:08 am
The information in this blog post represents my own opinions and does not contain a recommendation for any particular security or investment. I or my affiliates may hold positions or other interests in securities mentioned in the Blog, please see my Disclaimer page for my full disclaimer.
-
Archives
- May 2026
- April 2026
- March 2026
- February 2026
- January 2026
- December 2025
- November 2025
- October 2025
- September 2025
- August 2025
- July 2025
- June 2025
- May 2025
- April 2025
- March 2025
- February 2025
- January 2025
- December 2024
- November 2024
- October 2024
- September 2024
- August 2024
- July 2024
- June 2024
- May 2024
- April 2024
- March 2024
- February 2024
- January 2024
- December 2023
- November 2023
- October 2023
- September 2023
- August 2023
- July 2023
- June 2023
- May 2023
- April 2023
- March 2023
- February 2023
- January 2023
- December 2022
- November 2022
- October 2022
- September 2022
- August 2022
- July 2022
- June 2022
- May 2022
- April 2022
- March 2022
- February 2022
- January 2022
- December 2021
- November 2021
- October 2021
- September 2021
- August 2021
- July 2021
- June 2021
- May 2021
- April 2021
- March 2021
- February 2021
- January 2021
- December 2020
- November 2020
- October 2020
- September 2020
- August 2020
- July 2020
- June 2020
- May 2020
- April 2020
- March 2020
- February 2020
- January 2020
- December 2019
- November 2019
- October 2019
- September 2019
- August 2019
- July 2019
- June 2019
- May 2019
- April 2019
- March 2019
- February 2019
- January 2019
- December 2018
- November 2018
- October 2018
- September 2018
- August 2018
- July 2018
- June 2018
- May 2018
- April 2018
- March 2018
- February 2018
- January 2018
- December 2017
- November 2017
- October 2017
- September 2017
- August 2017
- July 2017
- June 2017
- May 2017
- April 2017
- March 2017
- February 2017
- January 2017
- December 2016
- November 2016
- October 2016
- September 2016
- August 2016
- July 2016
- June 2016
- May 2016
- April 2016
- March 2016
- February 2016
- January 2016
- December 2015
- November 2015
- October 2015
- September 2015
- August 2015
- July 2015
- June 2015
- May 2015
- April 2015
- March 2015
- February 2015
- January 2015
- December 2014
- November 2014
- October 2014
- September 2014
- August 2014
- July 2014
- June 2014
- May 2014
- April 2014
- March 2014
- February 2014
- January 2014
- December 2013
- November 2013
- October 2013
- September 2013
- August 2013
- July 2013
- June 2013
- May 2013
- April 2013
- March 2013
- February 2013
- January 2013
- December 2012
- November 2012
- October 2012
- September 2012
- August 2012
- July 2012
- June 2012
- May 2012
- April 2012
- March 2012
- February 2012
- January 2012
- December 2011
- November 2011
- October 2011
- September 2011
- August 2011
- July 2011
- June 2011
- May 2011
- April 2011
- March 2011
- February 2011
- January 2011
- December 2010
- November 2010
- October 2010
- September 2010
- August 2010
- July 2010
- June 2010
- May 2010
- April 2010
- March 2010
- February 2010
- January 2010
- December 2009
- November 2009
- October 2009
- September 2009
- August 2009
- July 2009
- June 2009
- May 2009
- April 2009
- March 2009
- February 2009
- January 2009
- December 2008
- November 2008
- October 2008
- September 2008
- August 2008
- July 2008
- June 2008
- May 2008
- April 2008
- March 2008
- February 2008
- January 2008
- December 2007
- November 2007
- October 2007
- September 2007
- August 2007
- July 2007
- June 2007
- May 2007
- April 2007
- March 2007
- February 2007
- January 2007
- December 2006
- November 2006
- October 2006
- September 2006
- August 2006
- July 2006
- June 2006
- May 2006
- April 2006
- March 2006
- February 2006
- January 2006
- December 2005
- November 2005
- October 2005
- September 2005
- August 2005
- July 2005
 Eddy Elfenbein is a Washington, DC-based speaker, portfolio manager and editor of the blog Crossing Wall Street. His