The 2020 Buy List
The 2020 trading year is on the books! What a difficult year this was for everyone. I’ll admit that I’m not sad to leave 2020 behind.
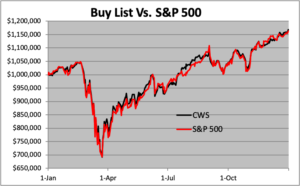
Let’s look at our performance. For 2020, the S&P 500 gained 16.26% while our Buy List gained 16.79%. However, once we include dividends, then the S&P 500 gained 18.40% while our Buy List gained 17.93%.
So we lost to the overall market by less than 0.5%. In our defense, we managed to keep with the market in a very difficult year. We didn’t own any of the tech behemoths that saw tremendous gains in 2020. To give you an example, the S&P 500 Equal Weight index, which weighs every member the same, gained 10.47% in 2020. That means we beat most stocks.
For the long-term, we’ve done quite well. Over the last 15 years, our Buy List has gained 383.05% while the S&P 500 has gained 311.00%.
Our biggest winner in 2020 was Trex (TREX) which gained over 86%. Danaher (DHR) and Ansys (ANSS) were second and third, respectively. AFLAC (AFL) was our worst performer in 2020, which is very unusual for the duck stock.
For people who care about such things, the “beta” of our Buy List in 2020 was 0.9246. The correlation of the daily changes of the Buy List to the changes of the S&P 500 was 96.52%.
The chart below details our Buy List’s performance. I’ve listed each stock along with the number of shares and the starting and ending prices. For tracking purposes, I assume the Buy List is a $1 million portfolio that starts out equally divided among the 25 stocks.
| Stock | Shares | 12/31/19 | Beginning | 12/31/20 | Ending | Profit/Loss |
| AFL | 756.14367 | $52.90 | $40,000.00 | $44.47 | $33,625.71 | -15.94% |
| ANSS | 155.39412 | $257.41 | $40,000.00 | $363.80 | $56,532.38 | 41.33% |
| BDX | 147.07505 | $271.97 | $40,000.00 | $250.22 | $36,801.12 | -8.00% |
| BR | 323.78177 | $123.54 | $40,000.00 | $153.20 | $49,603.37 | 24.01% |
| CERN | 545.03338 | $73.39 | $40,000.00 | $78.48 | $42,774.22 | 6.94% |
| CHD | 568.66648 | $70.34 | $40,000.00 | $87.23 | $49,604.78 | 24.01% |
| CHKP | 360.49027 | $110.96 | $40,000.00 | $132.91 | $47,912.76 | 19.78% |
| DHR | 260.62028 | $153.48 | $40,000.00 | $222.14 | $57,894.19 | 44.74% |
| DIS | 276.56779 | $144.63 | $40,000.00 | $181.18 | $50,108.55 | 25.27% |
| EGBN | 822.53753 | $48.63 | $40,000.00 | $41.30 | $33,970.80 | -15.07% |
| FDS | 149.08684 | $268.30 | $40,000.00 | $332.50 | $49,571.37 | 23.93% |
| FISV | 345.93099 | $115.63 | $40,000.00 | $113.86 | $39,387.70 | -1.53% |
| GL | 380.04751 | $105.25 | $40,000.00 | $94.96 | $36,089.31 | -9.78% |
| HRL | 886.72135 | $45.11 | $40,000.00 | $46.61 | $41,330.08 | 3.33% |
| HSY | 272.14587 | $146.98 | $40,000.00 | $152.33 | $41,455.98 | 3.64% |
| ICE | 432.19881 | $92.55 | $40,000.00 | $115.29 | $49,828.20 | 24.57% |
| MCO | 168.48490 | $237.41 | $40,000.00 | $290.24 | $48,901.06 | 22.25% |
| MIDD | 365.23009 | $109.52 | $40,000.00 | $128.92 | $47,085.46 | 17.71% |
| ROST | 343.58358 | $116.42 | $40,000.00 | $122.81 | $42,195.50 | 5.49% |
| RPM | 521.10474 | $76.76 | $40,000.00 | $90.78 | $47,305.89 | 18.26% |
| SCL | 390.47247 | $102.44 | $40,000.00 | $119.32 | $46,591.18 | 16.48% |
| SHW | 68.54714 | $583.54 | $40,000.00 | $734.91 | $50,375.98 | 25.94% |
| SLGN | 1,287.00129 | $31.08 | $40,000.00 | $37.08 | $47,722.01 | 19.31% |
| SYK | 190.53063 | $209.94 | $40,000.00 | $245.04 | $46,687.63 | 16.72% |
| TREX | 890.07566 | $44.94 | $40,000.00 | $83.72 | $74,517.13 | 86.29% |
| Total | $1,000,000.00 | $1,167,872.36 | 16.79% |
Trex (TREX) split 2-for-1 on September 15.
Here’s how the Buy List performed throughout the year:
Here’s the data behind the dividend-adjusted returns. I’ve listed each stock’s beginning price, ending price and dividend-adjusted starting price.
 Eddy Elfenbein is a Washington, DC-based speaker, portfolio manager and editor of the blog Crossing Wall Street. His