The Dow’s Return by Day of the Month
In previous posts, I’ve crunched the numbers on the entire +120-year history of the Dow Jones Industrial Average to find certain calendar effects. For example, the stock market has historically experienced a nice Santa Claus Rally around Christmastime. Looking at 10-year slices, the market has also perked up in the latter half of a decade.
There are lots of these tidbits. I don’t take them too seriously since I’m geared toward the long term. My latest look, however, was startling. I broke down the entire history of the Dow to see its return by day of the month, meaning its calendar day (the first, second, third, etc.).
The results shocked me. Nearly the entire gain of the Dow has come during the first six days of the month. During the rest of the month, the market is up but a very tiny bit.
I took the Dow from its first day in May 1896 through the end of 2019. Here’s what the average month looks like:
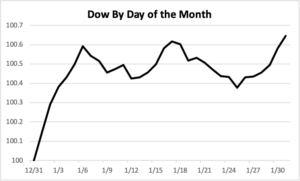
On the first six days of the month, the Dow has gained 54,752%. That’s an average gain of 0.59% per those six days. Over the rest of the month, the Dow has gained just 28%. That’s 28% in over 27,000 trading days. Per month, the return works out to 0.05%.
In plainer terms, in the first six days of each month, the stock market has gained more than 10 times what it does compared with the rest of the month.
Obviously, it’s very expensive to dart in and out of the market so frequently. No serious investor should behave that way, but this does illuminate a broader fact of investing: returns are seldomly equally distributed.
The market has also done well towards the end of each month. Over the 26th through the 31st, the Dow has averaged a gain of 0.27%. (Bearing in mind that only seven months have 31 days, of course.)
That means that from the 7th to the 25th of each month, the Dow has lost an average of 0.21%. The rest of the time, the Dow has gained an average of 0.86% per month.
Here’s the return by each day of the month:

Here’s the date, the return for each day of the month and the number of times that day came up.
 Eddy Elfenbein is a Washington, DC-based speaker, portfolio manager and editor of the blog Crossing Wall Street. His