CWS Market Review – July 20, 2021
This is the free version of CWS Market Review. If you have a chance, please sign up for the premium newsletter for $20 per month or $200 for the whole year.
High-Beta Stocks Snap
The stock market rose today which snapped a three-day losing streak. On Monday, the S&P 500 suffered its biggest drop in two months. At one point during the trading day, the index dropped below its 50-day moving average. That’s often a key bearish move for chart-watchers.
What’s interesting is that the S&P 500 has come close to dipping below its 50-DMA a few times. In fact, it’s gone below it as well. However, each time the index gets near the 50-DMA, it acts almost like a trampoline. Every dip has become a buying opportunity. It happened again today.
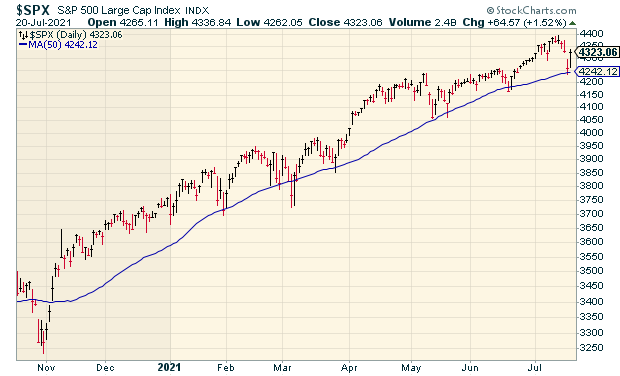
Here’s a great fact: The S&P 500 hasn’t closed below its 50-DMA on back-to-back days since October. That makes this the longest such streak in 25 years.
The takeaway is that this has been a very calm and consistently rising market. That’s why any break has gotten some attention. It’s hard to think of a market where “buy the dip” has worked so consistently.
But what’s really stood out recently has been the divergence between High Beta stocks and Low Volatility stocks. In plain English, these are stocks that move around a lot compared with the stocks that are more stable. Historically, the stable ones have done better, but the High Beta ones can be dramatic winners in a short period of time.
It’s important to follow how these two types of stocks are performing relative to each other. When High Beta does well, that usually means investors are getting greedier. When Low Vol takes the lead, that usually means that investors are becoming more cautious. It’s not that one is better than the other. Rather, it’s a question of how investors feel about the current cycle.
Since the pandemic low, the High Beta stocks have been big winners. I think that’s because of the optimism regarding the economy. Not that things are going swimmingly, but things are going better than the smart money had expected, especially since the beginning of the year.
Since early June, however, the Low Vol stocks have been making their comeback. It started out quietly, but it got very dramatic over the last four days. Monday turned into an all-out rout for the High Beta stocks.
Look at how dramatically the High Beta sector (blue line) has broken down.
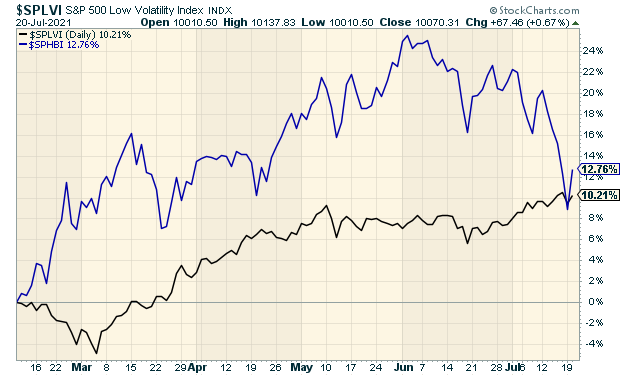
It’s funny that you can easily see that the black line is clearly less volatile.
Our Buy List isn’t exactly a Low Vol portfolio, but it leans in that direction. Quick note: When you build a portfolio—really, any portfolio—you’ll find that you’ll unintentionally skew in one direction or another. That’s just how investing is. For example, if you buy a lot of REITs or Utilities, you’ll quickly find that your portfolio is very sensitive to any interest-rate comments from the Federal Reserve.
I didn’t plan to have a Low Vol portfolio. I chose what I liked, and it turned out that the majority of our stocks bend in that direction. The good news is that we’ve outperformed the overall market significantly over the past few days.
The shift to Low Vol has been too big to ignore. It’s not just a little bump like we’ve seen before. I think this could be the turning point for this cycle. Unfortunately, pinpointing the starting or ending points of market cycles is a notoriously difficult task. This earnings season will probably tell us a lot more where we stand. We have two Buy List earnings reports later this week, and 13 more coming next week. I suspect that Low Vol will continue to lead.
Nearing the Top in the Presidential Election Cycle
That’s not the only cycle to watch. Circle your calendars for August 4. Why? Because that’s been the traditional peak in the four-year market cycle.
I took all of the daily closes of the Dow Jones Industrial Average going back to its beginning 125 years ago. I then crunched what the average four-year cycle looks like. I found that the market peaks on August 4 of the post-election year.
Here’s what the cycle looks like. I started the line at 100 at the beginning of the post-election year.
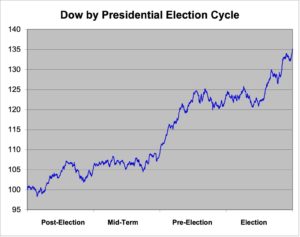
This mini-bear market lasts for about 14 months, until September 30 of the mid-term year. Over that time, the market loses about 2.58%. That may not seem like a lot—and it’s not—but for a 14-month segment in a 125-year data series, it stands out.
For the other 34 months, the Dow has had an average gain of 38.73%. There’s another slow period from the middle of the pre-election year to the middle of the election year. Except for those two periods, the market does quite well.
Let me be clear: I don’t put faith in these types of stats. I think they’re interesting in a general sense. I would never make a market decision based on this.
Still, it’s interesting that incumbent presidents have probably had an effect on the stock markets. They work to make the economy peak by election day. The rally lasts for a few months before it stalls out. The market eventually bottoms around the mid-term elections. One of the best things about being a long-term investor is that you don’t have to worry about such things.
Don’t forget to sign up for our premium newsletter. It’s just $20 per month or $200 for a full year. With earnings season coming up, you don’t want to miss out!
The Shortest Recession Ever!
This National Bureau for Economic Research (NBER) is considered to be the industry standard in economics for dating economic recessions and expansions. They already told us that the economy went into recession in March 2020 (duh).
We had been waiting for the official word on when the recession ended. This week, NBER said the economy bottomed in April 2020. That means it was just a two-month recession. That’s the fastest one on record. NBER lists all the economic cycles going back to 1854.
The previous record for fastest recession was a six-month recession during the first half of 1980. That was a generally chaotic time for the U.S. economy.
You often hear in the media that a recession is two or more consecutive quarters of negative GDP growth. That’s a good ballpark definition of a recession, but it’s not precisely correct.
This is the official policy from NBER. (My apologies for the econo-speak).
In determining the dates of business cycle turning points, the committee follows standard procedures to assure continuity in the chronology. Because a recession must influence the economy broadly and not be confined to one sector, the committee emphasizes economy-wide measures of economic activity. It views real gross domestic product (GDP) as the single best measure of aggregate economic activity. This concept is measured two ways by the US Bureau of Economic Analysis (BEA)—from the expenditure side and from the income side. Because the two measures have strengths and weaknesses and differ by a statistical discrepancy, the committee considers real GDP and real gross domestic income (GDI) on an equal footing. It also places considerable weight on total payroll employment as measured by the Bureau of Labor Statistics (BLS).
Basically, real GDP is the best. The problem is that that’s quarterly data so the committee uses monthly data like nonfarm payrolls to fill in the gaps.
In March and April 2020, the U.S. economy lost 22 million jobs. Since then, we’ve added back over 15 million. We’re still a long way from full employment, but I don’t see any recession on the horizon.
Mueller Industries Jumps 7%
A few weeks ago, I highlighted Mueller Industries (MLI) for you. At the time, I said “Keep an eye on Mueller. This could be a big winner in the months ahead.” The shares jumped nearly 7% today thanks to a great earnings report.
One of the reasons why I like Mueller, other than being a great company, is that it’s mostly ignored by Wall Street. Mueller is a leading manufacturer of copper, brass, aluminum and plastic products. This is a classic small-cap cyclical stock. Once you realize the scope of their business, you understand that the use of Mueller’s products is seemingly endless. Mueller makes everything from copper tubing and fittings to brass and copper alloy bars and refrigeration valves.
You can find Mueller most anywhere. Some of the companies that rely on Mueller are in sectors like plumbing, heating, air conditioning, refrigeration, appliance, medical, automotive, military and defense, marine and recreational. Mueller’s operations are located throughout the United States and in Canada, Mexico, Great Britain, South Korea, and China.
Over the last 30 years, MLI has gained more than 110-fold (including dividends).
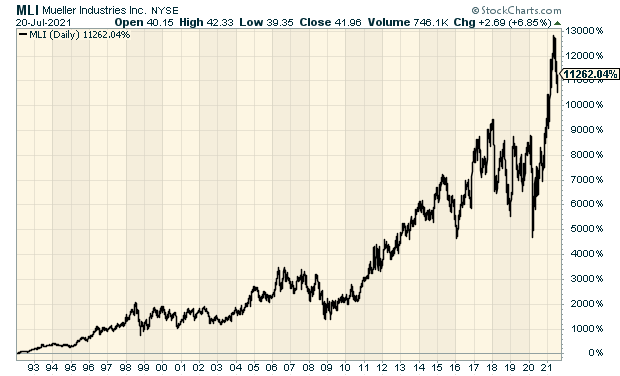
This morning, Mueller reported Q2 earnings of $1.92 per share. That’s up from 50 cents for last year’s Q2. How does that compare with Wall Street’s consensus? Well, that’s hard to say because no analysts currently provide earnings estimates. Given the market’s strong reaction, we can probably assume that it was much better than expected.
It’s pretty amazing that a company that’s been around for over 100 years and has gained more than 100-fold in 30 years is virtually ignored by Wall Street. I’ll reiterate what I said before, keep an eye on Mueller. This can be a big winner for investors.
That’s all for now. I’ll have more for you in the next issue of CWS Market Review.
– Eddy
Don’t forget to sign up for our premium newsletter. It’s full of news and analysis on our Buy List portfolio. Also, if you sign up now, you can see our two recent reports. “Your Handy Guide to Stock Orders” tells you about all the different types of stock orders investors can place. Also, there’s “How Not to Get Screwed on Your Mortgage.” Join us today!
Posted by Eddy Elfenbein on July 20th, 2021 at 7:11 pm
The information in this blog post represents my own opinions and does not contain a recommendation for any particular security or investment. I or my affiliates may hold positions or other interests in securities mentioned in the Blog, please see my Disclaimer page for my full disclaimer.
-
Archives
- April 2026
- March 2026
- February 2026
- January 2026
- December 2025
- November 2025
- October 2025
- September 2025
- August 2025
- July 2025
- June 2025
- May 2025
- April 2025
- March 2025
- February 2025
- January 2025
- December 2024
- November 2024
- October 2024
- September 2024
- August 2024
- July 2024
- June 2024
- May 2024
- April 2024
- March 2024
- February 2024
- January 2024
- December 2023
- November 2023
- October 2023
- September 2023
- August 2023
- July 2023
- June 2023
- May 2023
- April 2023
- March 2023
- February 2023
- January 2023
- December 2022
- November 2022
- October 2022
- September 2022
- August 2022
- July 2022
- June 2022
- May 2022
- April 2022
- March 2022
- February 2022
- January 2022
- December 2021
- November 2021
- October 2021
- September 2021
- August 2021
- July 2021
- June 2021
- May 2021
- April 2021
- March 2021
- February 2021
- January 2021
- December 2020
- November 2020
- October 2020
- September 2020
- August 2020
- July 2020
- June 2020
- May 2020
- April 2020
- March 2020
- February 2020
- January 2020
- December 2019
- November 2019
- October 2019
- September 2019
- August 2019
- July 2019
- June 2019
- May 2019
- April 2019
- March 2019
- February 2019
- January 2019
- December 2018
- November 2018
- October 2018
- September 2018
- August 2018
- July 2018
- June 2018
- May 2018
- April 2018
- March 2018
- February 2018
- January 2018
- December 2017
- November 2017
- October 2017
- September 2017
- August 2017
- July 2017
- June 2017
- May 2017
- April 2017
- March 2017
- February 2017
- January 2017
- December 2016
- November 2016
- October 2016
- September 2016
- August 2016
- July 2016
- June 2016
- May 2016
- April 2016
- March 2016
- February 2016
- January 2016
- December 2015
- November 2015
- October 2015
- September 2015
- August 2015
- July 2015
- June 2015
- May 2015
- April 2015
- March 2015
- February 2015
- January 2015
- December 2014
- November 2014
- October 2014
- September 2014
- August 2014
- July 2014
- June 2014
- May 2014
- April 2014
- March 2014
- February 2014
- January 2014
- December 2013
- November 2013
- October 2013
- September 2013
- August 2013
- July 2013
- June 2013
- May 2013
- April 2013
- March 2013
- February 2013
- January 2013
- December 2012
- November 2012
- October 2012
- September 2012
- August 2012
- July 2012
- June 2012
- May 2012
- April 2012
- March 2012
- February 2012
- January 2012
- December 2011
- November 2011
- October 2011
- September 2011
- August 2011
- July 2011
- June 2011
- May 2011
- April 2011
- March 2011
- February 2011
- January 2011
- December 2010
- November 2010
- October 2010
- September 2010
- August 2010
- July 2010
- June 2010
- May 2010
- April 2010
- March 2010
- February 2010
- January 2010
- December 2009
- November 2009
- October 2009
- September 2009
- August 2009
- July 2009
- June 2009
- May 2009
- April 2009
- March 2009
- February 2009
- January 2009
- December 2008
- November 2008
- October 2008
- September 2008
- August 2008
- July 2008
- June 2008
- May 2008
- April 2008
- March 2008
- February 2008
- January 2008
- December 2007
- November 2007
- October 2007
- September 2007
- August 2007
- July 2007
- June 2007
- May 2007
- April 2007
- March 2007
- February 2007
- January 2007
- December 2006
- November 2006
- October 2006
- September 2006
- August 2006
- July 2006
- June 2006
- May 2006
- April 2006
- March 2006
- February 2006
- January 2006
- December 2005
- November 2005
- October 2005
- September 2005
- August 2005
- July 2005
 Eddy Elfenbein is a Washington, DC-based speaker, portfolio manager and editor of the blog Crossing Wall Street. His