CWS Market Review – September 14, 2021
(This is the free version of CWS Market Review. If you like what you see, then please sign up for the premium newsletter for $20 per month or $200 for the whole year.)
The August Inflation Report
The August inflation report came out this morning, and the evidence tells us that inflation is cooling off. If this trend continues, then the Federal Reserve will have been vindicated and inflation was, indeed, transitory.
Let me caution you that we’re not out of the inflation woods just yet, but the numbers we got this morning are encouraging.
In the report, the Bureau of Labor Statistics said that consumer prices rose by 0.27% last month. That was below expectations. While that’s not ideal, it’s a lot better than the numbers we saw in the five prior months. In July, inflation rose by 0.47% and the month before that, it was up by 0.90%. These were some of the highest numbers we’ve seen in decades.
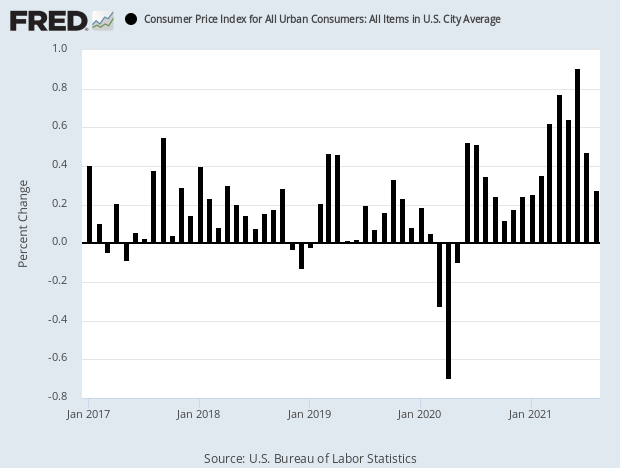
If we look at core inflation, which strips out volatile food and energy prices, then inflation was up just 0.10% last month. Compare that to June when core prices rose by 0.88% or to April when core inflation reached 0.92%. That was its highest rate in 40 years.
Over the trailing 12 months, the numbers are still unpleasant as they include the ugly April-to-July period. Over the last year, headline inflation was up 5.20% while core inflation increased by 3.98%. Expect these to gradually drift lower.
This has been a good reminder for investors that when in doubt, pay attention to the bond market. James Carville, President Clinton’s advisor, famously said that if he were to be reincarnated, he would want to come back as the bond market because “you can intimidate everybody.”
While we’ve seen scary headlines and some alarming data about inflation, the bond market has been indifferent. The yield on the 10-year Treasury peaked at 1.76% in February. It’s been trending down most of the time since. In fact, the scarier the headlines, the more the bond market has ignored it.
What does the inflation report mean for investors? Overall, this is good news for a few reasons. I still think it’s likely that the Federal Reserve will start to pare back its massive bond buying before the end of the year, but any rate hike is still a long way off. (By the way, the Fed meets again next week.)
I like to look at the futures market to see what traders think. Unlike economists, they have skin in the game. Even by July 2022, the futures market thinks there’s a 10% chance that the Fed will have raised rates by then. In other words, that’s 10 more months of 0% interest rates.
Stock Returns and Real Yields
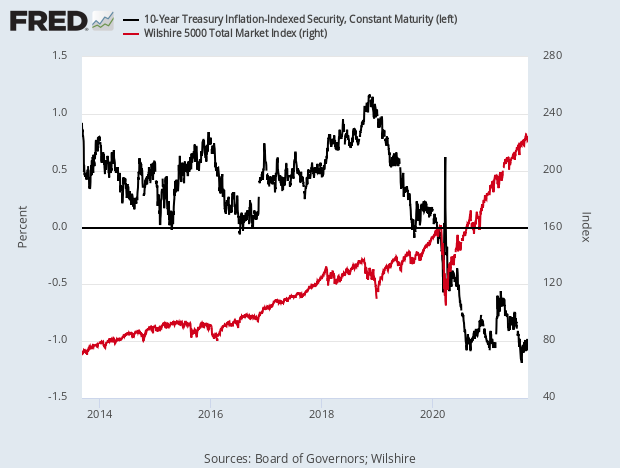
I’ve been particularly impressed by the very, VERY low yield on the 10-year TIPs. By this, I mean the yield on the “Treasury Inflation-Protected” bonds. It’s now at -1.05%. That’s the yield adjusted for inflation, also known as the real yield.
Tracking how the stock market performs relative to the real yield is very revealing. I suspect that this may become a more common topic in the future because the issue gets to the heart of stock valuation.
If someone says that the stock market is cheap or expensive, naturally you need to ask, compared to what? For judging stocks, the 10-year Treasury yield is a good starting place. The problem with looking at Treasury yields is that inflation can greatly impact them. That’s where the TIPs come in because these bond yields are adjusted for inflation.
Treasuries are, of course, less risky than stocks. So if real yields are going for 3% or 4%, it may make sense to ditch your stocks and hang out in bonds. Conversely, if real yields are low, or even negative, it’s like an open invitation to buy stocks.
What does the data have to say? I went to the St. Louis Fed’s economic database (an invaluable resource). I downloaded all the daily closings for the 10-year TIPs yield which goes back to 1983. I also downloaded all the daily total returns for the Wilshire 5000 stock index. That’s the broadest measure of the stock market.
I found that if you take all the days collectively when the 10-year TIPs has yielded 1.67% or higher, then you see that the stock market had a negative return. Stocks were a net money loser.
But when the TIPs yield has been 0.00% or lower, then the stock market has delivered an average return of more than 38% per year. This makes sense, but seeing the numbers is still surprising.
In short, the higher the TIPs yield, the worse it is for stocks. The lower the TIPs yield, the better it is for stocks. Nothing more complicated than that.
The TIPS tipping point seems to be at 0.5%. Anytime the yield on the 10-year TIPs is 0.5% or greater, then the stock market has delivered an annualized return of 5.1%. That’s probably less than the return of the TIPs bonds. But when the 10-year TIPs yield is under 0.5%, then the stock market has delivered an annualized return of 23.3%.
As I said before, the current yield on the 10-year TIPs is -1.05%. That isn’t just low – it’s close to as low as it’s ever been. The 10-year TIPs yield hasn’t been positive in 18 months. For now, the bond market is signaling more good news for stocks.
Stock Focus: Paycom Software
This week’s featured stock is Paycom Software (PAYC). Paycom’s job is to make your human-resources department more manageable. This isn’t so easy in the modern business climate. HR departments have to deal with lots of government regulations on top of needs specific to their industries. That’s not so difficult for a large corporation, but the HR requirements for a small start-up can be a major headache. That’s where Paycom comes in.
Paycom describes itself as a “leading provider of comprehensive, cloud-based human-capital management solutions delivered as software as a service.” The company makes and sells software that lets companies easily hire, manage, train, and most importantly, pay their employees. The advantage that Paycom brings is that its software centralizes the whole process.
For example, consider the process of finding a new employee. This is a major decision for any young company. Paycom can help with every step of the process. That includes tracking interviews and background checks.
Once a new employee joins up, there’s more paperwork to deal with. The employee has to make decisions regarding health insurance and retirement savings. On top of that, there’s on-board training. Paycom streamlines the entire process. This saves a company money, and, just as importantly, it saves time. Paycom currently has over 30,000 clients, and they’re very popular with their clients. The company’s annual retention rate consistently exceeds 90%.
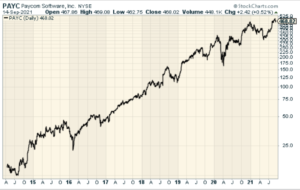
As this chart tells you, business has been good for Paycom:
Even after a new employee joins, Paycom still helps. Its software helps manage sick and vacation days as well as keeping track of training. Paycom provides functionality and data analytics that businesses need to manage the complete employment lifecycle, from recruitment to retirement.
Employees at customer firms love Paycom’s ease of use. Their software lets employees manage their own HR needs in the cloud, which reduces the administrative burden on employers and increases employee productivity.
This is a very lucrative sector. I project that Paycom’s earnings next year will be ten times what they were in 2015. This is one of the most innovative mid-cap stocks I can think of. You might assume that Paycom is another tech outfit based in Silicon Valley. Nope. Try Oklahoma City! But that shouldn’t be surprising. This is the world we live in today.
The company was founded in 1998, and it IPOed seven years ago. Paycom’s business has been growing at a rapid clip. Earnings-per-share jumped from 19 cents in 2014 to $3.49 last year. I think they’ll clear more than $4.40 per share this year and as much as $5.60 per share next year.

Last month, Paycom reported fiscal Q2 earnings of 97 cents per share. That topped estimates by 13 cents per share. Total revenues rose 33.3% to $242.1 million. Importantly, 98.1% of those revenues are recurring. That’s a very good sign.
Investors should also look at cash flow instead of focusing solely on earnings. For Q1, Paycom’s adjusted EBITDA, which is a measure of cash flow, came in at $87 million. That’s up from $61.2 million in the same period last year. Traders were impressed by the results. The stock jumped 11% after the earnings report.
Chad Richison, Paycom’s founder and CEO said, “The fundamentals of our business continue to strengthen, as demonstrated by our very strong second quarter results.”
For Q3, which ends in a little over two weeks, Paycom expects revenues between $249 million and $251 million, and EBITDA between $87 million and $89 million. For all of 2021, Paycom sees revenues of $1.036 billion to $1.038 billion, and EBITDA between $410 million to $412 million. The earnings report will be due out in early November.
I’ll caution you that Paycom is hardly a value stock, but its growth potential is very strong. Paycom is trading at 80 times my already optimistic forecast for next year.
This is an excellent company. I’m going to keep a close on eye it. If Paycom falls to $300 as it did this spring, it could be a welcome addition to our portfolio.
I’ll have more for you in the next issue of CWS Market Review.
– Eddy
P.S. If you haven’t had a chance, you can subscribe to our premium newsletter. It’s only $20 a month or $200 a year. Please join us!
Posted by Eddy Elfenbein on September 14th, 2021 at 7:17 pm
The information in this blog post represents my own opinions and does not contain a recommendation for any particular security or investment. I or my affiliates may hold positions or other interests in securities mentioned in the Blog, please see my Disclaimer page for my full disclaimer.
- Tweets by @EddyElfenbein
-
-
Archives
- April 2024
- March 2024
- February 2024
- January 2024
- December 2023
- November 2023
- October 2023
- September 2023
- August 2023
- July 2023
- June 2023
- May 2023
- April 2023
- March 2023
- February 2023
- January 2023
- December 2022
- November 2022
- October 2022
- September 2022
- August 2022
- July 2022
- June 2022
- May 2022
- April 2022
- March 2022
- February 2022
- January 2022
- December 2021
- November 2021
- October 2021
- September 2021
- August 2021
- July 2021
- June 2021
- May 2021
- April 2021
- March 2021
- February 2021
- January 2021
- December 2020
- November 2020
- October 2020
- September 2020
- August 2020
- July 2020
- June 2020
- May 2020
- April 2020
- March 2020
- February 2020
- January 2020
- December 2019
- November 2019
- October 2019
- September 2019
- August 2019
- July 2019
- June 2019
- May 2019
- April 2019
- March 2019
- February 2019
- January 2019
- December 2018
- November 2018
- October 2018
- September 2018
- August 2018
- July 2018
- June 2018
- May 2018
- April 2018
- March 2018
- February 2018
- January 2018
- December 2017
- November 2017
- October 2017
- September 2017
- August 2017
- July 2017
- June 2017
- May 2017
- April 2017
- March 2017
- February 2017
- January 2017
- December 2016
- November 2016
- October 2016
- September 2016
- August 2016
- July 2016
- June 2016
- May 2016
- April 2016
- March 2016
- February 2016
- January 2016
- December 2015
- November 2015
- October 2015
- September 2015
- August 2015
- July 2015
- June 2015
- May 2015
- April 2015
- March 2015
- February 2015
- January 2015
- December 2014
- November 2014
- October 2014
- September 2014
- August 2014
- July 2014
- June 2014
- May 2014
- April 2014
- March 2014
- February 2014
- January 2014
- December 2013
- November 2013
- October 2013
- September 2013
- August 2013
- July 2013
- June 2013
- May 2013
- April 2013
- March 2013
- February 2013
- January 2013
- December 2012
- November 2012
- October 2012
- September 2012
- August 2012
- July 2012
- June 2012
- May 2012
- April 2012
- March 2012
- February 2012
- January 2012
- December 2011
- November 2011
- October 2011
- September 2011
- August 2011
- July 2011
- June 2011
- May 2011
- April 2011
- March 2011
- February 2011
- January 2011
- December 2010
- November 2010
- October 2010
- September 2010
- August 2010
- July 2010
- June 2010
- May 2010
- April 2010
- March 2010
- February 2010
- January 2010
- December 2009
- November 2009
- October 2009
- September 2009
- August 2009
- July 2009
- June 2009
- May 2009
- April 2009
- March 2009
- February 2009
- January 2009
- December 2008
- November 2008
- October 2008
- September 2008
- August 2008
- July 2008
- June 2008
- May 2008
- April 2008
- March 2008
- February 2008
- January 2008
- December 2007
- November 2007
- October 2007
- September 2007
- August 2007
- July 2007
- June 2007
- May 2007
- April 2007
- March 2007
- February 2007
- January 2007
- December 2006
- November 2006
- October 2006
- September 2006
- August 2006
- July 2006
- June 2006
- May 2006
- April 2006
- March 2006
- February 2006
- January 2006
- December 2005
- November 2005
- October 2005
- September 2005
- August 2005
- July 2005
 Eddy Elfenbein is a Washington, DC-based speaker, portfolio manager and editor of the blog Crossing Wall Street. His