CWS Market Review – September 28, 2021
(This is the free version of CWS Market Review. If you like what you see, then please sign up for the premium newsletter for $20 per month or $200 for the whole year.)
The Fourth Quarter Beats the Other Three Quarters Combined
The third quarter is coming to an end. That’s good news, at least historically, for Wall Street bulls. Our friends at Bespoke Investment Group point out that the stock market has done better in the fourth quarter than the other three quarters combined. Over the last 20 years, the Dow has gained an average of 4.5% in Q4 compared with just 1.2% for the other three quarters combined.
My former colleague Gary Alexander notes that if we go back even further to 1950, the S&P 500 has gained 4.64% during the first nine months of the year and 3.95% in the final three months. Clearly, Q4 has been where all the action is.
What’s the reason for the strong late-year performance? That’s hard to say because it’s probably several variables working together like year-end pension funding and higher consumer sentiment near the holidays. For an odd twist, Q4 has been much stronger in odd-numbered years compared with even-numbered. Perhaps it’s that all the politics of election time holds back the market.
Speaking of which, the end of the third quarter also means the end of the government’s fiscal year. That brings us yet another battle over the debt ceiling and the government’s funding plans. I won’t go into the endless back and forth, but the politicians will eventually reach some sort of agreement.
The immediate effect of this has been a recent rise in bond yields. On Monday, the yield on the 10-year Treasury broke above 1.5%. Again, that’s a pretty low rate but consider that the 10-year was yielding 1.09% earlier this year. A little over a year ago, the 10-year would fetch you about 0.5%. In other words, investors were so unnerved during early Covid that they were willing to lend their money for 5%, for 10 years combined.
The yield on the two-year Treasury has crept up as well, and it recently broke above 0.3%. That’s up from 0.13% in early June. It’s odd that people are freaking out about micro rises in bond yields, but that’s how the bond market thinks. Here’s the chart that has people scared:
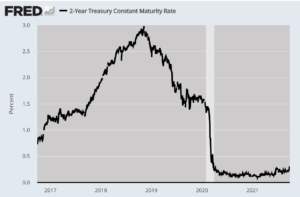
The two-year Treasury is interesting to watch because it’s considered to be one of the leading indicators of Fed policy. The futures market is currently split on whether the Fed will raise rates sometime in the next year. Personally, I’m a doubter but I like to keep an open mind.
Long-time readers will know that I’m a big fan of the 10/2 spread. This is simply the difference in the yield between the two-year and ten-year Treasuries. In a more just world, the 2/10 would have won a shelf full of Nobel prizes because it’s got a much better track record than just about anyone.
Lately, the 2/10 spread has narrowed, meaning that’s less optimistic for the future of the U.S. economy. In late March, the spread got up to 159 basis points. That was the highest in nearly six years. Indeed the 2/10 was right again—the U.S. economy was humming along. In fact, the biggest problem was finding enough workers.
But now the 2/10 is below 120 basis points. While that’s not a huge move, it does warrant some attention. Wall Street has been cutting back on their estimates for economic growth. In May, a survey of economists had been expecting Q3 economic growth of 6.6%. That’s now down to 4%.
The survey also showed that the fear of inflation is still with us. The economists expect the year-over-year inflation rate to hit 5.1% during Q4. In May, they had been expecting just 2.8%.
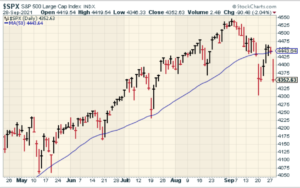
Breaking Down Today’s Loss
The stock market got pushed back today for a loss of just over 2%. This was the worst day for the market in four-and-a-half months. The Nasdaq had its worst day since March. For the numerologists among you, the Dow closed at 34,299.99. (I don’t know what that means but I assume it’s very important to some market watcher.)
It seems that the jitters we first saw last Monday are still with us. In particular, the hardest hit stocks today were the ones that had been doing very well. For example, Google (GOOG) and Microsoft (MSFT) were both down over 3.6% despite no important news impacting either company. It’s as if some traders decided that the hi-fliers had to be punished.
The damage is spreading. If we look at the S&P 500, 262 members of the index are now more than 10% below their 52-week high. The traditional definition of a market correction is when the entire market is 10% below its high. It’s almost like we’re having a stealth correction. In fact, sixty-seven stocks in the index are more than 20% off their high.
There are only two more trading days this month and it looks like the S&P 500 will have its worst month since last September. Even with today’s loss, the S&P 500 has notched 37 daily losses this year of more than 1%. Compare that to last year when we had 109 such days.
Stock Focus: RPM International
This week, I want to look at a former Buy List stock. I still like the company and it still has many of the characteristics that I look for. RPM International (RPM) is a seemingly dull stock, but once we dig below the surface, we see a very sound and profitable company. This may not be a household name, but it will be better known.
The name certainly isn’t very interesting, nor does it suggest what they do. RPM owns several subsidiaries, and the bulk of their business is focused on making high-performance specialty coatings, sealants and building materials. This is an important business, and it can be quite profitable.
Want proof? Check out RPM’s long-term stock chart:
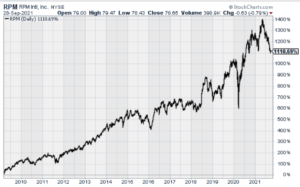
That’s up 12-fold in 12 years. I also like that RPM has increased its dividend every year since 1973. There aren’t many stocks that can boast a track record like that!
If it’s so great, why did we boot it from the Buy List? Well, that was a tough decision, but I think I made the right call. We had it on our Buy List for four years and rode it to a gain of nearly 70%, not including dividends. However, their business was slowing down and I thought that stock was too rich. It looks like I was right. Shares of RPM are currently down more than 13% this year. Of course, that makes it more attractive again.
I also wanted to highlight RPM because it’s reporting earnings next week and I’m not sure where I stand on the stock. More on that in a bit. Probably RPM’s best-known brand is Rust-Oleum. For the last fiscal year, RPM did over $6.1 billion in sales. The company currently has 15,500 employees who are spread across 26 countries. RPM has 156 manufacturing facilities. RPM is also the fifth-largest paint and coating company in the world.
Let’s look at some financials. In July, RPM reported fiscal Q4 earnings of $1.28 per share. That matched Wall Street’s estimate. This was for the three months ending on May 31. For the year, RPM increased its EPS from $3.87 to $4.16. That gives them a trailing P/E Ratio of 19, which isn’t particularly cheap. The company said it expected to see double-digit sales growth for Q4. They sold themselves short. RPM nearly hit 20% sales growth for the quarter.
For Q4, EPS grew by 13.3% and the company had record cash from operations of $766.2 million. That was driven by “margin improvements and good working capital management.”
Let’s break it down a little more. RPM’s business is divided into four groups. For Q4, Construction Products had a sales increase of 33.2%. Performance Coatings rose by 20.5%. The Consumer Group was up just 2.0%. Specialty Products, the smallest group, was the star as sales jumped 49.9%.
RPM is due to report its fiscal Q1 earnings next Wednesday, October 6. The company has really watered down its outlook. RPM said it expects sales growth in the “low- to mid-single digits.” That’s a lot lower than I expected. As I said, I’m glad we sold but I pay attention when good stocks hit a rough patch. Perhaps RPM is trying to manage expectations. That’s an old Wall Street game: talk down expectations and then act surprised when you “beat” them.
Wall Street expects RPM to report earnings of $1.03 per share. If RPM tops that significantly, then I’ll be very interested in adding them to the portfolio, especially if they provide optimistic guidance.
This is a time where I wish I could be more emphatic, but I simply can’t. RPM has the potential to be a good buy but all the pieces aren’t in place just yet.
I need to mention RPM’s amazing dividend track record. As I mentioned before, RPM has increased its dividend every year since 1973. The current quarterly dividend is for 38 cents per share. That works out to a dividend yield of just under 2%. I think we can expect to see dividend increase #48 come next week. Even in tough times, RPM is rewarding its shareholders. This is an excellent company that’s thriving in a difficult environment.
I’ll have more for you in the next issue of CWS Market Review.
– Eddy
P.S. If you haven’t had a chance, you can subscribe to our premium newsletter. It’s only $20 a month or $200 a year. Please join us!
Posted by Eddy Elfenbein on September 28th, 2021 at 7:54 pm
The information in this blog post represents my own opinions and does not contain a recommendation for any particular security or investment. I or my affiliates may hold positions or other interests in securities mentioned in the Blog, please see my Disclaimer page for my full disclaimer.
- Tweets by @EddyElfenbein
-
-
Archives
- May 2024
- April 2024
- March 2024
- February 2024
- January 2024
- December 2023
- November 2023
- October 2023
- September 2023
- August 2023
- July 2023
- June 2023
- May 2023
- April 2023
- March 2023
- February 2023
- January 2023
- December 2022
- November 2022
- October 2022
- September 2022
- August 2022
- July 2022
- June 2022
- May 2022
- April 2022
- March 2022
- February 2022
- January 2022
- December 2021
- November 2021
- October 2021
- September 2021
- August 2021
- July 2021
- June 2021
- May 2021
- April 2021
- March 2021
- February 2021
- January 2021
- December 2020
- November 2020
- October 2020
- September 2020
- August 2020
- July 2020
- June 2020
- May 2020
- April 2020
- March 2020
- February 2020
- January 2020
- December 2019
- November 2019
- October 2019
- September 2019
- August 2019
- July 2019
- June 2019
- May 2019
- April 2019
- March 2019
- February 2019
- January 2019
- December 2018
- November 2018
- October 2018
- September 2018
- August 2018
- July 2018
- June 2018
- May 2018
- April 2018
- March 2018
- February 2018
- January 2018
- December 2017
- November 2017
- October 2017
- September 2017
- August 2017
- July 2017
- June 2017
- May 2017
- April 2017
- March 2017
- February 2017
- January 2017
- December 2016
- November 2016
- October 2016
- September 2016
- August 2016
- July 2016
- June 2016
- May 2016
- April 2016
- March 2016
- February 2016
- January 2016
- December 2015
- November 2015
- October 2015
- September 2015
- August 2015
- July 2015
- June 2015
- May 2015
- April 2015
- March 2015
- February 2015
- January 2015
- December 2014
- November 2014
- October 2014
- September 2014
- August 2014
- July 2014
- June 2014
- May 2014
- April 2014
- March 2014
- February 2014
- January 2014
- December 2013
- November 2013
- October 2013
- September 2013
- August 2013
- July 2013
- June 2013
- May 2013
- April 2013
- March 2013
- February 2013
- January 2013
- December 2012
- November 2012
- October 2012
- September 2012
- August 2012
- July 2012
- June 2012
- May 2012
- April 2012
- March 2012
- February 2012
- January 2012
- December 2011
- November 2011
- October 2011
- September 2011
- August 2011
- July 2011
- June 2011
- May 2011
- April 2011
- March 2011
- February 2011
- January 2011
- December 2010
- November 2010
- October 2010
- September 2010
- August 2010
- July 2010
- June 2010
- May 2010
- April 2010
- March 2010
- February 2010
- January 2010
- December 2009
- November 2009
- October 2009
- September 2009
- August 2009
- July 2009
- June 2009
- May 2009
- April 2009
- March 2009
- February 2009
- January 2009
- December 2008
- November 2008
- October 2008
- September 2008
- August 2008
- July 2008
- June 2008
- May 2008
- April 2008
- March 2008
- February 2008
- January 2008
- December 2007
- November 2007
- October 2007
- September 2007
- August 2007
- July 2007
- June 2007
- May 2007
- April 2007
- March 2007
- February 2007
- January 2007
- December 2006
- November 2006
- October 2006
- September 2006
- August 2006
- July 2006
- June 2006
- May 2006
- April 2006
- March 2006
- February 2006
- January 2006
- December 2005
- November 2005
- October 2005
- September 2005
- August 2005
- July 2005
 Eddy Elfenbein is a Washington, DC-based speaker, portfolio manager and editor of the blog Crossing Wall Street. His