CWS Market Review – January 4, 2022
(This is the free version of CWS Market Review. If you like what you see, then please sign up for the premium newsletter for $20 per month or $200 for the whole year. If you sign up today, you can see our two reports, “Your Handy Guide to Stock Orders” and “How Not to Get Screwed on Your Mortgage.”)
I hope everyone had a festive holiday season. Now with the new year, here’s our 2022 Buy List.
The Buy List got off to a rocky start yesterday. Some of the diagnostic stocks got pinged but the Buy List did much better today. I’m glad to see that some of our new stocks are doing well.
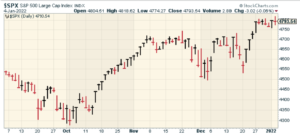
The S&P 500 got to a new all-time intra-day high today. The index traded as high as 4,818.62, although it finished the day down slightly.
The Dow was able to close at a record high. One other highlight to note: Yesterday, Apple (AAPL) became the first $3 trillion company. That’s 16.81 billion shares going for $182.
On the economic front, this morning’s ISM Manufacturing Index showed a small slowdown last month. For December, the index dropped to 58.7. That’s still a decent number but it’s down from November’s reading of 61.1.
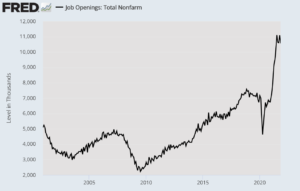
The truly eye-catching news came from the Labor Department this morning. According to the government’s numbers, the Great Resignation continues. For the first time in a long time, workers have the upper hand.
During November, 4.5 million Americans quit their jobs. That’s an all-time record, and it’s an 8.9% increase over the number for October. There are now 10.56 million job openings across the country. According to the last jobs report, there are 6.88 million Americans who are out of work and looking for a job. This is a truly fascinating crossroads for the economy. There simply aren’t enough workers to go around. The real supply-chain issue is apparently in the jobs market.
We’ll learn a lot more about the state of the jobs market this week. Tomorrow, ADP will release its payroll report for December. While it’s an interesting report, it’s from the private sector and it doesn’t always align well with the official numbers from the government.
Also tomorrow, we’ll get a look at the minutes from the Federal Reserve’s last meeting. If you recall, this was the meeting where the Fed decided to accelerate its tapering policies.
On Thursday, we’ll get another jobless-claims report. We’re still very close to 52-year lows for jobless claims. Then on Friday, the jobs report for December is due out. In the last report, the unemployment rate was 4.2%. Wall Street is expecting that to tick down to 4.1%. If that were to happen, it would be lower than almost all the job reports from the 1970s, 80s and 90s. For nonfarm payrolls, Wall Street expects an increase of 422,000. I’ll also be curious what the wage numbers are. While wage growth has perked up, much of that increase is being eaten up by inflation.
Why I Decided to Pass on AmerisourceBergen
Today I wanted to discuss the company AmerisourceBergen (ABC). There’s a lot I like about ABC, and I strongly considered adding it to this year’s list, but I ultimately decided against it. I thought my decision would be a good lesson to share because so much of investing comes down to what you choose not to do.
There’s a lot to like about AmerisourceBergen. If you’re not familiar with the company, ABC is a major drug wholesaler. The company was formed 20 years ago through the merger of Bergen Brunswig and AmeriSource. They also have units offering consulting services and veterinary supply.
It’s a great business to be in. I especially like their smooth earnings line. This is an important characteristic in a successful company. Some businesses see their earnings bounce all around during a business cycle. Other stocks, by contrast, churn out steady increases. All things being equal, the market prefers the steady increases.
Here’s a brief thought exercise. Imagine two stocks that are similar in every way. Both are expected to earn $1 per share next year. Stock A is expected to earn $1 per share, plus or minus two cents while Stock B is expected to earn $1 per share, plus or minus 20 cents.
Which stock will have a higher share price? Nearly every time Stock A will command a higher share price. Why is this? It’s because the market values reliability, even if the expected cash flows are the same. The premium which Stock A will command will fluctuate depending on the market’s mood and its appetite for risk.
In the eyes of the market, earnings misses are not symmetrical. A negative surprise weighs more heavily than the pleasantness of a positive surprise. The market loves certainty and it doesn’t mind paying a little extra for that.
Now let’s get back to AmerisourceBergen. Here’s a chart from Fast Graphs.

The black line is ABC’s share price. The orangish line is its earnings-per-share. The white line is the dividends. The EPS line is scaled to follow a P/E Ratio of 15. Just by looking at the chart, you can see that ABC far from excessively priced. The stock has often traded above a P/E of 15.
ABC’s fiscal year ends in September. The company reported Q4 earnings in early November. For the quarter, ABC earned $2.39 per share which was three cents better than estimates. The company also sweetened its dividend by 4.5%. For the year, ABC made $9.26 per share. That was a nice increase over the $7.90 per share they made in the year before that.
This is what we like to see, nice and steady EPS increases:
2017: $5.62
2018: $5.88
2019: $6.49
2020: $7.09
2021: $7.90
2021: $9.26
2022: $10.68 (est.)
2023: $11.45 (est.)
2024: $12.25 (est.)
Of course, the estimates are merely guesses but they’re pretty consistent with the larger earnings trend. Predicting the future earnings for ABC isn’t a terribly hard job. Just add 10% or so to the previous year and you’re likely to be in the ballpark. Investors love the consistency.
Yesterday, shares of ABC closed at $132.62. That means ABC is going for less than 11 times 2024’s estimate. In other words, ABC is a profitable stock going for a reasonable valuation. But here’s where blindly following the numbers can lead you astray.
The reason is that AmerisourceBergen faces significant legal risks for its role in the opioid epidemic. Over a 20-year period, nearly half a million Americans died from opioid addiction. For purposes of today’s discussion, I’m not going to address ABC’s role or culpability in the opioid crisis. I merely want to address that these issues can impact a stock’s valuation. All we need to know is that a lot of people inside the government hold AmerisourceBergen partly responsible for the crisis.
In July, AmerisourceBergen and two other drug companies, Cardinal Health and McKesson, reached a major settlement with several state governments. The deal calls for the drug companies to pay $21 billion over the next 18 years. ABC’s portion comes to $6.4 billion.
The deal is intended to address, in one big action, more than 3,000 lawsuits. I don’t know if this will be the end of the matter for ABC. Just this week, a jury found that Teva Pharmaceuticals, an opioid manufacturer and distributor, contributed to the opioid crisis.
The lesson here is that simply appearing to be a value stock doesn’t mean a stock is a good value. As investors, we have to dig deeper than what the numbers say.
Ultimately, I decided to let ABC go. It’s a profitable company but there are too many unknowns. The simple truth is that most good investing is boring. It’s not worth it to gamble on what lawsuits may come next. With investing, we want to remove as much of the guesswork as possible.
Now let’s look at some of the mysteries of the Dow’s calendar cycle.
The Dow’s Calendar Cycle
At the end of each year, I update dozens of data files I keep on the market. I have one file that contains the entire history of the Dow Jones Industrial Average, going back to its founding in 1896.
I’ve spliced the data a number of different ways to see how the Dow has performed under different cycles. For example, here’s a remarkable stat: If you had invested in the Dow only on Thursdays, since September 1987, you would have a combined loss of 7%.
That’s more than 1,740 trading days which is nearly the equivalent of seven years, and a Thursdays-only strategy would have yielded you nothing. Over that time, the Dow gained more than 1,300%. Of course, investing on a single day each week is wholly impractical, but it shines a light on the sometimes bizarre and often surprising behavior of financial markets.
If we play with the numbers a little more, we see that investing in the Dow on only Thursdays and Fridays over the last 34 years has generated a gain of just 3.3%. Meanwhile, the gain for Mondays, Tuesdays and Wednesdays comes to nearly 1,250%.
What possible explanation could there be? Beats me. Perhaps if you slice and dice numbers long enough, you’re bound to see something unusual. Maybe we’re truly being fooled by nothing more than randomness.
To me, the most interesting calendar effect is the monthly cycle. Nearly all of the markets’ gains have come during the first six days of the month. Here’s what the historical average month looks like:
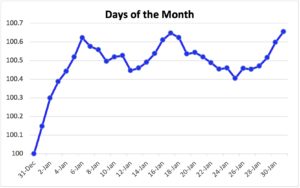
After the sixth calendar day of the month, the Dow has basically been flat. Bear in mind that this is the average of 125 years’ worth of data.
I don’t advocate any trading strategy based on this. I merely find it interesting. As Isaac Newton once said, “I can calculate the motion of heavenly bodies, but not the madness of people.”
That’s all for now. I’ll have more for you in the next issue of CWS Market Review.
– Eddy
Posted by Eddy Elfenbein on January 4th, 2022 at 7:05 pm
The information in this blog post represents my own opinions and does not contain a recommendation for any particular security or investment. I or my affiliates may hold positions or other interests in securities mentioned in the Blog, please see my Disclaimer page for my full disclaimer.
- Tweets by @EddyElfenbein
-
-
Archives
- May 2024
- April 2024
- March 2024
- February 2024
- January 2024
- December 2023
- November 2023
- October 2023
- September 2023
- August 2023
- July 2023
- June 2023
- May 2023
- April 2023
- March 2023
- February 2023
- January 2023
- December 2022
- November 2022
- October 2022
- September 2022
- August 2022
- July 2022
- June 2022
- May 2022
- April 2022
- March 2022
- February 2022
- January 2022
- December 2021
- November 2021
- October 2021
- September 2021
- August 2021
- July 2021
- June 2021
- May 2021
- April 2021
- March 2021
- February 2021
- January 2021
- December 2020
- November 2020
- October 2020
- September 2020
- August 2020
- July 2020
- June 2020
- May 2020
- April 2020
- March 2020
- February 2020
- January 2020
- December 2019
- November 2019
- October 2019
- September 2019
- August 2019
- July 2019
- June 2019
- May 2019
- April 2019
- March 2019
- February 2019
- January 2019
- December 2018
- November 2018
- October 2018
- September 2018
- August 2018
- July 2018
- June 2018
- May 2018
- April 2018
- March 2018
- February 2018
- January 2018
- December 2017
- November 2017
- October 2017
- September 2017
- August 2017
- July 2017
- June 2017
- May 2017
- April 2017
- March 2017
- February 2017
- January 2017
- December 2016
- November 2016
- October 2016
- September 2016
- August 2016
- July 2016
- June 2016
- May 2016
- April 2016
- March 2016
- February 2016
- January 2016
- December 2015
- November 2015
- October 2015
- September 2015
- August 2015
- July 2015
- June 2015
- May 2015
- April 2015
- March 2015
- February 2015
- January 2015
- December 2014
- November 2014
- October 2014
- September 2014
- August 2014
- July 2014
- June 2014
- May 2014
- April 2014
- March 2014
- February 2014
- January 2014
- December 2013
- November 2013
- October 2013
- September 2013
- August 2013
- July 2013
- June 2013
- May 2013
- April 2013
- March 2013
- February 2013
- January 2013
- December 2012
- November 2012
- October 2012
- September 2012
- August 2012
- July 2012
- June 2012
- May 2012
- April 2012
- March 2012
- February 2012
- January 2012
- December 2011
- November 2011
- October 2011
- September 2011
- August 2011
- July 2011
- June 2011
- May 2011
- April 2011
- March 2011
- February 2011
- January 2011
- December 2010
- November 2010
- October 2010
- September 2010
- August 2010
- July 2010
- June 2010
- May 2010
- April 2010
- March 2010
- February 2010
- January 2010
- December 2009
- November 2009
- October 2009
- September 2009
- August 2009
- July 2009
- June 2009
- May 2009
- April 2009
- March 2009
- February 2009
- January 2009
- December 2008
- November 2008
- October 2008
- September 2008
- August 2008
- July 2008
- June 2008
- May 2008
- April 2008
- March 2008
- February 2008
- January 2008
- December 2007
- November 2007
- October 2007
- September 2007
- August 2007
- July 2007
- June 2007
- May 2007
- April 2007
- March 2007
- February 2007
- January 2007
- December 2006
- November 2006
- October 2006
- September 2006
- August 2006
- July 2006
- June 2006
- May 2006
- April 2006
- March 2006
- February 2006
- January 2006
- December 2005
- November 2005
- October 2005
- September 2005
- August 2005
- July 2005
 Eddy Elfenbein is a Washington, DC-based speaker, portfolio manager and editor of the blog Crossing Wall Street. His