CWS Market Review – March 15, 2022
An Historically Bad Start to the Year
Yesterday was the 48th trading day of this year. So far, this year ranks as the fourth-worst start to the year on record for the S&P 500 through 48 trading days. Some of that can be blamed on the calendar since the market peaked on the first trading of the year.
Late yesterday, we came close to making a new closing low for the year, but a late-day rally helped us miss that by a whisker. The current low came one week ago, on March 8, when the S&P 500 closed at 4,170.70. I think there’s a good chance we’ll break below that soon.
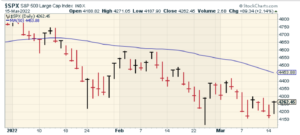
What leads me to say that? The key to watch is the 50-day moving average (the blue line). This is simply the average of the S&P 500 over the last 50 days. It’s a quick and easy way of measuring the market’s momentum. Whenever the index is below its 50-DMA, as it is now, that usually means it’s a difficult market.
The stock market tends to be trend-sensitive. By that, I mean that good markets usually lead to good markets, and bad markets often to lead to more bad markets. I know that sounds obviously true, but there’s a lot of fancy math behind it. The turning points are important. This is why the 50-DMA has a decent track record. I like to call it, “the dumb rule that works well for very smart reasons.”
Another important aspect of the stock market being below its 50-DMA is that volatility tends to be much higher. For example, In the last 23 trading sessions, the S&P 500 has only had one daily gain of less than 1%. There have been lots of big up days and lots of big down days, but not many mildly good days.
Historically, most of the best and worst daily moves have come when the S&P 500 is under its 50-DMA. One of the oddities of the stock market is that so many great days have come during awful markets. Most people have it backward: it’s not that volatility causes bear markets; it’s just that bear markets are more volatile.
Volatility is not like some gremlin that sits above the market and then swoops in to cause mayhem. Instead, it’s part of the market. When prices go down, markets get jittery.
Speaking of which, today is the 89th anniversary of the Dow’s best day ever. The markets had reopened after FDR announced a four-day bank holiday. Back then, the new president was sworn in on March 4. The time off worked. The Dow soared an astounding 8.26 points. That’s peanuts today, but in 1933 it was a gain of 15.34%. In today’s terms that would be a gain of roughly 5,000 points. That record stands today.
Tomorrow is the second anniversary of the Dow’s second-biggest loss ever. The index fell 12.93% for a loss of 3,000 points. Only the 1987 crash was worse. The market plunge two years ago even eclipsed the worst one-day losses in 1929. People were definitely scared two years ago but it was a great time to invest. The Dow is up 60% since then.
A few days later, on March 18, hedge fund manager Bill Ackman went on CNBC and implored President Trump to shut down the economy. Ackman said, “America will end as we know it” unless we “completely close down the economy. Shut it down for 30 days. Hell is coming.”
Scary stuff, but Ackman was completely wrong. The market reached its low a few days later.
Obviously, the events in Ukraine are on our minds. We’re also witnessing the effects in financial markets. Last week, the price for oil shot up to $130 per barrel. Not surprisingly, some oil producers want to ramp up production. Thanks to that, or to the promise of more oil, the price has backed down. Oil is currently around $95 per barrel.
According to the latest data, prices at the pump have topped off for now. At least they’re no longer soaring. I’m sure we’ll see the impact in upcoming CPI reports. Inflation is many things, but it’s not transitory. Get used to seeing more of it.
The Fed to Raise Rates
The Federal Reserve started its two-day meeting today. The policy statement is due out tomorrow afternoon and Chairman Powell will hold a post-meeting press conference. We can almost certainly expect the Fed to announce its first interest rate increase in more than three years.
It was almost exactly two years ago that the Fed lowered rates to the floor. While the rate increase may get a lot of attention, bear in mind that it will probably be an increase of just 0.25%. The Fed is still a long way from impinging on the economy. Real interest rates, meaning adjusted for inflation, are still well into negative territory.
The Fed has a tough job right now because inflation is attacking us on three different fronts. One, naturally, is the commodity surge from the invasion of Ukraine. There’s also the supply-chain crisis. Lastly, there’s the fact that the government has thrown tons of money at the economy. The Fed isn’t responsible for all of them. Still, I wouldn’t be surprised to see inflation soon hit 10% on a trailing 12-month basis.
The sanctions taken against Russia are starting to have a major impact. The ruble has fallen off a cliff and the country is nearing a default. The country hasn’t had a foreign currency default since 1917. Tomorrow, the government needs to pay $117 million to bond holders. The country is supposed to pay in dollars, but at this hour, it’s not clear what the Russians will pay in. Maybe yuan. Maybe euros. Who knows?
Between the Russian government and its major oil corporations, the country has $150 billion in foreign currency debt. In 1998, Russia defaulted on some ruble-denominated debt.
There’s an old saying that if you owe the bank $100, then you have a problem. If you owe the bank $1 million, then the bank has a problem. While many Russia-based firms may soon be unable to pay their bills, we’ll soon learn who in the West isn’t getting paid.
Risk Is Returning
One of the keys to understanding the current market is how the Fed behaved once Covid struck. The Fed responded to Covid in the way it should have responded to the financial crisis. If you recall, in the financial crisis, the Fed dithered for some time before it realized the extent of the problem. Ben Bernanke thought it was an issue that was contained to sub-prime mortgages. Well, it wasn’t.
Once the reality of Covid became clear, however, the Fed threw everything it had to keep the economy afloat. The important aspect for investors is that the Fed radically reduced market risk for investors. That led to an enormous boom in more speculative stocks. What do Price/Earnings Ratios matter when interest rates are on the floor?
Check out this chart which compares the S&P 500 High Beta Index (black) with the S&P 500 Low Vol Index (blue). This covers from the market low of two years ago until this past November.
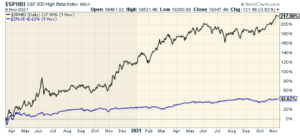
Low vol stocks did well, but high beta stocks tripled! It’s important to understand that the Fed’s policies caused this to happen. In a normal market, investors would be alarmed by a highly volatile stock’s market risk. But for 20 months, that didn’t exist. As a result, high beta soared.
Now, it’s payback time. Rates are going higher and the market’s focus is changing. Since November, low volatility stocks have been back in favor. This trend will probably last for several months. Now let’s take a closer look at one of my favorite low vol stocks.
Stock Focus: Silgan Holdings
This week, I wanted to highlight Silgan Holdings (SLGN), which is one of our favorite conservative stocks from our Buy List. Silgan is one of the leading makers of metal containers in the world. Boring, sure, but it’s also a very good business. By my count, Silgan has increased its earnings in 16 of the last 18 years.
In January, Silgan said that it had Q4 earnings of 79 cents per share. Wall Street had been expecting 73 cents per share. For its part, the company said that Q4 earnings would be between 69 to 79 cents per share.
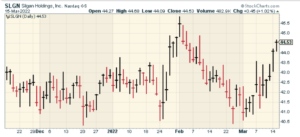
For 2021, Silgan made $3.40 per share. That’s up 11% from 2020. Sales were up 17.3%. Silgan had record free cash flow of $466.1 million. Best of all, the company expects another good year for 2022.
The CEO said, “we estimate adjusted earnings per share in 2022 in the range of $3.80 to $4.00, which represents a 15 percent increase at the midpoint over record 2021 levels. Our free cash flow estimate for 2022 is estimated at approximately $350 million.”
Silgan closed today at $44.53 per share. This means that Silgan is going for less than 12 times this year’s earnings. For Q1, Silgan expects earnings to range between 80 and 90 cents per share. The next earnings report should be due out next month.
If you want to learn more about Silgan and the other stocks on our Buy List, please sign up for our premium service.
That’s all for now. I’ll have more for you in the next issue of CWS Market Review.
– Eddy
Posted by Eddy Elfenbein on March 15th, 2022 at 7:44 pm
The information in this blog post represents my own opinions and does not contain a recommendation for any particular security or investment. I or my affiliates may hold positions or other interests in securities mentioned in the Blog, please see my Disclaimer page for my full disclaimer.
- Tweets by @EddyElfenbein
-
-
Archives
- May 2024
- April 2024
- March 2024
- February 2024
- January 2024
- December 2023
- November 2023
- October 2023
- September 2023
- August 2023
- July 2023
- June 2023
- May 2023
- April 2023
- March 2023
- February 2023
- January 2023
- December 2022
- November 2022
- October 2022
- September 2022
- August 2022
- July 2022
- June 2022
- May 2022
- April 2022
- March 2022
- February 2022
- January 2022
- December 2021
- November 2021
- October 2021
- September 2021
- August 2021
- July 2021
- June 2021
- May 2021
- April 2021
- March 2021
- February 2021
- January 2021
- December 2020
- November 2020
- October 2020
- September 2020
- August 2020
- July 2020
- June 2020
- May 2020
- April 2020
- March 2020
- February 2020
- January 2020
- December 2019
- November 2019
- October 2019
- September 2019
- August 2019
- July 2019
- June 2019
- May 2019
- April 2019
- March 2019
- February 2019
- January 2019
- December 2018
- November 2018
- October 2018
- September 2018
- August 2018
- July 2018
- June 2018
- May 2018
- April 2018
- March 2018
- February 2018
- January 2018
- December 2017
- November 2017
- October 2017
- September 2017
- August 2017
- July 2017
- June 2017
- May 2017
- April 2017
- March 2017
- February 2017
- January 2017
- December 2016
- November 2016
- October 2016
- September 2016
- August 2016
- July 2016
- June 2016
- May 2016
- April 2016
- March 2016
- February 2016
- January 2016
- December 2015
- November 2015
- October 2015
- September 2015
- August 2015
- July 2015
- June 2015
- May 2015
- April 2015
- March 2015
- February 2015
- January 2015
- December 2014
- November 2014
- October 2014
- September 2014
- August 2014
- July 2014
- June 2014
- May 2014
- April 2014
- March 2014
- February 2014
- January 2014
- December 2013
- November 2013
- October 2013
- September 2013
- August 2013
- July 2013
- June 2013
- May 2013
- April 2013
- March 2013
- February 2013
- January 2013
- December 2012
- November 2012
- October 2012
- September 2012
- August 2012
- July 2012
- June 2012
- May 2012
- April 2012
- March 2012
- February 2012
- January 2012
- December 2011
- November 2011
- October 2011
- September 2011
- August 2011
- July 2011
- June 2011
- May 2011
- April 2011
- March 2011
- February 2011
- January 2011
- December 2010
- November 2010
- October 2010
- September 2010
- August 2010
- July 2010
- June 2010
- May 2010
- April 2010
- March 2010
- February 2010
- January 2010
- December 2009
- November 2009
- October 2009
- September 2009
- August 2009
- July 2009
- June 2009
- May 2009
- April 2009
- March 2009
- February 2009
- January 2009
- December 2008
- November 2008
- October 2008
- September 2008
- August 2008
- July 2008
- June 2008
- May 2008
- April 2008
- March 2008
- February 2008
- January 2008
- December 2007
- November 2007
- October 2007
- September 2007
- August 2007
- July 2007
- June 2007
- May 2007
- April 2007
- March 2007
- February 2007
- January 2007
- December 2006
- November 2006
- October 2006
- September 2006
- August 2006
- July 2006
- June 2006
- May 2006
- April 2006
- March 2006
- February 2006
- January 2006
- December 2005
- November 2005
- October 2005
- September 2005
- August 2005
- July 2005
 Eddy Elfenbein is a Washington, DC-based speaker, portfolio manager and editor of the blog Crossing Wall Street. His