CWS Market Review – July 5, 2022
(This is the free version of CWS Market Review. If you like what you see, then please sign up for the premium newsletter for $20 per month or $200 for the whole year. If you sign up today, you can see our two reports, “Your Handy Guide to Stock Orders” and “How Not to Get Screwed on Your Mortgage.”)
The Latest Bear-Market Rally Is Fizzling
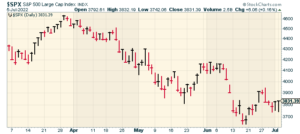
The stock market staged an impressive comeback today. At one point, the S&P 500 was down by 2.18%, but by the closing bell, the index was in the black by 0.16%.
I’m pleased to see the gain, but I don’t exactly feel a sense of relief. We came very close to ending down for the fifth time in six days. There’s a strong sense that the latest bear-market rally has run its course.
As we know, bear markets love to tease us with these brief rallies. Once you think the coast is clear, then the bear returns to flatten stock prices. But it’s true that we avoided that today. At least, at the end.
But we did see a familiar theme: economic cyclical stocks fell the most, while defensive stocks fell the least. Here’s a look at how the S&P 500 sectors performed today. The cyclical sectors are in red:
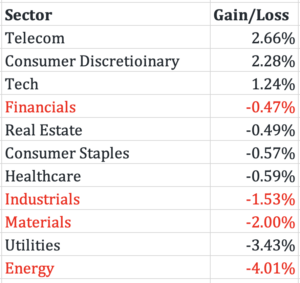
Notice how the cyclicals are at or near the bottom. This is Wall Street’s way of saying that the odds of a recession have increased. While the hard data pointing toward a recession is thin right now, we’ll learn a lot more this Friday when the government releases its latest jobs report.
I assume Friday’s report will show that the jobs report is still doing well, but we’re in an odd position right now. The stock market just wrapped up its worst start to a year in over 52 years, yet the jobs market has a chance of reporting the lowest unemployment rate in 53 years.
In plainer English, the economic news is good, but everyone is miserable. I’m exaggerating, but not by much.
For now, my take is that people are wildly overstating the odds of a recession right now, but for 2023, a recession is a very real possibility.
For the record, the unemployment rate for February 2020, just before our world was upended thanks to Covid, was 3.47%, which was its lowest since May 1969. The unemployment rate for May 2022 was 3.62%, so we’re not that far from another multi-decade low.
By the way, I want to address a technical note. Before, we heard a lot about how people were fleeing the job market to retire early and how labor force participation had plunged. Now that story is changing. Once you adjust the labor force participation rate for prime working-age folks (25 to 55), then you’ll see that many folks are still in the labor force.
Tomorrow, we’ll get the report on job openings and quits. The amount of job openings has greatly outpaced the number of unemployed people. Also on Wednesday, will get to see the minutes of the last Fed meeting. That was when the FOMC decided to raise interest rates by 0.75%. That was the largest increase from the Fed in nearly 30 years. Traders are convinced that another 0.75 hike is coming in three weeks and I think they’re right.
While it may sound unusual that stocks are doing poorly when the jobs market has been strong, it’s actually quite common. Historically, the stock market has performed much better when unemployment is high compared to when it’s low. The important point for investors to understand is that the stock market tries to look forward six to nine months while most of the economic reports tell us what already happened a few months ago.
Bloomberg Says There’s a 38% Chance of a Recession
Trying to predict a recession is a tough game. Bloomberg has a model that tries to tell us the odds of a recession. Their model now says that the odds of a recession in the next 12 months have jumped to 38%.
Bloomberg’s model includes financial indicators like credit spreads, but it also noted that:
Americans’ views of future business conditions sharply deteriorated in June. Each month the University of Michigan releases a closely watched survey of consumer sentiment. The June report not only showed a collapse in consumer sentiment to a record low but also a big decline in a gauge of the expected change in business conditions in a year. At 76, that figure is now at one of its lowest readings in records back to 1978.
The Atlanta Fed has a model, GDPNow, which tries to predict the next GDP report. For the Q2, the model currently sees growth of -2.1%. If that’s right, it would be the second quarter in a row of falling GDP. For Q1, the U.S. economy contracted at -1.6% annualized rate.
You often hear that a recession is two or more quarters in a row of negative growth. That’s not technically correct. The official definition from the National Bureau of Economic Research (NBER), which is widely regarded as the official recession-dating committee, is more complex so it’s very likely that we aren’t in an official recession.
One of the best indicators of a recession is the 2/10 Spread. I write about this a lot. I’ve often said that the 2/10 has a better track record in predicting recessions than a lot of Nobel Prize winners do.
The spread between the 2- and 10-year Treasury yields briefly went negative in April, and it happened again today. Earlier today, the two-year yield got to 2.792% while the 10-year was at 2.789%. To give you an idea of how much things have changed, 15 months ago, the 2/10 Spread was nearly 160 basis points.
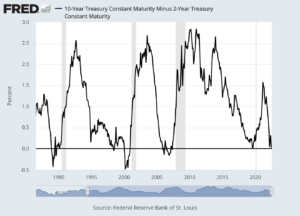
A lot of this is due to the Fed raising rates (causing a higher 2-year yield) and a slowing economy (causing a lower 10-year yield). I want to be clear that a negative 2/10 Spread isn’t like walking into a room and turning out the lights. Instead, it’s more like playing basketball with a hoop that gradually gets lower the longer your play. The dynamics of the game change. That’s why a negative 2/10 precedes a recession by six months, or even up to two years.
It’s not only in the credit markets that we’re seeing negative signs. Last week, the ISM Manufacturing Index came in at 53.0. That’s down from 56.1 in May. It was also its lowest reading in two years. Any number above 50 means the factory sector of the economy is expanding, and below 50 means it’s contracting. We’re still in the safe zone, for now, but the overall picture is deteriorating.
But I want to get back to the rotation we’re seeing in the stock market. Sectors like Energy and Materials have been lagging badly over the last few weeks. I suspect that this underperformance will continue. The price for oil recently plunged below $100 per barrel. Citigroup said that oil could fall as low as $65 this year.
The best areas of the market have been defensive areas like consumer staples, healthcare and high-yielding stocks. This has also been a big benefit for our Buy List. During Q2, our Buy List outperformed the S&P 500 by 4.3%.
Here’s an important chart but it needs a little explanation. This is the S&P 500 Materials index divided by the S&P 500 (red), and the S&P 500 Consumer Staples divided by the S&P 500 (blue). In other words, it’s the relative performance of materials and staples.
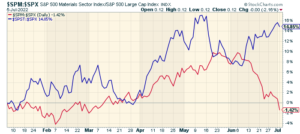
The two lines were moving together somewhat until early June. After that, they diverged sharply — staples leading and materials lagging. Whenever those two lines diverge like that, it means the market is focused on the state of the economy. Right now, the market sees slower growth, not now, but in the months ahead.
The Euro Hits a 20-Year Low
The other big news today is that the euro slid to a 20-year low against the dollar. As bad as the outlook has deteriorated in the United States, the outlook for the economy in Europe may be even worse. The U.S. dollar usually does well as investors seek a safe haven for their money.
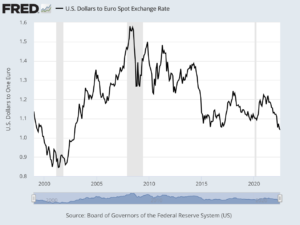
The euro got down to $1.028 today. Since the start of this year, the Euro has lost 9% against the U.S. dollar. The euro and dollar were last at parity in late 2002. It may happen again soon. Inflation in Europe is currently running at 8.6%. The ECB is looking to raise interest rates later this month. The central bank hasn’t raised rates in 11 years.
The energy crisis there is bad. Natural gas prices in Europe are up 700%. The outlook might get even worse as workers in Norway are eyeing a strike. After Russia, Norway is the second-largest provider of natural gas to Europe.
It’s an ugly picture. The main pipeline that carries Russian gas to Germany is due to close next week for repairs that are scheduled to last 10 years. What if Russia doesn’t reopen it? I don’t know, but it could cripple Germany’s economy which, in turn, could weaken the economy of the rest of Europe.
It’s as if natural gas has replaced oil as the most important commodity in geopolitics. What oil was in the 1970s, natgas may be in the 2020s. In the U.S., natural gas prices have been edging downward. So much of the European economy is based off Russian gas. I don’t know how quickly they can change that. This is a sad story that looks to get worse.
Stock Focus: General Mills
I didn’t want to close on a down note so this is a good time to look at a nice boring stock. Despite all the scary headlines, shares of General Mills (GIS) hit a fresh all-time high today. The stock broke over $76 per share. Since 1990, the stock is up more than 10-fold.
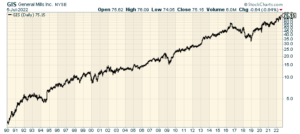
Last week, the cereal company just bumped up its quarterly dividend by 6% to 54 cents per share. The current yield comes to 2.87%.
Best of all, there’s nothing complicated about GIS’ business. General Mills owns Betty Crocker, Yoplait, Pillsbury, Old El Paso, Häagen-Dazs, Cheerios, Lucky Charms, Trix, Cocoa Puffs, Count Chocula and many more.
Last week, General Mills posted earnings of $1.12 per share which was an 11-cent beat. The company made $4.94 per share for the last fiscal year. Wall Street expected $4 per share the current fiscal year. Despite the new all-time share price, the stock is going for 19 times earnings.
I love to see these boring companies do well. I can’t imagine Cheerios being replaced any time soon.
That’s all for now. I’ll have more for you in the next issue of CWS Market Review.
– Eddy
Posted by Eddy Elfenbein on July 5th, 2022 at 7:41 pm
The information in this blog post represents my own opinions and does not contain a recommendation for any particular security or investment. I or my affiliates may hold positions or other interests in securities mentioned in the Blog, please see my Disclaimer page for my full disclaimer.
- Tweets by @EddyElfenbein
-
-
Archives
- May 2024
- April 2024
- March 2024
- February 2024
- January 2024
- December 2023
- November 2023
- October 2023
- September 2023
- August 2023
- July 2023
- June 2023
- May 2023
- April 2023
- March 2023
- February 2023
- January 2023
- December 2022
- November 2022
- October 2022
- September 2022
- August 2022
- July 2022
- June 2022
- May 2022
- April 2022
- March 2022
- February 2022
- January 2022
- December 2021
- November 2021
- October 2021
- September 2021
- August 2021
- July 2021
- June 2021
- May 2021
- April 2021
- March 2021
- February 2021
- January 2021
- December 2020
- November 2020
- October 2020
- September 2020
- August 2020
- July 2020
- June 2020
- May 2020
- April 2020
- March 2020
- February 2020
- January 2020
- December 2019
- November 2019
- October 2019
- September 2019
- August 2019
- July 2019
- June 2019
- May 2019
- April 2019
- March 2019
- February 2019
- January 2019
- December 2018
- November 2018
- October 2018
- September 2018
- August 2018
- July 2018
- June 2018
- May 2018
- April 2018
- March 2018
- February 2018
- January 2018
- December 2017
- November 2017
- October 2017
- September 2017
- August 2017
- July 2017
- June 2017
- May 2017
- April 2017
- March 2017
- February 2017
- January 2017
- December 2016
- November 2016
- October 2016
- September 2016
- August 2016
- July 2016
- June 2016
- May 2016
- April 2016
- March 2016
- February 2016
- January 2016
- December 2015
- November 2015
- October 2015
- September 2015
- August 2015
- July 2015
- June 2015
- May 2015
- April 2015
- March 2015
- February 2015
- January 2015
- December 2014
- November 2014
- October 2014
- September 2014
- August 2014
- July 2014
- June 2014
- May 2014
- April 2014
- March 2014
- February 2014
- January 2014
- December 2013
- November 2013
- October 2013
- September 2013
- August 2013
- July 2013
- June 2013
- May 2013
- April 2013
- March 2013
- February 2013
- January 2013
- December 2012
- November 2012
- October 2012
- September 2012
- August 2012
- July 2012
- June 2012
- May 2012
- April 2012
- March 2012
- February 2012
- January 2012
- December 2011
- November 2011
- October 2011
- September 2011
- August 2011
- July 2011
- June 2011
- May 2011
- April 2011
- March 2011
- February 2011
- January 2011
- December 2010
- November 2010
- October 2010
- September 2010
- August 2010
- July 2010
- June 2010
- May 2010
- April 2010
- March 2010
- February 2010
- January 2010
- December 2009
- November 2009
- October 2009
- September 2009
- August 2009
- July 2009
- June 2009
- May 2009
- April 2009
- March 2009
- February 2009
- January 2009
- December 2008
- November 2008
- October 2008
- September 2008
- August 2008
- July 2008
- June 2008
- May 2008
- April 2008
- March 2008
- February 2008
- January 2008
- December 2007
- November 2007
- October 2007
- September 2007
- August 2007
- July 2007
- June 2007
- May 2007
- April 2007
- March 2007
- February 2007
- January 2007
- December 2006
- November 2006
- October 2006
- September 2006
- August 2006
- July 2006
- June 2006
- May 2006
- April 2006
- March 2006
- February 2006
- January 2006
- December 2005
- November 2005
- October 2005
- September 2005
- August 2005
- July 2005
 Eddy Elfenbein is a Washington, DC-based speaker, portfolio manager and editor of the blog Crossing Wall Street. His