Archive for December, 2008
-
The 2009 Buy List
Eddy Elfenbein, December 31st, 2008 at 6:22 pmHere’s my 2009 Buy List. For tracking purposes, I assume it’s a $1,000,000 portfolio and each position is worth $50,000. Here’s each stock, ticker, starting price and number of shares. This is what I’m referring to when I discuss how well the Buy List is doing.
Company Ticker Price Shares AFLAC AFL $45.84 1090.7504 Amphenol APH $23.98 2,085.0709 Baxter International BAX $53.59 933.0099 Becton, Dickinson & Co. BDX $68.39 731.1010 Bed Bath & Beyond BBBY $25.42 1,966.9552 Cognizant Technology Solutions CTSH $18.06 2,768.5493 Danaher DHR $56.61 883.2362 Donaldson DCI $33.65 1,485.8841 Eaton Vance EV $21.01 2,379.8191 Eli Lilly LLY $40.27 1,241.6191 FactSet Research Systems FDS $44.24 1,130.1989 Fiserv FISV $36.37 1,374.7594 Jos. A Bank Clothiers JOSB $26.15 1,912.0459 Leucadia National LUK $19.80 2,525.2525 Medtronic MDT $31.42 1,591.3431 Moog MOG-A $36.57 1,367.2409 Nicholas Financial NICK $2.35 21,276.5957 SEI Investments SEIC $15.71 3,182.6862 Stryker SYK $39.95 1,251.5645 Sysco SYY $22.94 2,179.5990 Fifteen stocks return from 2008. The five new stocks are Baxter, Becton Dickinson, Cognizant, Eaton Vance and Eli Lilly. The sells are Clarcor, Harley-Davidson, Lincare, WR Berkley and UnitedHealth Group. We turnover one-fourth of the Buy List each year, however, nine stocks return to the Buy List for the fourth straight year.
The total market cap of all the companies is $238 billion. Eli Lilly is the largest at $45 billion. Nicholas Financial is by far the smallest at $24 million. The average dividend yield is 1.29%, which is much higher than we’ve had in previous years.
That’s it. The list is now “lock and sealed,” and I can’t touch it until next year. -
The 2008 Buy List
Eddy Elfenbein, December 31st, 2008 at 5:33 pmThe 2008 trading year has come to a close. Overall, it was an awful year for stocks. The S&P 500 lost 38.49%, making it the worst year for stocks in 71 years. The Crossing Wall Street Buy List lost 33.60% which, once again, beat the market. Including dividends, the S&P 500 lost 37.00% while the Crossing Wall Street Buy List lost 33.01%.
For the year, 19 of our 20 stocks lost money. The only winner was a small 3.99% gain in WR Berkeley (WRB). The biggest loser was Nicholas Financial (NICK) which dropped 67.5%, although I’m sticking with in 2009. The second-biggest loser was Harley-Davidson (HOG) which dropped 63.67%.
The Crossing Wall Street Buy List again had less risk than the rest of the market. The daily volatility was 2.45% less than the S&P 500.
Here’s a spreadsheet detailing how the Buy List did in 2008. For tracking purposes, I assume it’s a $1 million portfolio and all the stocks are equally weighted at the beginning of the year. The rules state that once the Buy List is set, I can’t touch it for the entire year. Here’s how the Buy List did throughout the year.

-
Dow to S&P 500 Ratio
Eddy Elfenbein, December 31st, 2008 at 2:24 pm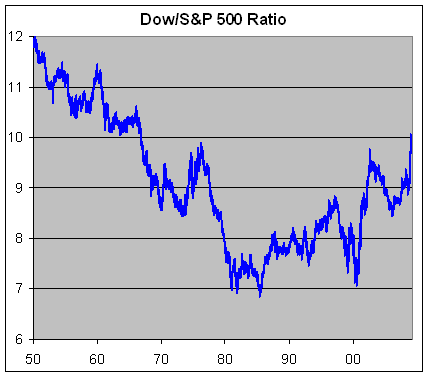
After breaking 10 for the first time in decades, the Dow to S&P 500 ratio has backed off slightly. I wonder if that could have been a signal of a bottom. The low point in 2000 looks like the signal for a top. -
Is the Storm Passing?
Eddy Elfenbein, December 31st, 2008 at 12:03 pmIt’s too early to say but if all holds up, the VIX will close below 40 for the first time in three months.
-
Six Degrees of Madoff
Eddy Elfenbein, December 30th, 2008 at 12:21 pmBernie’s latest victim, Kevin Bacon.
We’d heard that along with Hollywood boldfacers Jeffrey Katzenberg and Steven Spielberg, Bacon and his wife, Kyra Sedgwick, lost money in Madoff’s devastating $50 billion Ponzi scheme, and Bacon’s rep, Allen Eichorn, confirmed it for us. “Unfortunately, your report is true,” he wrote.
Come to think of it, the Madoff scandal does remind me of Tremors.
-
What are the Chances of a Depression in 2009?
Eddy Elfenbein, December 30th, 2008 at 12:15 pmIntrade says it’s up to 30%.
For their purposes a “depression is defined as a cumulative decline in GDP of more than 10.0% over four consecutive quarters.” -
Looking at Low Valuations
Eddy Elfenbein, December 30th, 2008 at 11:27 amI want to show you the dramatic collapse in stock valuations by taking a close look at Pfizer (PFE), the drug company. I’m not recommending the shares to own, I simply want to show you how extreme the market’s judgments have become.
Yesterday, shares of Pfizer closed at $17.29. Looking deeper, we see that the company has a very large cash horde of $26 billion, while a fairly modest long-term debt position of $7 billion. In this environment, it certainly pays to be cash-rich. Pfizer’s cash position works out to about $3.86 a share. That means you can pick up the company’s operations—the nuts and bolts of the business—for just $13.43 a share.
Now, here’s a look at Pfizer’s stock along with its earnings-per-share. The black line is the stock and it follows the left scale. The gold line is the EPS and it follows the right scale.
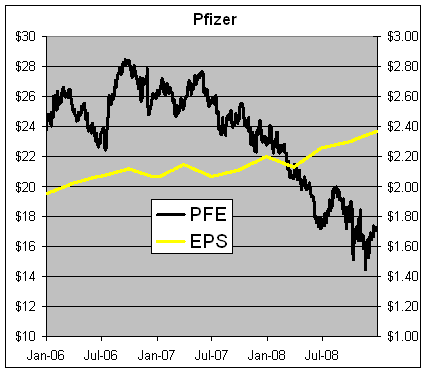
The graph is scaled at a ratio of 10-to-1, so when the lines cross, the P/E ratio is exactly 10. Not a pretty sight, but the earnings are moving in the right direction. As you can see, Pfizer’s P/E ratio has plunged far below 10, and that’s including the company’s generous cash balance.
We can see that Pfizer’s earnings are climbing although the growth rate isn’t terribly strong. For 2009, Wall Street sees earnings coming in at $2.49 a share. Just by eyeballing the recent trend, that seems reasonable. So working with the $13.43 figure we can see that Pfizer is really going for about five times next year’s earnings, or an earnings yield of about 18.5%, which is several times what you can find in the bond market.
Now let me point out a few caveats. Price/earnings ratio is hardly a perfect measure of value. Also, Pfizer is a company that faces many challenges so many of these numbers are simply guesses about the future. The important point is that the recession has left us with stocks that have much cheaper real valuations than a few months ago, even companies that aren’t so dependent on the credit markets. After all, Pfizer is still a cash-flow-positive company and that isn’t about to change anytime soon.
Pfizer currently pays a 32-cent quarterly dividend. The company made some news recently by declining to raise its dividend for the first time in four decades. Going by yesterday’s close, that’s a dividend yield of 7.4%.
If a five-year Treasury currently gets you just 1.5%, then the market is terrified of stocks like Pfizer. -
Gazprom Is Feeling the Pain
Eddy Elfenbein, December 30th, 2008 at 10:29 amGazprom, the Russian energy giant, has fallen on hard times. The plunge in commodity prices has caused the company’s stock price to fallen by 76%. At one time, Gazprom wanted to become the largest and most powerful company in the world. Today, it might need a government bailout.
As ugly as American capitalism can often appear in practice, nothing really comes close to Gazprom. The company is merely a collaboration of the Kremlin and business. There’s barely any recognizable difference. Like Lola, whatever Gazprom want, Gazprom gets.
The worst thing that can happen to an enterprise like Gazprom is to see initial success in its operations. As gas prices rose, they thought they really had a sound business and used their cash flow to renationalize Russia’s oil industry. Once prices turned south, then the whole house of cards began to fall.
For a time, Gazprom, a company that evolved from the former Soviet ministry of gas, had been embraced by investors as the model for energy investing at a time of resource nationalism, when governments in oil-rich regions were shutting out the Western majors. In theory, minority shareholders in government-run companies would not face the risk their assets would be nationalized.
The New York Times reports:But with 436,000 employees, extensive subsidiaries in everything from farming to hotels, higher-than-average salaries and company-sponsored housing and resorts on the Black Sea, critics say Gazprom perpetuated the Soviet paternalistic economy well into the capitalist era.
“I can describe the Russian economy as water in a sieve,” Yulia L. Latynina, a commentator on Echo of Moscow radio, said of the chronic waste in Russian industry.
“Everybody was thinking Russia had succeeded, and they were wondering, how do you keep water in a sieve?” Ms. Latynina said. “When the input of water is greater than the output, the sieve is full. Everybody was thinking it was a miracle. The sieve is full! But when there is a drop in the water supply, the sieve is again empty very quickly.”Perhaps Russia should do what America would do: appoint a Czar. No wait, bad idea.
-
Is Social Security a Ponzi Scheme?
Eddy Elfenbein, December 29th, 2008 at 2:23 pmJim Cramer says it is.
“To everybody in the press, who’s calling Bernie Madoff’s alleged $50 billion scam the ‘largest Ponzi scheme ever,’ I say give me a break,” Cramer said on his Dec. 17 show.
According to Cramer, the largest Ponzi scheme in history is run by the federal government – Social Security.
“We know the truth about Ponzi schemes,” Cramer said. “We all know the name of the biggest Ponzi scheme in history and it’s not even illegal. In fact, it is run by the U.S. government. And the name of it – well they call it Social Security.”Oh, please. Social Security is not a Ponzi Scheme. I’ll define a Ponzi Scheme as a fraud that has zero investments; it merely pays off initial investors with funds from new victims, I mean, “investors.”
First, the funds from social security do go into Treasury securities, which are real investments. Plus, social security is currently running a very large surplus. How much longer will it continue to run a surplus? Well, that’s a good question. But the system can stay healthy as long as there are adjustments to benefits and how much is paid in. Those choices aren’t easy but that’s a big difference from what Bernie Madoff was doing.
Think of it this way: If no new money was allowed into social security, it would still run. When the same happened to Madoff and Ponzi, their frauds were over.
Social Security has a lot of problems, but this talk of it being a Ponzi Scheme is just silly. -
The Danger of Models
Eddy Elfenbein, December 29th, 2008 at 2:10 pmOne of the market’s better timing strategies hasn’t been having a good run decade. I think all models are destined to fall at some point. Still, comparing the market’s return to the yield curve had a very nice run. Perhaps it will make a comeback. Let’s look at the numbers.
From 1962 through 1999, when the spread between the 90-day T-bill and the 10-year T-bond was 150 or more points, the S&P 500 returned about 1,140%. That happened slightly less than half the time. When the spread was less than 150 points, the S&P 500 rose just 65%. That’s a pretty sharp divide.
Since 2000, the S&P 500 has lost about 41% when the yield spread was over 150 points, and it’s been roughly flat when it’s been under 150 points.
- Tweets by @EddyElfenbein
-
-
Archives
- May 2024
- April 2024
- March 2024
- February 2024
- January 2024
- December 2023
- November 2023
- October 2023
- September 2023
- August 2023
- July 2023
- June 2023
- May 2023
- April 2023
- March 2023
- February 2023
- January 2023
- December 2022
- November 2022
- October 2022
- September 2022
- August 2022
- July 2022
- June 2022
- May 2022
- April 2022
- March 2022
- February 2022
- January 2022
- December 2021
- November 2021
- October 2021
- September 2021
- August 2021
- July 2021
- June 2021
- May 2021
- April 2021
- March 2021
- February 2021
- January 2021
- December 2020
- November 2020
- October 2020
- September 2020
- August 2020
- July 2020
- June 2020
- May 2020
- April 2020
- March 2020
- February 2020
- January 2020
- December 2019
- November 2019
- October 2019
- September 2019
- August 2019
- July 2019
- June 2019
- May 2019
- April 2019
- March 2019
- February 2019
- January 2019
- December 2018
- November 2018
- October 2018
- September 2018
- August 2018
- July 2018
- June 2018
- May 2018
- April 2018
- March 2018
- February 2018
- January 2018
- December 2017
- November 2017
- October 2017
- September 2017
- August 2017
- July 2017
- June 2017
- May 2017
- April 2017
- March 2017
- February 2017
- January 2017
- December 2016
- November 2016
- October 2016
- September 2016
- August 2016
- July 2016
- June 2016
- May 2016
- April 2016
- March 2016
- February 2016
- January 2016
- December 2015
- November 2015
- October 2015
- September 2015
- August 2015
- July 2015
- June 2015
- May 2015
- April 2015
- March 2015
- February 2015
- January 2015
- December 2014
- November 2014
- October 2014
- September 2014
- August 2014
- July 2014
- June 2014
- May 2014
- April 2014
- March 2014
- February 2014
- January 2014
- December 2013
- November 2013
- October 2013
- September 2013
- August 2013
- July 2013
- June 2013
- May 2013
- April 2013
- March 2013
- February 2013
- January 2013
- December 2012
- November 2012
- October 2012
- September 2012
- August 2012
- July 2012
- June 2012
- May 2012
- April 2012
- March 2012
- February 2012
- January 2012
- December 2011
- November 2011
- October 2011
- September 2011
- August 2011
- July 2011
- June 2011
- May 2011
- April 2011
- March 2011
- February 2011
- January 2011
- December 2010
- November 2010
- October 2010
- September 2010
- August 2010
- July 2010
- June 2010
- May 2010
- April 2010
- March 2010
- February 2010
- January 2010
- December 2009
- November 2009
- October 2009
- September 2009
- August 2009
- July 2009
- June 2009
- May 2009
- April 2009
- March 2009
- February 2009
- January 2009
- December 2008
- November 2008
- October 2008
- September 2008
- August 2008
- July 2008
- June 2008
- May 2008
- April 2008
- March 2008
- February 2008
- January 2008
- December 2007
- November 2007
- October 2007
- September 2007
- August 2007
- July 2007
- June 2007
- May 2007
- April 2007
- March 2007
- February 2007
- January 2007
- December 2006
- November 2006
- October 2006
- September 2006
- August 2006
- July 2006
- June 2006
- May 2006
- April 2006
- March 2006
- February 2006
- January 2006
- December 2005
- November 2005
- October 2005
- September 2005
- August 2005
- July 2005
 Eddy Elfenbein is a Washington, DC-based speaker, portfolio manager and editor of the blog Crossing Wall Street. His