Archive for November, 2007
-
My Favorite Links
Eddy Elfenbein, November 15th, 2007 at 2:39 pmI don’t do this often enough, but please visit my links page to read some of my favorite stock bloggers. Here are some blogs I’ve been reading lately:
- 10Q Detective
- Abnormal Returns
- Bespoke Investment Group
- The Big Picture
- Mebane Faber
- Footnoted.org
- Infectious Greed
- Jeff Matthews
- Jeff Miller
- The Kirk Report
- Marginal Revolution
- David Merkel
- The Mess That Greenspan Made
- Random Roger’s Big Picture
- Felix Salmon
- The Stalwart
- Wall Street Folly
-
Modest Inflation Last Month
Eddy Elfenbein, November 15th, 2007 at 11:55 amThe Wall Street Journal reports:
The consumer price index rose 0.3% in October, the Labor Department said Thursday, matching September’s increase. The core CPI, which excludes volatile food and energy prices, advanced 0.2% for a fifth-straight month. The headline and core gains matched Wall Street expectations, according to a Dow Jones Newswires survey.
Unrounded, the CPI rose 0.293% last month. The core CPI advanced 0.159% unrounded.
Consumer prices were up 3.5% from a year ago. The core CPI was up 2.2% compared to the same month a year ago, up from 2.1% in September.
Still, that remains near the 2% top end of the Federal Reserve’s assumed comfort zone for annual core inflation. The Fed’s preferred gauge, the core price index for personal consumption expenditures, is within that range at 1.8% annual growth through September.The government’s inflation data comes in for a lot of well-deserved ribbing. Still, the overall trend of inflation is tame. The United States is in no danger of slipping into hyper-inflation.
Even after high inflation was defeated in the early 1980s, the core CPI rate was often over 5% and that didn’t impede growth. The year-over-year core rate hasn’t gone over 3% or under 1% in over a decade. -
The Yield Curve Widens
Eddy Elfenbein, November 14th, 2007 at 12:28 pm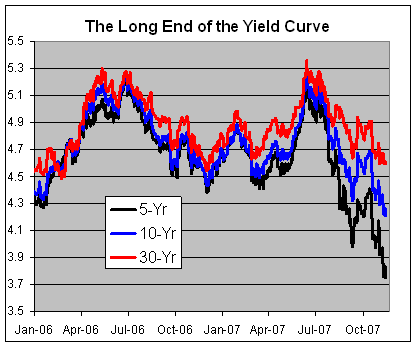
Eighteen months ago, the long end of the yield curve was almost perfectly flat. Today, some daylight can finally be seen between the long-end yields. Even though the 30-year yield isn’t to new lows, the five-year yield certainly is. -
Attention Math Nerds
Eddy Elfenbein, November 13th, 2007 at 1:58 pmHere’s a spreadsheet of some multiple regressions I ran.
I looked at the daily changes of the 10 S&P industry groups against each other. The regressions are the columns not the rows. (I’m afraid I’m out of my depth mathematically, so if anything looks off, please let me know.)
Healthcare and Staples seem to be strongly related. I like to think of them as subsets of one large group called Defensives. Also, Energy and Materials are strongly related. I was surprised to see such a strong connection between Financials and Consumer Discretionary stocks. -
Fear the Yen
Eddy Elfenbein, November 13th, 2007 at 12:27 pmHere are some stunning stats from Ken Fisher in yesterday’s Financial Times:
Forget the falling dollar. What we should fear is a rising yen. The most amazing statistic you never heard is: the year-to-date daily correlation between ups and downs in the global stock market versus spreads between the yen and the euro is 93 per cent. That is beyond eye-popping.
I had no idea it was that strong:
The 2007 year-to-date daily correlation coefficient between changes in the yen/euro spread and the MSCI World Index – best reflecting the total developed world stock market – is 0.93. For the S&P 500, it is 0.89, for the FTSE 100, 0.86, and for Germany’s DAX, 0.87. All higher than most people can fathom.
The correlation of the MSCI World to the yen/sterling spread is lower, at 0.75, but is still sky-high. To the Australian dollar it is 0.86 and to the Canadian dollar 0.81. All breathtakingly high. Only to the U.S. dollar, which everyone fears, is it materially lower at 0.37. -
Yay Me!
Eddy Elfenbein, November 13th, 2007 at 12:09 pmThis is a bit scary of me to say, but the Buy List has been doing incredibly well lately. We’ve beaten the S&P 500 for 14 of the last 17 days. Now I promise not to get too cocky because I’m still trailing the market for the year. In fact, just mentioning this makes me think that I’ll jinx it.
Last week, I noted that the Buy List had its best day relative to the S&P 500 for the year. It was only the third time we’ve beaten the market by over 1% in a day. Well yesterday was the best day ever against the S&P 500. We were up 0.16% while the S&P 500 was down -1.00%.
I’m stunned that these days are coming so close together. I build the Buy List to roughly conform to the overall market, but just do a little bit better (hopefully). Our daily correlation usually runs about 85%. Since October 18, the S&P 500 has dropped -6.55% while we’ve dropped just -1.54%. For the year, we still trail the S&P 500, 1.47% to 0.20%. But we’ve closed the gap enormously.
The big story yesterday was the fall in energy and materials stocks. That’s the major missing piece on the Buy List, so whenever those sectors trail, we tend to lead the market. Yesterday was a strange day because the dollar has its best day in over a year. Also, the Dow fell below 13,000 but its fall, in percentage terms, was half of the S&P 500. Outside of a few stocks, the market had a blah day.
Two small things to pass on. SEI Investments (SEIC) made news when it said it would provide financial guarantees for some of its money market funds. Also, Sysco (SYY) said it will raise its quarterly dividend by 15.8% to 22 cents a share. -
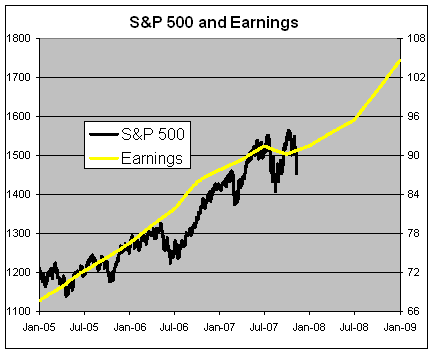
Still a Bull
Eddy Elfenbein, November 13th, 2007 at 11:13 amHe’s a chart of why I still like the stock market. The black line is the S&P 500 and it follows the left scale. The yellow line is its earnings and it follows the right scale. I scaled it at 16.66 to 1 which has been roughly the average P/E ratio for the past few months.
The part of the yellow line in the future is obviously projections. You can see that the market is anticipated to recover from a modest dent in earnings growth.
-
Breakfast at Wall Strip
Eddy Elfenbein, November 13th, 2007 at 9:12 amLindsay does a great Audrey Hepburn. Next, I hope they do My Fair Isaac. (“I could have bouuuught all night…”)
-
Leucadia National (LUK)
Eddy Elfenbein, November 12th, 2007 at 2:26 pmOne of my favorite stocks, Leucadia National (LUK), reported earnings on Friday. If you’re not familiar with Leucadia, it’s basically the Greta Garbo of the stock market. The company has no analysts who follow it, no earnings estimates, no whisper numbers, barely any press releases and it does minimal volume
Talk about bare bones, check out their website.
So what does Leucadia do? It’s often called a “mini Berkshire Hathaway” because it’s a holding company that buys assets on the cheap. For nearly thirty years, the firm has been run by Ian Cumming and Joe Steinberg. They own a hodgepodge of businesses; some real estate here, some timber there, even a winery. Nothing terribly exciting.
But what is impressive is the stock’s long-term performance. Remarkably, Leucadia National has done even better than Berkshire Hathaway.
Since the stock market bottomed in August 1982, shares of Leucadia National are up over 32,600%. Berkshire is up only 29,600%. (Poor Warren.) Actually, LUK has done even better because it paid out a ginormous dividend in 1999. The stock is up another 60% this year, and unlike Berkshire, they split the shares so normal humans can buy it.
The lesson here is, don’t be afraid of companies that aren’t widely followed. Some of the best stocks are off Wall Street’s radar screen. Inhabitants of Wall Streetistan tends to see all time and space as neatly divided into three month chunks. The quarterly earnings game is tough to play and there’s a benefit to ignoring it altogether. -
How to Profit from a Crash in China
Eddy Elfenbein, November 12th, 2007 at 11:10 amSome market observers think the Chinese market is a bubble. Me, I’m convinced. The Shanghai Composite has basically doubled this year, and it doubled last year as well. That’s not normal and it shouldn’t be expected to continue. In fact, the index is already down about 15% from its peak.
The good news for investors is that ProShares has launched a new ETF designed to profit off China’s misery. The UltraShort FTSE/Xinhua China 25 ProShare (FXP) moves twice in the opposite direction of the Chinese stock market. The underlying index is the FTSE/Xinhua China 25 Index (FXI). Check out how that index has done:
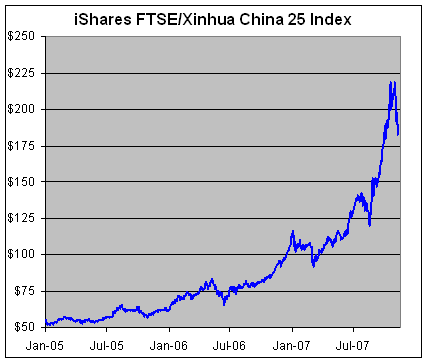
Yep, that might be a bubble.
-
Archives
- July 2026
- June 2026
- May 2026
- April 2026
- March 2026
- February 2026
- January 2026
- December 2025
- November 2025
- October 2025
- September 2025
- August 2025
- July 2025
- June 2025
- May 2025
- April 2025
- March 2025
- February 2025
- January 2025
- December 2024
- November 2024
- October 2024
- September 2024
- August 2024
- July 2024
- June 2024
- May 2024
- April 2024
- March 2024
- February 2024
- January 2024
- December 2023
- November 2023
- October 2023
- September 2023
- August 2023
- July 2023
- June 2023
- May 2023
- April 2023
- March 2023
- February 2023
- January 2023
- December 2022
- November 2022
- October 2022
- September 2022
- August 2022
- July 2022
- June 2022
- May 2022
- April 2022
- March 2022
- February 2022
- January 2022
- December 2021
- November 2021
- October 2021
- September 2021
- August 2021
- July 2021
- June 2021
- May 2021
- April 2021
- March 2021
- February 2021
- January 2021
- December 2020
- November 2020
- October 2020
- September 2020
- August 2020
- July 2020
- June 2020
- May 2020
- April 2020
- March 2020
- February 2020
- January 2020
- December 2019
- November 2019
- October 2019
- September 2019
- August 2019
- July 2019
- June 2019
- May 2019
- April 2019
- March 2019
- February 2019
- January 2019
- December 2018
- November 2018
- October 2018
- September 2018
- August 2018
- July 2018
- June 2018
- May 2018
- April 2018
- March 2018
- February 2018
- January 2018
- December 2017
- November 2017
- October 2017
- September 2017
- August 2017
- July 2017
- June 2017
- May 2017
- April 2017
- March 2017
- February 2017
- January 2017
- December 2016
- November 2016
- October 2016
- September 2016
- August 2016
- July 2016
- June 2016
- May 2016
- April 2016
- March 2016
- February 2016
- January 2016
- December 2015
- November 2015
- October 2015
- September 2015
- August 2015
- July 2015
- June 2015
- May 2015
- April 2015
- March 2015
- February 2015
- January 2015
- December 2014
- November 2014
- October 2014
- September 2014
- August 2014
- July 2014
- June 2014
- May 2014
- April 2014
- March 2014
- February 2014
- January 2014
- December 2013
- November 2013
- October 2013
- September 2013
- August 2013
- July 2013
- June 2013
- May 2013
- April 2013
- March 2013
- February 2013
- January 2013
- December 2012
- November 2012
- October 2012
- September 2012
- August 2012
- July 2012
- June 2012
- May 2012
- April 2012
- March 2012
- February 2012
- January 2012
- December 2011
- November 2011
- October 2011
- September 2011
- August 2011
- July 2011
- June 2011
- May 2011
- April 2011
- March 2011
- February 2011
- January 2011
- December 2010
- November 2010
- October 2010
- September 2010
- August 2010
- July 2010
- June 2010
- May 2010
- April 2010
- March 2010
- February 2010
- January 2010
- December 2009
- November 2009
- October 2009
- September 2009
- August 2009
- July 2009
- June 2009
- May 2009
- April 2009
- March 2009
- February 2009
- January 2009
- December 2008
- November 2008
- October 2008
- September 2008
- August 2008
- July 2008
- June 2008
- May 2008
- April 2008
- March 2008
- February 2008
- January 2008
- December 2007
- November 2007
- October 2007
- September 2007
- August 2007
- July 2007
- June 2007
- May 2007
- April 2007
- March 2007
- February 2007
- January 2007
- December 2006
- November 2006
- October 2006
- September 2006
- August 2006
- July 2006
- June 2006
- May 2006
- April 2006
- March 2006
- February 2006
- January 2006
- December 2005
- November 2005
- October 2005
- September 2005
- August 2005
- July 2005
 Eddy Elfenbein is a Washington, DC-based speaker, portfolio manager and editor of the blog Crossing Wall Street. His