Archive for April, 2009
-
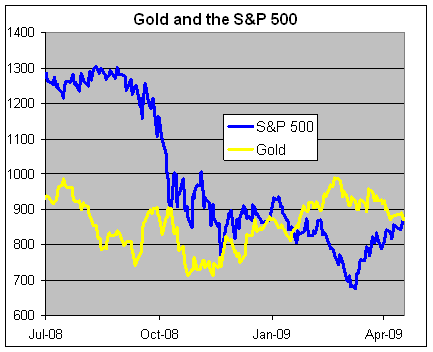
Another Victory for Technical Analysis
Eddy Elfenbein, April 20th, 2009 at 12:46 pmThe S&P’s rally begins almost exactly six years after the last turnaround. It even picks the devlish 666 as a bottom.
Then on Friday, the index finally surpasses gold for the first time in three months.
So of course we were due for a selloff!!
-
The Battering of Quants
Eddy Elfenbein, April 20th, 2009 at 12:30 pmBloomberg wakes up to the fact that momentum quant funds have been getting killed:
Companies with the most debt and lowest returns on assets are turning the biggest six-week rally in stocks since 1938 into a bloodbath for last year’s best- performing trading strategy.
Investors using so-called quantitative momentum strategies — which speculate that the worst stocks in the past 12 months will continue to decline — have become this year’s biggest losers after banks and companies that rely on consumer spending surged. Quant momentum managers may have lost 27 percent this month in the U.S., the most since at least 1993, while those in Europe may have dropped 20 percent in March and 24 percent in April, according to data compiled by JPMorgan Chase & Co.
“Not in a million years would we have expected this gyration to be as vicious and enduring as it has been,” Steven Solmonson, the head of Park Place Capital Ltd., a hedge fund that oversees $150 million, said in an interview from New York. “The quants got whipsawed badly.” -
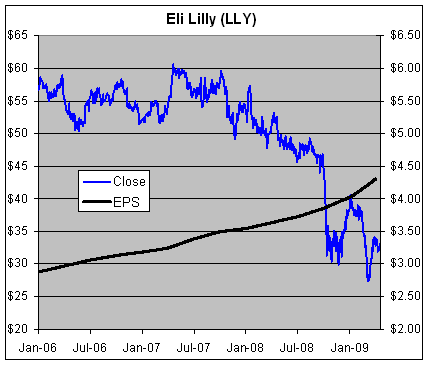
Eli Lilly’s Earnings Jump 23%
Eddy Elfenbein, April 20th, 2009 at 9:26 amEli Lilly (LLY) is one of our new additions to this year’s Buy List. The company just reported decent earnings this morning. AP reports:
Eli Lilly & Co. said Monday flat costs and strong sales of several top-selling drugs boosted first-quarter profit 23 percent, surpassing Wall Street expectations.
Higher sales volume and increased prices helped boost revenue from many of Lilly’s drugs. Those factors helped offset a reduction in revenue caused by the stronger dollar, the company said.
Sales of the antidepressant Cymbalta, Lilly’s second-best seller, grew 17 percent to $709 million, and the insulin Humalog saw revenue rise 11 percent to $450.6 million.
Lilly earned $1.31 billion, or $1.20 per share, compared with profit of $1.06 billion, or 97 cents per share, during the same period a year earlier. Revenue rose 5 percent to $5.05 billion.
Analysts polled by Thomson Reuters expected profit of 99 cents per share on revenue of $5.05 billion.That’s a huge earnings beat. The company also reiterated its full-year EPS forecast of $4 to $4.25 which means the stock is far from fully valued. The stock also pays a dividend close to 6%. Eli Lilly is a great buy.
-
The Allure of Outrage
Eddy Elfenbein, April 19th, 2009 at 7:19 pmClay Shirky has a very good and honest post on the narcotic allure of moral posturing. I think this is a bigger problem that many people realize.
What I find so frustrating about such much political discourse is that people don’t want to be proven right—they want to be proven better.
(HT: Felix) -
Rabbit Hood
Eddy Elfenbein, April 19th, 2009 at 4:54 pmThey really don’t get much better than this:
-
Event Risk Is Driving Markets
Eddy Elfenbein, April 17th, 2009 at 4:43 pmPeter Boockvar from a recent speech:
If the DJIA goes to 10,000, great! But if gold goes to $2000 at the same time, maybe not so great. If the stock market was left to its own devices, than I would say 400-500 in the S&P would be its inevitable destination as 10x ’09 earnings of about $40-50 would be a fair multiple based on previous bear market bottoms. Unfortunately, our officials won’t let it happen as any recovery that may soon ensue will be darkened by the insidious hidden tax of inflation, debasement of our currency and excessive sovereign debt that will take more and more tax dollars (aka, money sucked out of the private sector and shifted to government) to finance.
We all have to understand that the Fed and Treasury have embarked on a grand experiment. We now have a marketplace where fundamental analysis is being trumped by huge event risk of a different kind, Washington, DC kind, where some new acronym program, some reckless comment from a Congressman or some new asset class Bernanke Capital Management deems attractive to him, is driving markets.(Note: I originally misidentified the speaker as Barry Ritholtz. This has since been corrected).
-
Best Question of the Day
Eddy Elfenbein, April 17th, 2009 at 11:44 amThe award goes to Alea.
The New York Times writes: A.I.G. Chief Owns Significant Stake in Goldman.
Alea asks, “Is Owning 0.00535714% of Goldman Sachs Significant?” -
My Weak Defense of the Federal Reserve
Eddy Elfenbein, April 17th, 2009 at 10:39 amI’m not a terribly big fan of the Fed, but here’s a weak defense of monetary policy over the past several years. Core CPI inflation has not only remained low, but it’s also been surprisingly consistent. That’s an important point and we should give credit where it’s due.
This chart shows Core CPI (in blue) along with an exponential trendline (in black). The takeaway is that an analyst could have ignored all the data on M2 or M3 and production and all that jazz. Instead, just assume that prices would rise 0.18% each month and that would be a pretty good way to go.

A reader adds:Just to let you know, there’s a little flaw in this analysis: the 0.18 would have only been known *with insight*. In a nutshell, things look more predictable with insight.
The correct way to do this is to measure the size of the inflation surprise: i.e. for each month in I.1995:IV.2009 compute a best estimate of next month’s cpi using all information available up to that point.
You’ll find that w/o insight (even) Core CPI is a tough one to get right, but perhaps more worryingly so, has gotten tougher to get since 2001.(No Seeking Alpha repost)
-
Buy List YTD
Eddy Elfenbein, April 16th, 2009 at 4:36 pmThrough today, the Buy List is up 3.54% compared with a loss of 4.20% for the S&P 500 (dividends not included). The red line is the Buy List, the black is the S&P 500.
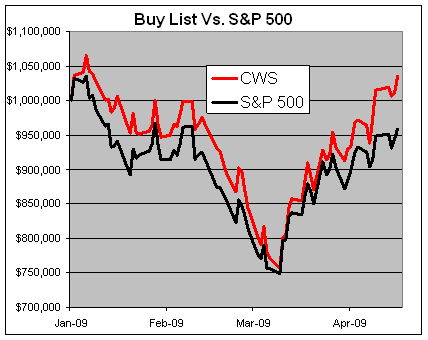
It’s still early, but it’s a good start to the year. -
Yahoo Finance – Historical Quote FAIL
Eddy Elfenbein, April 16th, 2009 at 2:52 pmThere’s not much I like about Yahoo, but I know Yahoo Finance is wildly popular among individual investors. It’s just about all they got. If I were them, I’d sell it to a brokerage.
I don’t have the exact details, but their historical quotes are massively screwed up. When you click on historical quotes, you can see an adjusted price column that accounts for dividends. That’s great, but I don’t think the dividends are ever adjusted for stock splits. As a result, you get massively wrong historical numbers.
As I said, I’m not sure about this but let’s look at Public Service Enterprise Group (PEG) which is one of those great performing utilities that no one ever talks about. The dividends have increased every year like clockwork. Since 1982, there have been two splits; a 3-for-2 in 1987 and a 2-for-1 last year.
Here’s a log chart since 1982. The black line is the regular price adjusted for the two splits, the blue line is the dividend adjusted price:
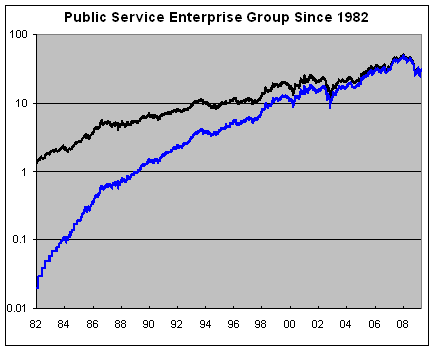
As you go back in time, the lines get wider apart to adjust for dividends but there’s no way it should move that dramatically.
Looking at their numbers, the stock price rose 147% during the 1990s while the adjust price rose 648%. That means that dividends accounted for gains of over 200%, or an average of 11.7% a year. There’s no way that can be right.
I know people use Yahoo Finance to get track of their gains and losses. Don’t do it.
-
Archives
- July 2026
- June 2026
- May 2026
- April 2026
- March 2026
- February 2026
- January 2026
- December 2025
- November 2025
- October 2025
- September 2025
- August 2025
- July 2025
- June 2025
- May 2025
- April 2025
- March 2025
- February 2025
- January 2025
- December 2024
- November 2024
- October 2024
- September 2024
- August 2024
- July 2024
- June 2024
- May 2024
- April 2024
- March 2024
- February 2024
- January 2024
- December 2023
- November 2023
- October 2023
- September 2023
- August 2023
- July 2023
- June 2023
- May 2023
- April 2023
- March 2023
- February 2023
- January 2023
- December 2022
- November 2022
- October 2022
- September 2022
- August 2022
- July 2022
- June 2022
- May 2022
- April 2022
- March 2022
- February 2022
- January 2022
- December 2021
- November 2021
- October 2021
- September 2021
- August 2021
- July 2021
- June 2021
- May 2021
- April 2021
- March 2021
- February 2021
- January 2021
- December 2020
- November 2020
- October 2020
- September 2020
- August 2020
- July 2020
- June 2020
- May 2020
- April 2020
- March 2020
- February 2020
- January 2020
- December 2019
- November 2019
- October 2019
- September 2019
- August 2019
- July 2019
- June 2019
- May 2019
- April 2019
- March 2019
- February 2019
- January 2019
- December 2018
- November 2018
- October 2018
- September 2018
- August 2018
- July 2018
- June 2018
- May 2018
- April 2018
- March 2018
- February 2018
- January 2018
- December 2017
- November 2017
- October 2017
- September 2017
- August 2017
- July 2017
- June 2017
- May 2017
- April 2017
- March 2017
- February 2017
- January 2017
- December 2016
- November 2016
- October 2016
- September 2016
- August 2016
- July 2016
- June 2016
- May 2016
- April 2016
- March 2016
- February 2016
- January 2016
- December 2015
- November 2015
- October 2015
- September 2015
- August 2015
- July 2015
- June 2015
- May 2015
- April 2015
- March 2015
- February 2015
- January 2015
- December 2014
- November 2014
- October 2014
- September 2014
- August 2014
- July 2014
- June 2014
- May 2014
- April 2014
- March 2014
- February 2014
- January 2014
- December 2013
- November 2013
- October 2013
- September 2013
- August 2013
- July 2013
- June 2013
- May 2013
- April 2013
- March 2013
- February 2013
- January 2013
- December 2012
- November 2012
- October 2012
- September 2012
- August 2012
- July 2012
- June 2012
- May 2012
- April 2012
- March 2012
- February 2012
- January 2012
- December 2011
- November 2011
- October 2011
- September 2011
- August 2011
- July 2011
- June 2011
- May 2011
- April 2011
- March 2011
- February 2011
- January 2011
- December 2010
- November 2010
- October 2010
- September 2010
- August 2010
- July 2010
- June 2010
- May 2010
- April 2010
- March 2010
- February 2010
- January 2010
- December 2009
- November 2009
- October 2009
- September 2009
- August 2009
- July 2009
- June 2009
- May 2009
- April 2009
- March 2009
- February 2009
- January 2009
- December 2008
- November 2008
- October 2008
- September 2008
- August 2008
- July 2008
- June 2008
- May 2008
- April 2008
- March 2008
- February 2008
- January 2008
- December 2007
- November 2007
- October 2007
- September 2007
- August 2007
- July 2007
- June 2007
- May 2007
- April 2007
- March 2007
- February 2007
- January 2007
- December 2006
- November 2006
- October 2006
- September 2006
- August 2006
- July 2006
- June 2006
- May 2006
- April 2006
- March 2006
- February 2006
- January 2006
- December 2005
- November 2005
- October 2005
- September 2005
- August 2005
- July 2005
 Eddy Elfenbein is a Washington, DC-based speaker, portfolio manager and editor of the blog Crossing Wall Street. His