Archive for January, 2010
-
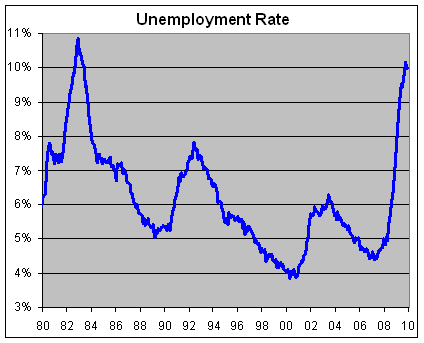
December Unemployment Report
Eddy Elfenbein, January 8th, 2010 at 8:32 amThe Labor Department reported that the unemployment rate for December was unchanged at 10%. Nonfarm payrolls declined by 85,000.
For October, the loss of 11,000 was revised to a gain of 4,000. For November, the loss of 111,000 was revised to a loss of 127,000.
-
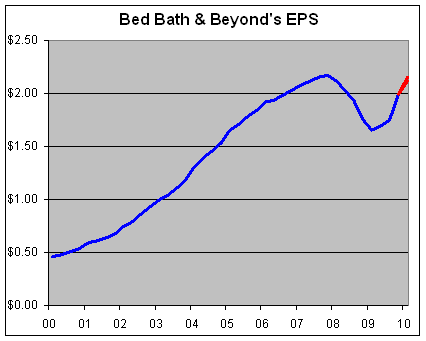
Bed, Bath & Beyond’s Huge Quarter
Eddy Elfenbein, January 6th, 2010 at 4:35 pmAfter the bell, one of my favorite Buy List stocks, Bed, Bath & Beyond (BBBY) reported earnings of 58 cents a share which was 15 cents more than the Street’s forecast! Dayum… that’s a huge earnings beat. The stock is up 8% after-hours.
Sales rose 10.8% to $1.98 billion which topped the Street’s estimate of $1.91 billion. Note that this was their November quarter so it didn’t include much of the holiday shopping season.
BBBY also forecast earnings for this quarter of 67 to 71 cents a share which was above the Street’s estimate of 63 cents.
There’s a lot I like about this earnings report. First is that sales growth came in strong. This is the best top-line growth number in two years. And with that, margins didn’t suffer which has been a problem in recent years. Year-over-year net margins fell for 14 straight quarters, but have now risen for the past three.
Decreasing margins are like kryptonite for a company. In BBBY’s case, net margin fell from about 10% to 6%. That effectively erases a 66% gain in sales. Rising margins have the opposite effect. The problem for every retailer is that you have to walk the line between higher margins and its impact on sales. BBBY has pulled in more sales and higher margins.
Here are the earnings results going back a few years:Quarter Sales Gross Profit Operating Profit Net Profit EPS $356,633 $146,214 $28,015 $17,883 $0.06 $451,715 $185,570 $53,580 $33,247 $0.12 $480,145 $196,784 $50,607 $31,707 $0.11 $569,012 $238,233 $77,138 $48,392 $0.17 $459,163 $187,293 $36,339 $23,364 $0.08 $589,381 $241,284 $70,009 $43,578 $0.15 $602,004 $246,080 $64,592 $40,665 $0.14 $746,107 $311,802 $101,898 $64,315 $0.22 $575,833 $234,959 $45,602 $30,007 $0.10 $713,636 $291,342 $84,672 $53,954 $0.18 $759,438 $311,030 $83,749 $52,964 $0.18 $879,055 $370,235 $132,077 $82,674 $0.28 $776,798 $318,362 $72,701 $46,299 $0.15 $903,044 $370,335 $119,687 $75,459 $0.25 $936,030 $386,224 $119,228 $75,112 $0.25 $1,049,292 $443,626 $168,441 $105,309 $0.35 $893,868 $367,180 $90,450 $57,508 $0.19 $1,111,445 $459,145 $155,867 $97,208 $0.32 $1,174,740 $486,987 $161,459 $100,506 $0.33 $1,297,928 $563,352 $231,567 $144,248 $0.47 $1,100,917 $456,774 $128,707 $82,049 $0.27 $1,273,960 $530,829 $189,108 $120,008 $0.39 $1,305,155 $548,152 $190,978 $121,927 $0.40 $1,467,646 $650,546 $283,621 $180,980 $0.59 $1,244,421 $520,781 $150,884 $98,903 $0.33 $1,431,182 $601,784 $217,877 $141,402 $0.47 $1,448,680 $615,363 $205,493 $134,620 $0.45 $1,685,279 $747,820 $304,917 $197,922 $0.67 $1,395,963 $590,098 $148,750 $100,431 $0.35 $1,607,239 $678,249 $219,622 $145,535 $0.51 $1,619,240 $704,073 $211,134 $142,436 $0.50 $1,994,987 $862,982 $309,895 $205,842 $0.72 $1,553,293 $646,109 $154,391 $104,647 $0.38 $1,767,716 $732,158 $211,037 $147,008 $0.55 $1,794,747 $747,866 $203,152 $138,232 $0.52 $1,933,186 $799,098 $259,442 $172,921 $0.66 $1,648,491 $656,000 $118,819 $76,777 $0.30 $1,853,892 $739,321 $187,421 $119,268 $0.46 $1,782,683 $692,857 $136,374 $87,700 $0.34 $1,923,274 $785,058 $231,282 $141,378 $0.55 $1,694,340 $666,818 $142,304 $87,172 $0.34 $1,914,909 $773,393 $222,031 $135,531 $0.52 $1,975,465 $812,412 $245,611 $151,288 $0.58 Finally, here’s a BBBY’s trailing four-quarter EPS with the red being the company’s forecast:
-
A New Relative Strength High for Cyclicals
Eddy Elfenbein, January 6th, 2010 at 12:53 pmA reader points out that the ratio of the Morgan Stanley Cyclical Stock Index (^CYC) relative to the S&P 500 (^SPX) has reached another new all time high. The ratio closed over 0.76 for the first time ever yesterday.
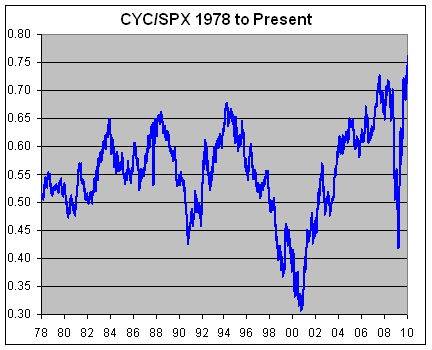
I think there are three takeaways from this. The first is that it could be that cyclicals are due to lag the market very soon. That’s one of the reasons why the Buy List tilts toward non-cyclical areas like health and consumer stocks.
The second is that if the market is correct, then this is one of the sharpest V’s in a V-shaped recovery that I’ve ever seen.
The third is that you can really see how much of the market’s swoon and recovery was focused on cyclicals. If you had completely ignored this ratio from September 2008 to September 2009, then you’d find it almost exactly where you left it. -
The Bubble Popper
Eddy Elfenbein, January 6th, 2010 at 10:40 amListening to some people, you’d think the Fed chairman has a machine in his office called “the bubble popper.” It will instantly pop any bubble without affecting anything else. If only, he would just turn it on.
-
Looking At the Numbers at Nicholas Financial
Eddy Elfenbein, January 5th, 2010 at 3:50 pmI’ve always been impressed with the amount of financial info that Nicholas Financial (NICK) provides about their portfolio in their quarterly statements. I wish more companies were this forthcoming. I’ve assembled a portfolio summary on this spreadsheet of how they’ve done over the last several quarters.
By looking at this spreadsheet you can see why I’m such a big fan of the stock. The pre-tax bottom line is column N. However, the most important line to watch is column K, the provision for credit losses. That zoomed up during the credit crisis and it took out a huge chunk of NICK’s earnings.
The pre-tax yield before adjusting for credit losses has been remarkably consistent for the past 12 quarters, usually around 12.5%. The credit losses completely altered NICK’s profitability. But something big happened the last two quarter. The eight-quarter run of year-over-year increases in the provision for credit losses finally stopped. It’s still high, but if it continues to drop, that will give a big boost to NICK’s bottom line.
Let’s make some assumptions for the next earnings report. If the pre-tax yield for the last quarter hit 7% on receivables of $230 million that comes to about $4 million pre-tax for the quarter. With the new shares post stock dividend, that’s 35 cents a share. After taxes, that’s about 22 cents a share.
For the first six months of the fiscal year (ends March 31), NICK made 40 cents a share. So we’re probably talking about stock on its way to making around 80 cents a share for the year during an awful recession. As I see it, this company is almost like an 11% or 12% bond and the credit quality is improving. -
Your Home Is a Terrible Investment
Eddy Elfenbein, January 5th, 2010 at 1:48 pmSo says Karen Pence who runs the Fed’s household and real estate finance research group. Here are her five reasons:
1. It is an indivisible asset. If you own stocks and bonds and suddenly need a little cash, you can sell some of your stocks or bonds but not all. With a home, on the other hand, “you can’t just slice off your bathroom and sell it on the market.”
2. It is undiversified. You can buy stocks or bonds in industries or countries all over the world. A home is a bet on one single neighborhood.
3. Transaction costs are very high when you buy or sell a home because of real estate agent fees, mortgage fees and moving costs.
4. It is asymmetrically liquid, meaning it’s easy to get money out when home prices are going up. (You just take out a bigger mortgage.) But it’s hard to take money out when prices are going down because refinancing becomes more difficult. Put another way, the leverage that you have in your house with a large mortgage means your investment does well in good times but could be lousy in bad times.
5. It is highly correlated to the job market, meaning that home prices in a neighborhood tend to rise when the job market is improving in the area and fall when the job market is worsening. This means that your main financial asset provides the smallest cushion to you when you might need it most. -
Lilly Works to Improve Drug Pipeline
Eddy Elfenbein, January 5th, 2010 at 9:59 amOne of my Buy List stocks, Eli Lilly (LLY), has often been criticized for its dwindling pipeline of new drugs. That’s probably one of the reasons the stock goes for less than eight times next year’s earnings and it carries a dividend yield of 5.5%.
Lilly, however, has been working hard to fix the problem. The WSJ focuses today on the company’s use of outside research firms:Eli Lilly & Co., like many other pharmaceutical companies, is seeking to make its drug-development efforts more productive as it copes with thin new-product pipelines. Its approach: hiring outside contractors to run tests on its drug candidates.
Pharmaceutical companies have traditionally kept a tight lid on drugs under development, conducting key work in-house. But early this year, the Indianapolis drug maker will decide whether to move a promising molecule to treat rheumatoid arthritis into late-stage testing, based on mid-stage data developed by scientists outside of its own research team. If the drug eventually wins regulatory approval, it will compete in a $16 billion annual market.
By outsourcing human tests of such a potentially important drug, Lilly is among a crowd of pharmaceutical giants adopting out-of-the-box strategies to revive fallow research-and-development organizations. -
Bloomberg Profiles David Tepper
Eddy Elfenbein, January 5th, 2010 at 8:31 amBloomberg profiles hedge fund manager David Tepper who make a few billion dollars last year betting that the world was not, in fact, coming to an end.
“It was crazy,” says Tepper, a Pittsburgh native. “In February and early March, people were in a panic.”
Appaloosa began scooping up bank-related securities, including common and preferred shares and junior subordinated debt. The Short Hills, New Jersey-based hedge fund firm bought into Bank of America, Citigroup, Fifth Third Bancorp and SunTrust Banks Inc. Tepper also bought the bonds of New York- based American International Group Inc., Frankfurt-based Commerzbank AG and London-based Lloyds Banking Group Plc, paying as little as a nickel on the dollar. -
20 Years Since the Nikkei’s Peak
Eddy Elfenbein, January 5th, 2010 at 8:07 amThinks it’s been bad here? Check out how the Japanese market has done over past two decades.
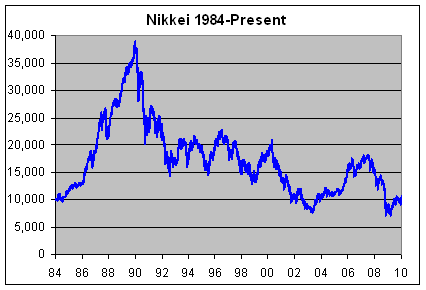
The Nikkei hit its peak 20 years ago on December 29, 1989 at 38,916. This past March, the index hit a low of 7054. That’s an 82% drop. -
Remembrance of Stocks Past
Eddy Elfenbein, January 4th, 2010 at 3:47 pmMark Hulbert has an article in the New York Times on one of my favorite topics—momentum investing. The issue I take with Mark is that he focuses on the intermediate-term impact of momentum. The impact where momentum has been most strongly felt is in the short-term. The shorter the term, the stronger it is. Historically, the impact has been very real and quite large. Whether it will continue is another question, and I tend to doubt it will.
The article contains this quote:“We can be comforted by the fact that reasonably efficient markets always base their level on anticipated future returns,” he added, “and do not include history in the calculation.”
Sorry, but that’s just not true. One of the mysteries of the stock market is that the past does have an effect on the future. What it is and how it works isn’t exactly clear. For example, the stock market does significantly better on days following up days, and significantly worse on days following down days. Also, the persistence of tall heads and fat tails suggests (but isn’t proof) that the past impacts the future. In other words, stocks may go down simply because they’re going down.
Hulbert then goes on to discuss one area of market inefficiency which is the historical outperformance of small-cap stocks. Interestingly, this is the one anomaly that I’m most skeptical of. Historically, the numbers back it up but the small-cap premium is highly volatile compared with its size. In fact, small-caps have experienced decades of lagging the market.
I’m currently reading Eric Falkenstein’s fascinating book, Finding Alpha which discusses the small-cap premium and suggests that it may be an illusion due to methodological errors. I suspect he’s right. The January Effect doesn’t make much sense without it.
-
Archives
- July 2026
- June 2026
- May 2026
- April 2026
- March 2026
- February 2026
- January 2026
- December 2025
- November 2025
- October 2025
- September 2025
- August 2025
- July 2025
- June 2025
- May 2025
- April 2025
- March 2025
- February 2025
- January 2025
- December 2024
- November 2024
- October 2024
- September 2024
- August 2024
- July 2024
- June 2024
- May 2024
- April 2024
- March 2024
- February 2024
- January 2024
- December 2023
- November 2023
- October 2023
- September 2023
- August 2023
- July 2023
- June 2023
- May 2023
- April 2023
- March 2023
- February 2023
- January 2023
- December 2022
- November 2022
- October 2022
- September 2022
- August 2022
- July 2022
- June 2022
- May 2022
- April 2022
- March 2022
- February 2022
- January 2022
- December 2021
- November 2021
- October 2021
- September 2021
- August 2021
- July 2021
- June 2021
- May 2021
- April 2021
- March 2021
- February 2021
- January 2021
- December 2020
- November 2020
- October 2020
- September 2020
- August 2020
- July 2020
- June 2020
- May 2020
- April 2020
- March 2020
- February 2020
- January 2020
- December 2019
- November 2019
- October 2019
- September 2019
- August 2019
- July 2019
- June 2019
- May 2019
- April 2019
- March 2019
- February 2019
- January 2019
- December 2018
- November 2018
- October 2018
- September 2018
- August 2018
- July 2018
- June 2018
- May 2018
- April 2018
- March 2018
- February 2018
- January 2018
- December 2017
- November 2017
- October 2017
- September 2017
- August 2017
- July 2017
- June 2017
- May 2017
- April 2017
- March 2017
- February 2017
- January 2017
- December 2016
- November 2016
- October 2016
- September 2016
- August 2016
- July 2016
- June 2016
- May 2016
- April 2016
- March 2016
- February 2016
- January 2016
- December 2015
- November 2015
- October 2015
- September 2015
- August 2015
- July 2015
- June 2015
- May 2015
- April 2015
- March 2015
- February 2015
- January 2015
- December 2014
- November 2014
- October 2014
- September 2014
- August 2014
- July 2014
- June 2014
- May 2014
- April 2014
- March 2014
- February 2014
- January 2014
- December 2013
- November 2013
- October 2013
- September 2013
- August 2013
- July 2013
- June 2013
- May 2013
- April 2013
- March 2013
- February 2013
- January 2013
- December 2012
- November 2012
- October 2012
- September 2012
- August 2012
- July 2012
- June 2012
- May 2012
- April 2012
- March 2012
- February 2012
- January 2012
- December 2011
- November 2011
- October 2011
- September 2011
- August 2011
- July 2011
- June 2011
- May 2011
- April 2011
- March 2011
- February 2011
- January 2011
- December 2010
- November 2010
- October 2010
- September 2010
- August 2010
- July 2010
- June 2010
- May 2010
- April 2010
- March 2010
- February 2010
- January 2010
- December 2009
- November 2009
- October 2009
- September 2009
- August 2009
- July 2009
- June 2009
- May 2009
- April 2009
- March 2009
- February 2009
- January 2009
- December 2008
- November 2008
- October 2008
- September 2008
- August 2008
- July 2008
- June 2008
- May 2008
- April 2008
- March 2008
- February 2008
- January 2008
- December 2007
- November 2007
- October 2007
- September 2007
- August 2007
- July 2007
- June 2007
- May 2007
- April 2007
- March 2007
- February 2007
- January 2007
- December 2006
- November 2006
- October 2006
- September 2006
- August 2006
- July 2006
- June 2006
- May 2006
- April 2006
- March 2006
- February 2006
- January 2006
- December 2005
- November 2005
- October 2005
- September 2005
- August 2005
- July 2005
 Eddy Elfenbein is a Washington, DC-based speaker, portfolio manager and editor of the blog Crossing Wall Street. His