Archive for March, 2010
-
Happy St. Patrick’s Day
Eddy Elfenbein, March 17th, 2010 at 8:48 am -
Today’s FOMC Statement
Eddy Elfenbein, March 16th, 2010 at 1:16 pmThis statement is pretty much the same as the last one. Once again, Hoenig is the lone dissenter:
Information received since the Federal Open Market Committee met in January suggests that economic activity has continued to strengthen and that the labor market is stabilizing. Household spending is expanding at a moderate rate but remains constrained by high unemployment, modest income growth, lower housing wealth, and tight credit. Business spending on equipment and software has risen significantly. However, investment in nonresidential structures is declining, housing starts have been flat at a depressed level, and employers remain reluctant to add to payrolls. While bank lending continues to contract, financial market conditions remain supportive of economic growth. Although the pace of economic recovery is likely to be moderate for a time, the Committee anticipates a gradual return to higher levels of resource utilization in a context of price stability.
With substantial resource slack continuing to restrain cost pressures and longer-term inflation expectations stable, inflation is likely to be subdued for some time.
The Committee will maintain the target range for the federal funds rate at 0 to 1/4 percent and continues to anticipate that economic conditions, including low rates of resource utilization, subdued inflation trends, and stable inflation expectations, are likely to warrant exceptionally low levels of the federal funds rate for an extended period. To provide support to mortgage lending and housing markets and to improve overall conditions in private credit markets, the Federal Reserve has been purchasing $1.25 trillion of agency mortgage-backed securities and about $175 billion of agency debt; those purchases are nearing completion, and the remaining transactions will be executed by the end of this month. The Committee will continue to monitor the economic outlook and financial developments and will employ its policy tools as necessary to promote economic recovery and price stability.
In light of improved functioning of financial markets, the Federal Reserve has been closing the special liquidity facilities that it created to support markets during the crisis. The only remaining such program, the Term Asset-Backed Securities Loan Facility, is scheduled to close on June 30 for loans backed by new-issue commercial mortgage-backed securities and on March 31 for loans backed by all other types of collateral.
Voting for the FOMC monetary policy action were: Ben S. Bernanke, Chairman; William C. Dudley, Vice Chairman; James Bullard; Elizabeth A. Duke; Donald L. Kohn; Sandra Pianalto; Eric S. Rosengren; Daniel K. Tarullo; and Kevin M. Warsh. Voting against the policy action was Thomas M. Hoenig, who believed that continuing to express the expectation of exceptionally low levels of the federal funds rate for an extended period was no longer warranted because it could lead to the buildup of financial imbalances and increase risks to longer-run macroeconomic and financial stability. -
Seneca Foods
Eddy Elfenbein, March 11th, 2010 at 1:02 pmIf you like finding really off-the-radar stocks, you might want to check out little Seneca Foods (SENEA). This is a small food company based in upstate New York. The company was started in 1959 by Arthur Wolcott who still serves as Chairman of the Board.
I haven’t drilled down on the numbers but it looks like Seneca is going for about seven times earnings. Best of all, this is one of those stocks that’s almost completely ignored by Wall Street.
If you have the time, you can listen to a 42-minute presentation Seneca gave to Merrill Lynch’s Consumer Conference yesterday. -
Looking at the TIPS Yield Curve
Eddy Elfenbein, March 11th, 2010 at 10:52 amHere’s the current yield curve of Treasury Inflation Protected Securities, which means you get the yield plus the CPI.
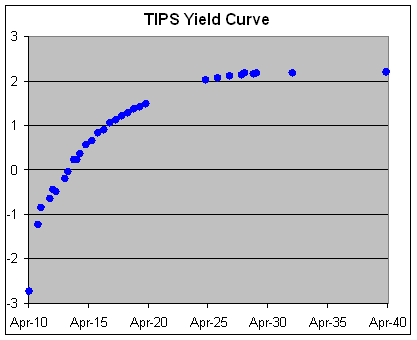
Looking at this, I can’t help but think it’s the Treasury equivalent of the Internet bubble from 10 years ago.
I’m not a bond investor but I won’t even think of investing in any bond that had a real return of less than 2%. According to the bend of the current curve, the TIPS yields won’t reach 2% for another four years. They won’t even turn positive for another two years. -
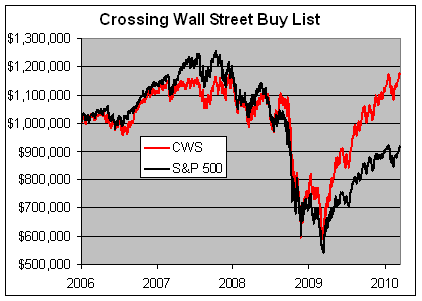
The Buy List Hits an All-Time High
Eddy Elfenbein, March 10th, 2010 at 5:10 pmHuzzah! The Bear Market is over for us! After more than two years, the Crossing Wall Street Buy List made a new all-time high today.
The combined record of the Buy Lists going back to 2006 has made a capital gain of 17.65% which takes out our previous high of 17.46% set on December 24, 2007.
Over that same time, the S&P 500 has lost -8.23%.
At our low point, exactly one year and one day ago, the Buy List had lost 50.36% of its value. Since then, we’re up 101.76%.
That’s just capital gains. If you include dividends, our Buy List is up 22.14% compared with a gain of just 0.39% for the S&P 500.
-
An Eight Stock Index Fund
Eddy Elfenbein, March 10th, 2010 at 4:26 pmLooking to build a quick-and-easy index fund? Of all the stocks in the Dow, United Technologies (UTX) has had the strongest daily correlation with the S&P 500 going back to the beginning of 2005. Each day’s UTX gain or loss has a 69.7% correlation with the S&P 500.
If we add in Dupont (DD), the correlation jumps to 80.5%. (Note this is average daily change, so it assumes you invest equal amounts each day.)
If you add in Disney (DIS), the correlation rises to 85.4%.
Now the extra correlation really is hard to come by. If you add ExxonMobil (XOM), the correlation rises to 88.9%.
Still more?
If we add American Express (AXP) the daily correlations rises to 90.6%.
Verizon (VZ) brings it up to 92.6%.If you want to go for seven stocks, IBM (IBM) will bring you up to 94%.
Now we’re almost out of room. Wal-Mart (WMT) will bring our eight stock index fund up to a 95% daily correlation with the S&P 500. This is, of course, an equally weighted fund.
If you want the extra 5% so you can be perfectly correlated with the index, just add 492 stocks and value weight them.
-
Don’t Give Me the Facts, Give Me Something I Can Understand
Eddy Elfenbein, March 10th, 2010 at 10:15 amHere’s the opening of a fascinating article on cognitive fluency from the Boston Globe:
Imagine that your stockbroker – or the friend who’s always giving you stock tips – called and told you he had come up with a new investment strategy. Price-to-earnings ratios, debt levels, management, competition, what the company makes, and how well it makes it, all those considerations go out the window. The new strategy is this: Invest in companies with names that are very easy to pronounce.
This would probably not strike you as a great idea. But, if recent research is to be believed, it might just be brilliant.(HT: Timmay Sykes)
-
Projections for Nicholas Financial
Eddy Elfenbein, March 9th, 2010 at 12:51 pmThis chart below is perhaps the clearest reason why I find Nicholas Financial (NICK) such a compelling buy right now.
This shows the company’s pre-tax profit (in millions) along with the provision for credit losses. What you see is just how damaging the credit loss provisions have been.
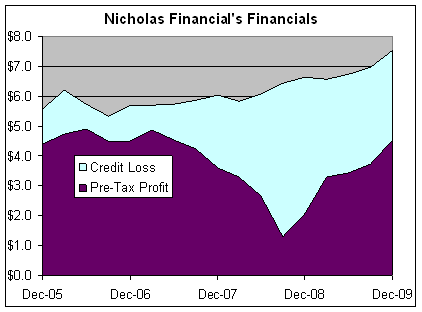
I think it’s interesting that when you combine the two, you can see that NICK’s business appears to be fairly stable. You can also see that the credit loss provisions are declining rapidly. If they get back to the level of 2006 then NICK will be much more profitable.
If the credit loss provisions were to run at the same rate today as they did in 2006, that would be an extra $2 million a quarter in pre-tax profits. Roughly speaking, that’s about 10 cents a share after taxes.
On top of that, there’s an acceleration effect. The better NICK’s business is now, the better it will be in the future. That’s because the more money going to the bottom line means that NICK will have more money to grow its portfolio.
A lot depends on how well the economy improves. If things keep going as they are now, then NICK should earn at $1 a share this year, with the ability to earn as much as $1.20 a share. That’s not bad for a stock going for $7.50 a share. -
Happy Birthday Mr. Bull!
Eddy Elfenbein, March 9th, 2010 at 10:29 am
On the first anniversary of the bull market, E.S. Browning looks at the valuation debate between economists Robert Shiller and Jeremy Siegel. Not surprisingly, Dr. Shiller thinks the stock market is expensive and Dr. Siegel thinks it’s cheap.
Both men have held their positions for quite some time. For the last decade, Shiller has clearly won the debate (while Dr. Siegel has made some sloppy mistakes).
Despite Shiller’s accuracy, I’m skeptical of his methodology (after all, a person can be right for the wrong reasons). He relies on the market’s P/E Ratio with earnings going back 10 years. That seems too far for me. Plus, I suspect (both I’m not convinced) that earnings multiples need to be higher compared with decades ago. Shiller is very good at getting tons of data, often from many decades ago, but I’m not so sure such long-term comparisons are helpful. The economy and markets are quite different from the 19th century. Stocks are much safer compared with bonds and that difference should be reflected in valuations.
In fact, higher earnings multiples are nothing new for the market provided that you ignore the inflation racked period from 1966 to 1982. Earnings multiples started to rise in the 1950s and reached very elevated levels in the early 1960s. I think people forget that because the market didn’t suffer a severe reckoning until the 1970s (though there were some painful episodes in between).
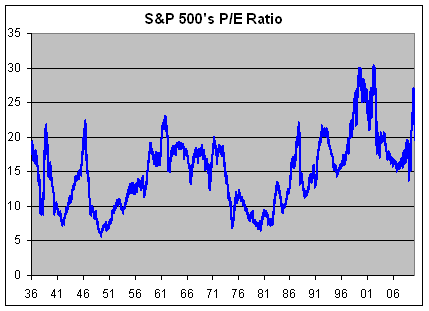
Once inflation started creeping into the economy, interest rates soared and earnings multiples took a tumble. However, once Paul “Big Paul” Volcker squeezed inflation from the economy, multiples slowly resumed their climb back to JFK levels. The problem with that analysis, of course, is that you’re adjusting for a heck of a lot of data. So has the normal level for P/E Ratios been around 18 or so for the past 50 years with the inflation era as an aberration? Or are there natural 15 to 20 year periods of multiple expansion and compression? I lean toward the first, but I’m far from certain.
Siegal’s research centers around the fact that stocks have returned 7% a year adjusted for inflation. I’ve used that figure myself many times and it’s interesting to see how we’re doing against the long-term trend. In fact, when you adjust the market’s total return against a 7% trend line, it looks suspiciously like a P/E Ratio chart.
The problem with this method is that it assumes past data is an unbroken trend and all subsequent deviations have been corrected by reversions to the mean. That’s where I hold up a red flag. On top of that, the deviations from the long-term trend are very extreme. If the market can be so vastly out-of-whack from where it should be and for so long, then what’s the point? As an investor, I want to know what looks good right now.
My view is that I’m leery of all market forecasts. I tend to be on the bullish side simply because long-term interest rates continue to be low (Moody’s AAA Corporate Bond Index is currently around 5.2%), the market doesn’t expect a major resurgence of inflation anytime soon (the TIPs spread is fairly quiet) and the yield curve continues to be very wide (all of the market’s capital gains have come when the 3-month/10-year Treasury spread is over 65 basis points—the spread is currently at 355 points).
Still, I’m not investing in the entire market. My advice for investors continues to be to focus on high-quality stocks. The market’s dislocation has left us some bargains. Some of my favorite stocks include AFLAC (AFL), Nicholas Financial (NICK), Dean Foods (DF) and Reynolds American (RAI). -
Missing Home Depot
Eddy Elfenbein, March 8th, 2010 at 12:15 pmUgh, how did I not see Home Depot (HD)? The stock is at a new 52-week high today.
Actually, I did see it but still didn’t pull the trigger. These are the trades that really annoy me. Here’s what I wrote last June after HD raised guidance:Last year, HD earned $1.78 a share. In May, the company said that it expects to see EPS fall by 26% and sales to fall by 9%. That translates to full-year earnings of $1.32. Today they said to expect EPS to fall by 20% to 26%. A 20% drop works out to $1.42 which is slightly above Wall Street’s consensus of $1.40.
Make no mistake, this isn’t great news but it’s not awful and all the news until now has been awful. HD’s earnings peaked in 2007 at $2.83 a share so we’re going to see earnings fall in half—so has the stock price.
At its current price, I wouldn’t say Home Depot is a good buy, but it’s not unreasonable to see year-over-year earnings increases within a few quarters. If there’s more good news from HD, it could be a good buy before the end of the year.The good news did come. HD beat earnings in August, November and a very nice beat a few weeks ago (24 cents per share vs. 17 cents per share), but moron me didn’t step it up.
The shares dipped below $25 in early November and it’s been off to the races ever since. Since November 4, HD is up 28% compared with 9% for the S&P 500. I let that one get away.
-
Archives
- July 2026
- June 2026
- May 2026
- April 2026
- March 2026
- February 2026
- January 2026
- December 2025
- November 2025
- October 2025
- September 2025
- August 2025
- July 2025
- June 2025
- May 2025
- April 2025
- March 2025
- February 2025
- January 2025
- December 2024
- November 2024
- October 2024
- September 2024
- August 2024
- July 2024
- June 2024
- May 2024
- April 2024
- March 2024
- February 2024
- January 2024
- December 2023
- November 2023
- October 2023
- September 2023
- August 2023
- July 2023
- June 2023
- May 2023
- April 2023
- March 2023
- February 2023
- January 2023
- December 2022
- November 2022
- October 2022
- September 2022
- August 2022
- July 2022
- June 2022
- May 2022
- April 2022
- March 2022
- February 2022
- January 2022
- December 2021
- November 2021
- October 2021
- September 2021
- August 2021
- July 2021
- June 2021
- May 2021
- April 2021
- March 2021
- February 2021
- January 2021
- December 2020
- November 2020
- October 2020
- September 2020
- August 2020
- July 2020
- June 2020
- May 2020
- April 2020
- March 2020
- February 2020
- January 2020
- December 2019
- November 2019
- October 2019
- September 2019
- August 2019
- July 2019
- June 2019
- May 2019
- April 2019
- March 2019
- February 2019
- January 2019
- December 2018
- November 2018
- October 2018
- September 2018
- August 2018
- July 2018
- June 2018
- May 2018
- April 2018
- March 2018
- February 2018
- January 2018
- December 2017
- November 2017
- October 2017
- September 2017
- August 2017
- July 2017
- June 2017
- May 2017
- April 2017
- March 2017
- February 2017
- January 2017
- December 2016
- November 2016
- October 2016
- September 2016
- August 2016
- July 2016
- June 2016
- May 2016
- April 2016
- March 2016
- February 2016
- January 2016
- December 2015
- November 2015
- October 2015
- September 2015
- August 2015
- July 2015
- June 2015
- May 2015
- April 2015
- March 2015
- February 2015
- January 2015
- December 2014
- November 2014
- October 2014
- September 2014
- August 2014
- July 2014
- June 2014
- May 2014
- April 2014
- March 2014
- February 2014
- January 2014
- December 2013
- November 2013
- October 2013
- September 2013
- August 2013
- July 2013
- June 2013
- May 2013
- April 2013
- March 2013
- February 2013
- January 2013
- December 2012
- November 2012
- October 2012
- September 2012
- August 2012
- July 2012
- June 2012
- May 2012
- April 2012
- March 2012
- February 2012
- January 2012
- December 2011
- November 2011
- October 2011
- September 2011
- August 2011
- July 2011
- June 2011
- May 2011
- April 2011
- March 2011
- February 2011
- January 2011
- December 2010
- November 2010
- October 2010
- September 2010
- August 2010
- July 2010
- June 2010
- May 2010
- April 2010
- March 2010
- February 2010
- January 2010
- December 2009
- November 2009
- October 2009
- September 2009
- August 2009
- July 2009
- June 2009
- May 2009
- April 2009
- March 2009
- February 2009
- January 2009
- December 2008
- November 2008
- October 2008
- September 2008
- August 2008
- July 2008
- June 2008
- May 2008
- April 2008
- March 2008
- February 2008
- January 2008
- December 2007
- November 2007
- October 2007
- September 2007
- August 2007
- July 2007
- June 2007
- May 2007
- April 2007
- March 2007
- February 2007
- January 2007
- December 2006
- November 2006
- October 2006
- September 2006
- August 2006
- July 2006
- June 2006
- May 2006
- April 2006
- March 2006
- February 2006
- January 2006
- December 2005
- November 2005
- October 2005
- September 2005
- August 2005
- July 2005
 Eddy Elfenbein is a Washington, DC-based speaker, portfolio manager and editor of the blog Crossing Wall Street. His