Archive for April, 2010
-
Starbucks: The Turnaround Continues
Eddy Elfenbein, April 22nd, 2010 at 7:49 am
One of the best investment opportunities is the Turnaround Stock. The major problem with the Turnaround Stock is that the real deal is very, very hard to find.
In business, success breeds complacency. You see it all the time. Lots of good companies find themselves running into trouble, and soon they start losing market share and watching their profit margins fall. Once trouble comes, it’s not hard for a company to announce a restructuring effort, but it’s very hard to pull one off. What’s worse is that shareholders are notoriously impatient and that often hinders a turnaround effort.
I like to follow Starbucks (SBUX) because it’s a very good example of a company facing their problems and doing something bold about them. The company greatly over-expanded and soon, their same-store sales started to fall. Starbucks fired the CEO, rolled up its sleeves and dramatically cut back on the numbers of stores.
Earnings-per-share peaked in 2007 at 87 cents, then fell to 71 cents in 2008 and rebounded to 80 cents in 2009. The stock plunged from $40 in 2006 to just $7 by November of 2008. That’s the kind of thing shareholders tend to notice.
Well, Starbucks has come a long way. The company just reported earnings and business continues to improve. The company earned 29 cents a share for their fiscal Q2 compared with 16 cents a year ago. The details of the report are pretty good. Net revenues rose 9%. Compared stores sales increased 7%. Most impressively, SBUX’s operating margin rose from 10.4% a year ago to 17.8% this year. Whenever you find expanding margins, take notice!
Starbucks also said they’re increasing their full-year guidance (which is already half over) to $1.19 to $1.22 a share. This is the second time they’ve raised full-year guidance. In November, Starbucks said to expect 92 to 96 cents a share. Then in January, they said to expect $1.02 to $1.05 a share. I like this trend.
Let’s think about this. In November of 2008, SBUX was going for less than nine times what the company earned between September 2008 and September 2009, and less than six times what they’ll probably earn in the 12 months after that. The company also recently paid out its first-ever dividend.
The shares are now up more than 250% from their low 18 months ago. If anyone needs me, I’ll be kicking myself for missing this one. -
Large-Caps Do Well Before Options Expiration
Eddy Elfenbein, April 21st, 2010 at 11:18 pmOver 1983 to 2008, we find that large-cap stocks with actively traded options tend to have substantially higher average weekly returns during option-expiration weeks (ending on a month’s third-Friday), with consistent subperiod results. This empirical regularity is also evident in large-cap-dominated stock portfolios. Further, over the 1996 to 2008 period with available Option Metrics data, we find that the average weekly stock returns for option-expiration weeks tend to be appreciably larger for option-expiration weeks that also experience a relatively high option trading volume, relative to the underlying stock trading volume. In contrast, the average weekly returns for the option-expiration week are not much different than other weeks for smaller-cap stock portfolios, which contain stocks with relatively less option trading activity. Further, for our sample of large-cap stocks, the average weekly stock returns for the third-Friday of a calendar month are not different than other weeks for a pre-option-market sample over 1948 to 1972. We provide additional evidence that, along with the option market evidence in Lakonishok, Lee, Pearson, and Poteshman (2007), suggests that the sizable written call activity from non-market makers may contribute towards understanding our empirical findings.
-
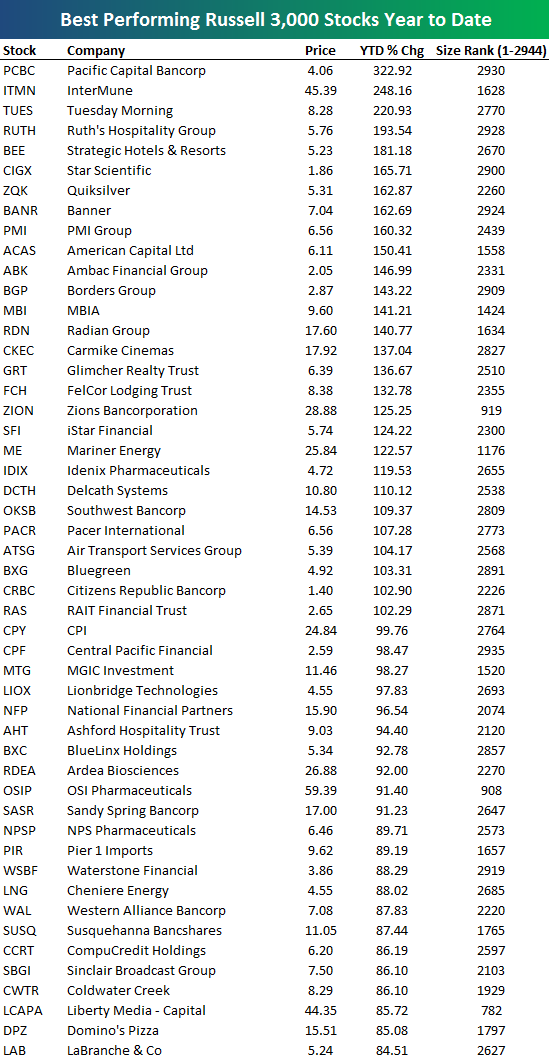
The Top Performing Russell 3000 Stocks YTD
Eddy Elfenbein, April 21st, 2010 at 5:39 pmIt’s still earlier, but Bespoke Investment Group lists the best-performing stocks in the Russell 3000 (^RUA) for 2010. Here’s a look:
-
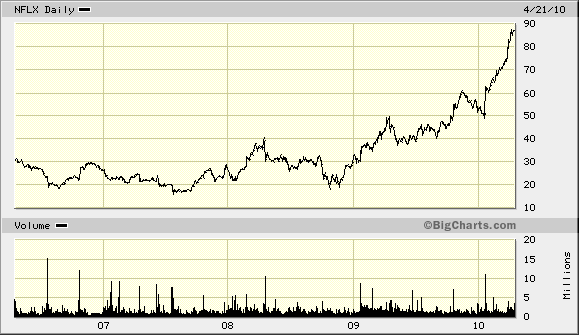
Netflix Earns 59 Cents a Share
Eddy Elfenbein, April 21st, 2010 at 4:41 pmYesterday I said that Netflix (NFLX) was an awful stock to buy, and it looks like the market may finally be agreeing with me. The company reported outstanding quarterly results, but the stock is down in the after-hours market. I won’t say “I told you so” even though I, in fact, told you so.
The problem isn’t NFLX’s business which is doing extremely well. It’s that the valuation is so high, there’s almost nothing Netflix can do to justify the sky-high share price.
Let’s run through some of the numbers. After the bell, Netflix reported Q1 earnings of 59 cents a share, five cents more than Wall Street was expecting. In January, the company said to expect Q1 EPS between 47 and 58 cents, so they even beat their top-end. A year ago, they earned 37 cents a share. Revenues rose 25.3% to $493.7 million. What else can I say? Businesswise, this was an outstanding quarter.
For Q2, Netflix said to expect EPS between 62 and 73 cents. For all of 2010, they raised their EPS range from $2.28 to $2.50, to $2.41 to $2.63. That’s impressive but I’d hardly call it unexpected. This stock is still way, way WAY overpriced.
Netflix continues to be a Strong Sell.
Update: OK, now NFLX is up slightly after-hours.
-
The Fed Paid $47.4 Billion to the U.S. Treasury
Eddy Elfenbein, April 21st, 2010 at 3:23 pmOne of the more unhinged conspiracy theories is that the Federal Reserve is a private bank. Even noted monetary economists Spencer and Heidi have commented on this (warnings: the video will slaughter your brain cells — you’ve been warned).
Unfortunately, it’s not true. Everything the Fed makes over 6% goes right to Uncle Sam and last year it was a nice haul.Taxpayers got a record $47.4 billion last year from the Federal Reserve, new documents released Wednesday showed.
The payment to the Treasury Department is slightly higher than the $46.1 billion first estimated in January. The new figure is based on more complete information contained in audited financial statements for the Fed’s 12 regional banks and related units.
The amount handed over to Treasury last year is $15.7 billion more_ or a 50 percent increase — from 2008, the Fed says.
The bigger windfall to taxpayers reflects gains from the Fed’s efforts to fight the financial crisis and revive the economy. Critics have worried that the Fed’s actions could put taxpayers at risk by reducing the amount turned over to Treasury coffers.
Interest earned from the Fed’s portfolio of mortgage securities came to $20.4 billion last year. The Fed had bought mortgage securities from Fannie Mae and Freddie Mac to lower mortgage rates and bolster the housing market. The program — a centerpiece of the Fed’s efforts to turn around the economy — ended last month.
Two programs the Fed set up during the crisis to ease credit clogs, along with assets it took over with the bailouts of Bear Stearns and American International Group in 2008, generated net earnings of $5.6 billion last year. That marked a turnaround from the net loss of $1.7 billion in 2008.
Of those two crisis-era programs, one involved strengthening the commercial paper market, a crucial short-term financing mechanism companies rely on to pay for everything from salaries to supplies. The other was designed to spur more lending to consumers and small businesses. Virtually all of the Fed’s crisis-era programs have wound down. The one program still in place, which aims to aid the troubled commercial real-estate market, will shut down at the end of June. -
Where In the Cycle Are We?
Eddy Elfenbein, April 21st, 2010 at 2:51 pmOne of the quick-and-dirty metrics I like to look at is the Morgan Stanley Cyclical Index (^CYC) divided by the S&P 500 (^SPX). The Cyclical Index is composed on stocks that are closely tied to the economic cycle. This means industries like autos, chemicals and mining.
When we divided these two indexes, we can tell if cyclicals are outperforming or underperforming. The thing about cyclicals is that they, well, move in cycles. Check out the chart below:
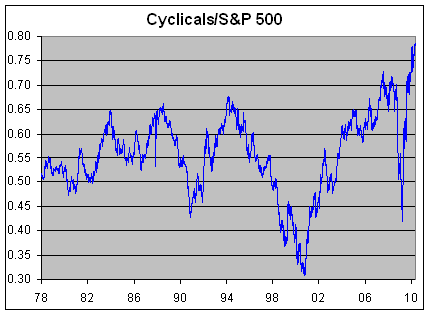
As you can see, there’s historically been a consistent up-and-down wave that averages a few years. This usually, but not always, corresponds with how well the economy is doing. Investors favor cyclicals during the good times, and flee them during the rough patches.
I urge you not to place too much faith in this metric, but I want to show you that the market does, in fact, move in cycles. These are powerful and once the market is locked it, the cycle can last for some time. Therefore it’s important for us to understand where we are in a cycle.
On top of that, the cycle has a double-whammy effect since the market generally does much better when cyclicals are outperforming, meaning they’re outperforming a market that’s already doing well (note the bottoms in 1982, 1990 and March 2009).
You can really see how the last 18 months have dramatically impacted cyclicals. The ratio held up fairly well until September 17, 2009. Within six months, that ratio dropped from 0.7 to 0.42. The Cyclical Index dropped from 871 on September 19 to 283 by March 9. Youch, that’s a staggering loss so you can see that the non-cyclicals provided some shelter from the storm (though not as good as cash).
But once the ratio hit bottom, cyclicals put on an explosive rally. Although the Cyclical Index is still well-below its high from 2007, the ratio has surpassed its high and has gone on to make several all-time highs. That’s about the shortest cycle I’ve ever seen. In fact, it was more like a panic mini-cycle. Last Thursday (pre-Fab), the ratio made its most recent all-time high of 0.786.
Picking cycle peaks is a tricky business and I won’t attempt to do so now, but I’m on the lookout for a harsh drop off in the Cyclical Ratio. Once it gets going, it could down, down, down for a few years. -
Abbott Labs Lowers Guidance
Eddy Elfenbein, April 21st, 2010 at 10:26 amI’m a big fan of Abbott Labs (ABT), the diversified healthcare company. It’s one of those few companies that consistently churns out steadily growing earnings.
Here are the EPS numbers since 2003; $2.05, $2.27, $2.50, $2.53, $2.84, $3.32 and $3.71. That’s what I like to see, steady increase after steady increase. Except for one bum year in 2006 when they only made $2.53 a share, the rest of the earnings increases were in the double digits.
In January, Abbott said to expect earnings for this year to fall between $4.20 and $4.25 a share. This doesn’t include a 28-cent charge for some acquisition costs and other items.
This morning, the company reported Q1 earnings of 81 cents a share compared with 73 cents a share a year ago. That’s about the growth rate we’ve come to expect from ABT. Sales were up 15%.
Like other healthcare companies, Abbott lowered its full-year guidance due to Obamacare. The company now sees full-year earnings-per-share ranging between $4.13 and $4.18 which is just seven cents off each end. The midpoint is still about 12% higher than last year’s earnings.
I really like Abbott but I’d like to see if come down a little bit more (say, below $50) before I’d call it a really good buy. -
Gilead Takes a Dive
Eddy Elfenbein, April 21st, 2010 at 10:17 amIt looks like I was wrong about Gilead (GILD) shaking off yesterday’s earnings report. The shares are currently down about 10% this morning. Gilead was also downgraded at Piper Jaffray. I don’t quite get that but I learned a long time ago, never argue with an angry market. I’m not sure what the market expects from them but I still like the stock.
-
U.S. to Get New $100 Bill
Eddy Elfenbein, April 21st, 2010 at 8:39 am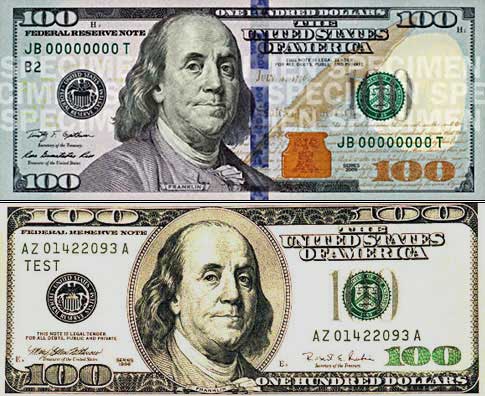
Cool.Officials from the U.S. Department of the Treasury, the Board of Governors of the Federal Reserve System and the United States Secret Service today unveiled the new design for the $100 note. Complete with advanced technology to combat counterfeiting, the new design for the $100 note retains the traditional look of U.S. currency.
“As with previous U.S. currency redesigns, this note incorporates the best technology available to ensure we’re staying ahead of counterfeiters,” said Secretary of the Treasury Tim Geithner.
“When the new design $100 note is issued on February 10, 2011, the approximately 6.5 billion older design $100s already in circulation will remain legal tender,” said Chairman of the Federal Reserve Board Ben S. Bernanke. “U.S. currency users should know they will not have to trade in their older design $100 notes when the new ones begin circulating.”
There are a number of security features in the redesigned $100 note, including two new features, the 3-D Security Ribbon and the Bell in the Inkwell. These security features are easy for consumers and merchants to use to authenticate their currency.
The blue 3-D Security Ribbon on the front of the new $100 note contains images of bells and 100s that move and change from one to the other as you tilt the note. The Bell in the Inkwell on the front of the note is another new security feature. The bell changes color from copper to green when the note is tilted, an effect that makes it seem to appear and disappear within the copper inkwell.
“The new security features announced today come after more than a decade of research and development to protect our currency from counterfeiting. To ensure a seamless introduction of the new $100 note into the financial system, we will conduct a global public education program to ensure that users of U.S. currency are aware of the new security features,” said Treasurer of the United States Rosie Rios.
“For 145 years, the men and women of the United States Secret Service have worked diligently to protect the integrity of U.S. currency from counterfeiters,” said Director Mark Sullivan. “During that time, our agency has evolved to keep pace with the advanced methodologies employed by the criminals we pursue. What has remained constant in combating counterfeiting, however, is the effectiveness of consumer education initiatives that urge merchants and customers to examine the security features on the notes they receive.”
Although less than 1/100th of one percent of the value of all U.S. currency in circulation is reported counterfeit, the $100 note is the most widely circulated and most often counterfeited denomination outside the U.S.
“The $100 is the highest value denomination that we issue, and it circulates broadly around the world,” said Michael Lambert, Assistant Director for Cash at the Federal Reserve Board. “Therefore, we took the necessary time to develop advanced security features that are easy for the public to use in everyday transactions, but difficult for counterfeiters to replicate.”
“The advanced security features we’ve included in the new $100 note will hinder potential counterfeiters from producing high-quality fakes that can deceive consumers and merchants,” said Larry R. Felix, Director of the Treasury’s Bureau of Engraving and Printing. “Protect yourself – it only takes a few seconds to check the new $100 note and know it’s real.”
The new design for the $100 note retains three effective security features from the previous design: the portrait watermark of Benjamin Franklin, the security thread, and the color-shifting numeral 100.
The new $100 note also displays American symbols of freedom, including phrases from the Declaration of Independence and the quill the Founding Fathers used to sign this historic document. Both are located to the right of the portrait on the front of the note.
The back of the note has a new vignette of Independence Hall featuring the rear, rather than the front, of the building. Both the vignette on the back of the note and the portrait on the front have been enlarged, and the oval that previously appeared around both images has been removed. -
Earnings from Stryker and Gilead
Eddy Elfenbein, April 20th, 2010 at 5:23 pmThe stock market continues to recover from last Friday’s sell-off. The S&P 500 is now just slightly below its pre-Fab high from last Thursday. Our Buy List also continues to do well. We were up 0.72% today to bring us up to +14.02% for the year (not including dividends).
Two of our Buy List stocks reported after the bell (JNJ reported earlier). Gilead Sciences (GILD) reported earnings of 99 cents per share which beat the Street’s estimate of 96 cents per share. Revenues jumped 36.3% to $2.09 billion. That’s a very good number. Gilead also lowered its sales outlook for the year by $200 million due to Obamacare. The stock is down about 2% in the after-hours market but I don’t expect that to last. The stock is now going for about 12 times this year’s earnings estimate. This is a very good buy.
The other news is that Stryker (SYK) reported earnings of 80 cents per share which was two cents more than the Street’s estimate. Revenues were up 12.4% to $1.8 billion. Stryker said it expects full-year EPS of $3.20 to $3.30. This reiterates the guidance they made in January. I always like to hear companies confirm guidance. This just lets shareholders know where they stand. Even saying “what we said before still stands” is nice to hear. For 2009, SYK earned $2.95 per share. Stryker is another very good buy.
-
Archives
- July 2026
- June 2026
- May 2026
- April 2026
- March 2026
- February 2026
- January 2026
- December 2025
- November 2025
- October 2025
- September 2025
- August 2025
- July 2025
- June 2025
- May 2025
- April 2025
- March 2025
- February 2025
- January 2025
- December 2024
- November 2024
- October 2024
- September 2024
- August 2024
- July 2024
- June 2024
- May 2024
- April 2024
- March 2024
- February 2024
- January 2024
- December 2023
- November 2023
- October 2023
- September 2023
- August 2023
- July 2023
- June 2023
- May 2023
- April 2023
- March 2023
- February 2023
- January 2023
- December 2022
- November 2022
- October 2022
- September 2022
- August 2022
- July 2022
- June 2022
- May 2022
- April 2022
- March 2022
- February 2022
- January 2022
- December 2021
- November 2021
- October 2021
- September 2021
- August 2021
- July 2021
- June 2021
- May 2021
- April 2021
- March 2021
- February 2021
- January 2021
- December 2020
- November 2020
- October 2020
- September 2020
- August 2020
- July 2020
- June 2020
- May 2020
- April 2020
- March 2020
- February 2020
- January 2020
- December 2019
- November 2019
- October 2019
- September 2019
- August 2019
- July 2019
- June 2019
- May 2019
- April 2019
- March 2019
- February 2019
- January 2019
- December 2018
- November 2018
- October 2018
- September 2018
- August 2018
- July 2018
- June 2018
- May 2018
- April 2018
- March 2018
- February 2018
- January 2018
- December 2017
- November 2017
- October 2017
- September 2017
- August 2017
- July 2017
- June 2017
- May 2017
- April 2017
- March 2017
- February 2017
- January 2017
- December 2016
- November 2016
- October 2016
- September 2016
- August 2016
- July 2016
- June 2016
- May 2016
- April 2016
- March 2016
- February 2016
- January 2016
- December 2015
- November 2015
- October 2015
- September 2015
- August 2015
- July 2015
- June 2015
- May 2015
- April 2015
- March 2015
- February 2015
- January 2015
- December 2014
- November 2014
- October 2014
- September 2014
- August 2014
- July 2014
- June 2014
- May 2014
- April 2014
- March 2014
- February 2014
- January 2014
- December 2013
- November 2013
- October 2013
- September 2013
- August 2013
- July 2013
- June 2013
- May 2013
- April 2013
- March 2013
- February 2013
- January 2013
- December 2012
- November 2012
- October 2012
- September 2012
- August 2012
- July 2012
- June 2012
- May 2012
- April 2012
- March 2012
- February 2012
- January 2012
- December 2011
- November 2011
- October 2011
- September 2011
- August 2011
- July 2011
- June 2011
- May 2011
- April 2011
- March 2011
- February 2011
- January 2011
- December 2010
- November 2010
- October 2010
- September 2010
- August 2010
- July 2010
- June 2010
- May 2010
- April 2010
- March 2010
- February 2010
- January 2010
- December 2009
- November 2009
- October 2009
- September 2009
- August 2009
- July 2009
- June 2009
- May 2009
- April 2009
- March 2009
- February 2009
- January 2009
- December 2008
- November 2008
- October 2008
- September 2008
- August 2008
- July 2008
- June 2008
- May 2008
- April 2008
- March 2008
- February 2008
- January 2008
- December 2007
- November 2007
- October 2007
- September 2007
- August 2007
- July 2007
- June 2007
- May 2007
- April 2007
- March 2007
- February 2007
- January 2007
- December 2006
- November 2006
- October 2006
- September 2006
- August 2006
- July 2006
- June 2006
- May 2006
- April 2006
- March 2006
- February 2006
- January 2006
- December 2005
- November 2005
- October 2005
- September 2005
- August 2005
- July 2005
 Eddy Elfenbein is a Washington, DC-based speaker, portfolio manager and editor of the blog Crossing Wall Street. His