The Dow Loses 531 Points
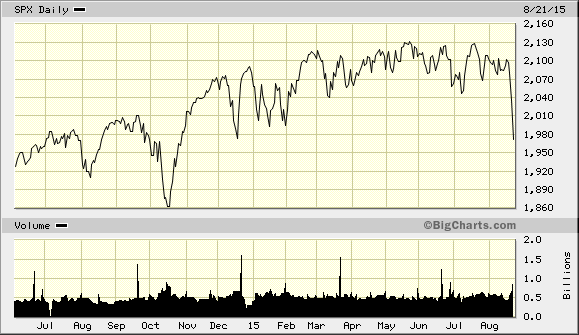
On Friday, the S&P 500 plunged 3.19% for its worst loss in nearly four years. The index lost 64.84 points which is its eighth-largest point loss ever. This was the first 3% loss for the index since November 9, 2011. To give you an idea how much less volatile the market has become, in the four years prior to that, there were 46 drops of more than 3%.
In Friday’s newsletter, which I wrote before the opening bell, I said “While I don’t believe the overall market is in trouble, I would be wary of sectors like high-priced tech names. I’d also steer clear of many biotech stocks.” I still hold that view.
Make no mistake, the action on Friday was ugly. Large-cap tech stocks were especially hard hit. Investor favorites like Apple (AAPL), Netflix (NFLX), Gilead (GILD) and Starbucks (SBUX) were all down more than 5%.
The Nasdaq Composite, which has many tech stocks, was down 3.52%. The Nasdaq 100, which has the largest nonfinancial stocks on the Nasdaq, was down 4.28%. In the last three days, the Nasdaq 100 has lost 7.59%. That’s brutal.
Prior to this selloff, many observers noted the “stealth correction,” meaning that a growing number of stocks were already more than 20% below their 52-week highs. There are now 147 stocks in the S&P 500 that are more than 20% off their high.
The S&P 500 closed Friday at 1,970.82. That’s the lowest close since October 27, 2014. Interestingly, small-caps held up unusually well. In fact, this was one of their best out-performance days in years. The Russell 2000 dropped 1.34% which beat the S&P 500 by 185 basis points. That’s huge. The Small-Cap Value ETF (IWN) was only down 0.96%.
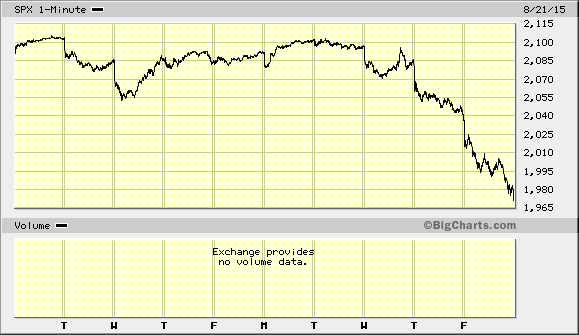
I recently wrote about how the market climbs slowly, but falls suddenly, and you can certainly see that effect in last week’s market. A little after 10 am the market was down just 0.55% but the selling quickly accelerated. Soon people were selling because other people were selling, and that led to still more selling.
Our Buy List lost 3.63% on Friday which was 44 basis points worse than the S&P 500. Almost all of the underperformance was due to Ross Stores (ROST). We knew Ross was going to be bad thanks to the weak guidance. The stock dropped 9.5% to close at exactly $50 on the nose. But the stock is still higher than it was seven weeks ago. Microsoft (MSFT) was one of the large-cap tech stocks that was dinged hard. MSFT lost 5.67% on Friday. I see that Ford Motor (F) fell to $13.86 per share. That’s a yield of 4.33%.
There was direct catalyst for Friday’s selloff. The closest was an unexpectedly poor purchasing managers index from China. This has come on the heels of other data suggesting rough economic news out of China. That could hurt a lot of major tech companies. Poor Apple is down to a market value of just $603 billion. The S&P 500 is now going for 15 times next year’s earnings, although some of next year’s estimate will probably come down some.
Let’s also remember that downdrafts like this are quite common. The S&P 500 dropped 7.4% between September 18 and October 15. It lost another 4.9% between December 5 and December 16. Since the bull market started in 2009, the S&P 500 has dropped more than 5% from its high 12 times. All 12 were reversed. Now we’re at #13.
Let me add that Friday’s selloff challenges the idea of a “safe haven.” The miners index (^XAU) dropped 2.94%. Investors didn’t seek safety in size, but sought safety in small stocks. West Texas crude fell to just $40.29 per barrel. The Volatility Index (^VIX) jumped 46% on Friday. I expect to see more volatility next week before things calm down.
Posted by Eddy Elfenbein on August 23rd, 2015 at 2:44 pm
The information in this blog post represents my own opinions and does not contain a recommendation for any particular security or investment. I or my affiliates may hold positions or other interests in securities mentioned in the Blog, please see my Disclaimer page for my full disclaimer.
-
Archives
- July 2026
- June 2026
- May 2026
- April 2026
- March 2026
- February 2026
- January 2026
- December 2025
- November 2025
- October 2025
- September 2025
- August 2025
- July 2025
- June 2025
- May 2025
- April 2025
- March 2025
- February 2025
- January 2025
- December 2024
- November 2024
- October 2024
- September 2024
- August 2024
- July 2024
- June 2024
- May 2024
- April 2024
- March 2024
- February 2024
- January 2024
- December 2023
- November 2023
- October 2023
- September 2023
- August 2023
- July 2023
- June 2023
- May 2023
- April 2023
- March 2023
- February 2023
- January 2023
- December 2022
- November 2022
- October 2022
- September 2022
- August 2022
- July 2022
- June 2022
- May 2022
- April 2022
- March 2022
- February 2022
- January 2022
- December 2021
- November 2021
- October 2021
- September 2021
- August 2021
- July 2021
- June 2021
- May 2021
- April 2021
- March 2021
- February 2021
- January 2021
- December 2020
- November 2020
- October 2020
- September 2020
- August 2020
- July 2020
- June 2020
- May 2020
- April 2020
- March 2020
- February 2020
- January 2020
- December 2019
- November 2019
- October 2019
- September 2019
- August 2019
- July 2019
- June 2019
- May 2019
- April 2019
- March 2019
- February 2019
- January 2019
- December 2018
- November 2018
- October 2018
- September 2018
- August 2018
- July 2018
- June 2018
- May 2018
- April 2018
- March 2018
- February 2018
- January 2018
- December 2017
- November 2017
- October 2017
- September 2017
- August 2017
- July 2017
- June 2017
- May 2017
- April 2017
- March 2017
- February 2017
- January 2017
- December 2016
- November 2016
- October 2016
- September 2016
- August 2016
- July 2016
- June 2016
- May 2016
- April 2016
- March 2016
- February 2016
- January 2016
- December 2015
- November 2015
- October 2015
- September 2015
- August 2015
- July 2015
- June 2015
- May 2015
- April 2015
- March 2015
- February 2015
- January 2015
- December 2014
- November 2014
- October 2014
- September 2014
- August 2014
- July 2014
- June 2014
- May 2014
- April 2014
- March 2014
- February 2014
- January 2014
- December 2013
- November 2013
- October 2013
- September 2013
- August 2013
- July 2013
- June 2013
- May 2013
- April 2013
- March 2013
- February 2013
- January 2013
- December 2012
- November 2012
- October 2012
- September 2012
- August 2012
- July 2012
- June 2012
- May 2012
- April 2012
- March 2012
- February 2012
- January 2012
- December 2011
- November 2011
- October 2011
- September 2011
- August 2011
- July 2011
- June 2011
- May 2011
- April 2011
- March 2011
- February 2011
- January 2011
- December 2010
- November 2010
- October 2010
- September 2010
- August 2010
- July 2010
- June 2010
- May 2010
- April 2010
- March 2010
- February 2010
- January 2010
- December 2009
- November 2009
- October 2009
- September 2009
- August 2009
- July 2009
- June 2009
- May 2009
- April 2009
- March 2009
- February 2009
- January 2009
- December 2008
- November 2008
- October 2008
- September 2008
- August 2008
- July 2008
- June 2008
- May 2008
- April 2008
- March 2008
- February 2008
- January 2008
- December 2007
- November 2007
- October 2007
- September 2007
- August 2007
- July 2007
- June 2007
- May 2007
- April 2007
- March 2007
- February 2007
- January 2007
- December 2006
- November 2006
- October 2006
- September 2006
- August 2006
- July 2006
- June 2006
- May 2006
- April 2006
- March 2006
- February 2006
- January 2006
- December 2005
- November 2005
- October 2005
- September 2005
- August 2005
- July 2005
 Eddy Elfenbein is a Washington, DC-based speaker, portfolio manager and editor of the blog Crossing Wall Street. His