The 2015 Buy List
The 2015 trading year is on the books, and I’m happy to report that we once again beat the market. This is the eighth time in the last nine years in which our Buy List has outpaced the S&P 500.
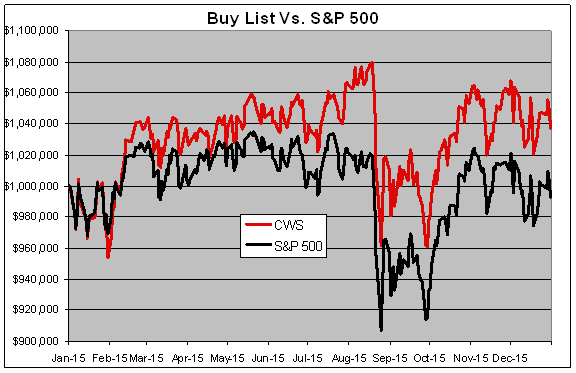
For the year, our Buy List gained 3.73% and including dividends, we were up 4.93%. The S&P 500 lost 0.73% for the year but gained 1.38% once you include dividends.
Our biggest gainer on the year was Hormel Foods (HRL) with a gain of 51.8%. Fiserv (FISV) was a distant second at 28.9%.
Our biggest loser was Bed Bath & Beyond (BBBY) with a loss of 36.7% followed by Qualcomm (QCOM), which lost 32.8%.
Counting the eBay/PayPal investment as one position, 12 of our 20 stocks made money this year. For people who care about such things, the “beta” of our Buy List was 0.9981. The correlation of the daily changes of the Buy List to the changes of the S&P 500 was 96.5%.
Over the ten-year history of the Buy List, our total compounded gain including dividends is 163.67%. That’s compared with 102.42% for the S&P 500. Our beta over 10 years comes to 0.9619.
The chart below details the Buy List’s performance. I’ve listed each stock, along with the number of shares and the starting and ending prices. For tracking purposes, I assume the Buy List is a $1 million portfolio that starts equally divided among the 20 stocks.
| Stock |
Shares |
12/31/14 |
Beginning |
12/31/15 |
Ending |
Profit/Loss |
| AFL |
818.4646 |
$61.09 |
$50,000.00 |
$59.90 |
$49,026.03 |
-1.95% |
| BBBY |
656.4264 |
$76.17 |
$50,000.00 |
$48.25 |
$31,672.57 |
-36.65% |
| BCR |
300.0840 |
$166.62 |
$50,000.00 |
$189.44 |
$56,847.91 |
13.70% |
| BLL |
733.4605 |
$68.17 |
$50,000.00 |
$72.73 |
$53,344.58 |
6.69% |
| CTSH |
949.4873 |
$52.66 |
$50,000.00 |
$60.02 |
$56,988.23 |
13.98% |
| EBAY |
890.9480 |
$23.6197 |
$21,043.92 |
$27.48 |
$24,483.25 |
16.34% |
| ESRX |
590.5279 |
$84.67 |
$50,000.00 |
$87.41 |
$51,618.04 |
3.24% |
| F |
3225.8065 |
$15.50 |
$50,000.00 |
$14.09 |
$45,451.61 |
-9.10% |
| FISV |
704.5230 |
$70.97 |
$50,000.00 |
$91.46 |
$64,435.67 |
28.87% |
| HRL |
959.6929 |
$52.10 |
$50,000.00 |
$79.08 |
$75,892.51 |
51.79% |
| MOG-A |
675.4019 |
$74.03 |
$50,000.00 |
$60.60 |
$40,929.36 |
-18.14% |
| MSFT |
1076.4263 |
$46.45 |
$50,000.00 |
$55.48 |
$59,720.13 |
19.44% |
| ORCL |
1111.8523 |
$44.97 |
$50,000.00 |
$36.53 |
$40,615.96 |
-18.77% |
| PYPL |
890.9480 |
$32.5003 |
$28,956.08 |
$36.20 |
$32,252.32 |
11.38% |
| QCOM |
672.6759 |
$74.33 |
$50,000.00 |
$49.985 |
$33,623.70 |
-32.75% |
| ROST |
1060.8954 |
$47.13 |
$50,000.00 |
$53.81 |
$57,086.78 |
14.17% |
| SBNY |
396.9514 |
$125.96 |
$50,000.00 |
$153.37 |
$60,880.44 |
21.76% |
| SNA |
365.6575 |
$136.74 |
$50,000.00 |
$171.43 |
$62,684.66 |
25.37% |
| SYK |
530.0541 |
$94.33 |
$50,000.00 |
$92.94 |
$49,263.23 |
-1.47% |
| WAB |
575.4402 |
$86.89 |
$50,000.00 |
$71.12 |
$40,925.31 |
-18.15% |
| WFC |
912.0759 |
$54.82 |
$50,000.00 |
$54.36 |
$49,580.45 |
-0.84% |
| Total |
|
|
$1,000,000.00 |
|
$1,037,322.75 |
3.73% |
Note that Ross Stores (ROST) split 2-for-1 on June 12. Also, eBay (EBAY) spun off shares of PayPal (PYPL) on July 6. Here are the details of the accounting for the spin-off.
Here’s how the Buy List performed throughout the year:
Posted by Eddy Elfenbein on December 31st, 2015 at 7:42 pm
The information in this blog post represents my own opinions and does not contain a recommendation for any particular security or investment. I or my affiliates may hold positions or other interests in securities mentioned in the Blog, please see my Disclaimer page for my full disclaimer.
-
 Eddy Elfenbein is a Washington, DC-based speaker, portfolio manager and editor of the blog Crossing Wall Street. His Buy List has beaten the S&P 500 by 72% over the last 19 years. (more)
-
-
![]()
-
Archives