Archive for January, 2016
-
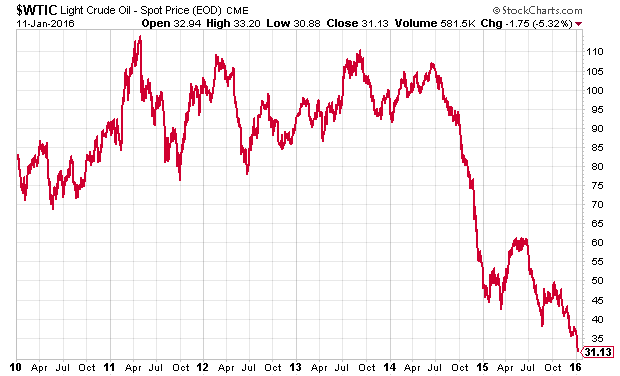
Oil at $31.13 per Barrel
Eddy Elfenbein, January 11th, 2016 at 6:21 pmIt’s not that oil is down — we know that. It’s that it keeps dropping. Today was another down day. Spot crude closed at $31.13.
The decline is simply remarkable. Some on Wall Street are talking about $20 oil.
-
New Small-Cap Low
Eddy Elfenbein, January 11th, 2016 at 12:04 pmThe Russell 2000 just dipped below its low from October 15, 2014. The index is at its lowest point since October 9, 2013.
The Russell 2000’s relative performance against the S&P 500 peaked on March 4, 2014. It’s been downhill ever since.
-
Buy List Updates
Eddy Elfenbein, January 11th, 2016 at 9:46 amHere are a few news items from the past week about our Buy List stocks that I wanted to pass along:
Undervalued Pick of the Day: Stericycle
Alliance Data Announces New Stock Repurchase Program
Cerner Upgraded by RBC Capital Mkts
Wells Fargo Upgraded by Citigroup
Microsoft Stock Poised For Yet Another Winning Year
Is Microsoft CEO Nadella’s Turnaround Strategy Working?
Ford Changes Pension Reporting, Sees Rise in 2015 Profit
-
Looking at Market Correlations
Eddy Elfenbein, January 11th, 2016 at 8:35 amHere’s some data I’ve been working on that I thought I’d share with you. Below is a table showing the correlations of the daily changes of the 10 S&P 500 sectors. (I apologize for the crowded data.) I’ve also included the daily changes for the S&P 500 and for our Buy List. The data only covers calendar year 2015.
Date Ene Disc Spl Fin HC Ind Tech Mats Tele Utes S&P 500 BL Energy 60.3% 56.8% 65.2% 53.8% 69.1% 59.0% 79.2% 57.0% 38.6% 73.1% 65.0% Discretion. 60.3% 81.8% 86.6% 80.3% 85.7% 84.3% 74.4% 70.8% 49.7% 92.9% 91.6% Staples 56.8% 81.8% 80.8% 75.3% 83.9% 78.0% 70.4% 73.0% 63.8% 88.3% 85.7% Financials 65.2% 86.6% 80.8% 76.1% 87.7% 83.2% 77.3% 75.2% 46.5% 93.3% 91.9% Healthcare 53.8% 80.3% 75.3% 76.1% 76.4% 76.8% 67.2% 58.1% 47.9% 87.0% 84.0% Industrials 69.1% 85.7% 83.9% 87.7% 76.4% 86.0% 84.8% 76.0% 54.3% 94.2% 91.3% Tech 59.0% 84.3% 78.0% 83.2% 76.8% 86.0% 74.7% 71.2% 45.8% 92.6% 90.0% Materials 79.2% 74.4% 70.4% 77.3% 67.2% 84.8% 74.7% 67.0% 44.9% 84.8% 79.3% Telecom 57.0% 70.8% 73.0% 75.2% 58.1% 76.0% 71.2% 67.0% 52.2% 78.2% 74.7% Utilities 38.6% 49.7% 63.8% 46.5% 47.9% 54.3% 45.8% 44.9% 52.2% 56.6% 52.3% S&P 500 73.1% 92.9% 88.3% 93.3% 87.0% 94.2% 92.6% 84.8% 78.2% 56.6% 96.5% Buy List 65.0% 91.6% 85.7% 91.9% 84.0% 91.3% 90.0% 79.3% 74.7% 52.3% 96.5% A few things to note.
First is how strongly stocks are correlated with one another. At least in the near-term. Even a low daily correlation is around 60% or 70%. This means that just by being a stock, you’ll get tossed around with whatever the market’s doing that day. This is actually good news for stock-pickers because it means that good stocks can get knocked down with everything else, thereby creating good bargains. The shorter the time period, the greater the impact of the overall market.
I also think it’s interesting how the Industrials have the highest correlation with the broader S&P 500. I’ve noticed this in previous years as well. In other words, the Industrials stand out by being the most similar to everyone else.
Oddly, I find that this makes sense yet I’m not sure why. Perhaps it’s that the Industrials lie at the middle C of the economy. While sectors like Energy or Finance can diverge from the broader economy, the Industrials are unlikely to because…well, that is the economy. I’m not exactly sure, but it’s not due to size. Industrials are big but not the biggest.
But this also means that if you wanted to build a cheap-but-somewhat-decent index, you could probably use as few as five major industrial stocks. By this, I mean companies like DuPont or 3M. Sure, it would be far from perfect, but considering how small it is, it would be pretty darn good.
Naturally, over the short term, a stock will reflect the broader market and its sector. But as time goes on, the value specific to each company would gradually move to the surface and the higher categories would lose importance. On the table, you can see how strongly correlated the Buy List is with the S&P 500 on a daily basis, yet after 12 months, we had no trouble separating ourselves from the market last year.
It’s interesting to see sector relationships in the market. For example, Energy and Materials are often closely related, yet Materials are usually closer to Industrials than Energy is. Staples and Healthcare are often close, but not so much last year. Tech is often a lone wolf, not much correlated with anyone. In that regard, it’s the opposite of Industrials.
I suspect that the numbers on the table for Utilities are unusually low. Last year was probably an aberration for the Ute sector. Typically, I’d expect a higher correlation with defensive sectors like Staples and Healthcare.
Finally, don’t overthink this table. I think it’s interesting but only in the sense that it gives us a glimpse at how the market behaves. None of these correlations is stable. The major lesson is that a powerful market trend can carry off any stock.
Morning News: January 11, 2016
Eddy Elfenbein, January 11th, 2016 at 7:04 amChinese Stocks Slip Again, Deepening Worries Over Beijing’s Handle on Crisis
EU Orders Belgium to Claw Back $763 Million Illegal Tax Breaks
Rand Slump May Force More Aggressive SARB Action as Risks Climb
Oil Seen Heading to $20 by Morgan Stanley on Dollar Strength
Insurers Say Costs Are Climbing as More Enroll Past Health Act Deadline
Yahoo’s Brain Drain Shows a Loss of Faith Inside the Company
Month After G.E. Deal Falters, Electrolux Chief Says He’ll Retire
ChemChina Buying KraussMaffei, a German Machinery Company, for $1 Billion
Ford’s Revolutionary FordPass App Aims Do For Mobility What iTunes Did For Music
Uber to Drop Prices in 80 Cities in the U.S. and Canada
Drugmakers Raise Prices Despite Criticisms
Chipotle Outbreaks Send Wall Street Searching for Price Bottom
Volkswagen Starts Down Difficult Road of Winning Back Americans
Jeff Miller: Is It Time To Buy The Dip?
Howard Lindzon: My 2016 Guesses…and of Course the Crash of 2016
Be sure to follow me on Twitter.
Declining Cyclicals
Eddy Elfenbein, January 8th, 2016 at 10:31 amI used to keep track of the Morgan Stanley Cyclical Index, but I think that index has been discontinued. No worries. Here’s a look at the relative strength of the three key cyclical sectors: Energy (black), Materials (blue) and Industrials (red).
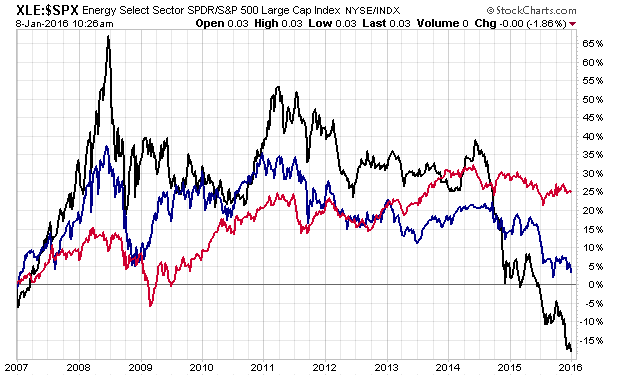
You can see how poorly Energy has done. Materials are down as well. Industrials have held up the best, but that may not last.
December Jobs Report +292K
Eddy Elfenbein, January 8th, 2016 at 9:29 amWe had a good jobs report this morning. The economy created 292,000 net new jobs last month. Plus, there were positive revisions for October and November.
The unemployment rate is steady at 5.0%. Splitting out the decimals, the unemployment rate is lower now than it was during the entire time from January 1974 through April 1997.
CWS Market Review – January 8, 2016
Eddy Elfenbein, January 8th, 2016 at 7:08 am“Everyone has the brainpower to make money in stocks. Not everyone has the stomach.” – Peter Lynch
Santa apparently decided to cancel his rally this year. Perhaps Wall Street has been naughty this year (believable). Through Thursday, the S&P 500 is already down 4.93% for the year. That’s the index’s worst four-day start in history!
The Dow is down over 910 points, or 5.27%, which is its worst four-day start as well. As rough as that’s been, the U.S. market has been a lot better than many overseas markets. Brand new “circuit breakers” in China shut down their stock market twice this week. In response, the authorities there decided to ditch the circuit breakers. In other words, the circuit breakers have themselves been circuit broken!
What’s going on? The answer is complicated, but most of it boils down to a spreading economic/fiscal mess in China. The good news is that this shouldn’t become a major problem for us. At least, not yet. The U.S. economy is not very dependent on China. The bad news is that some market jitters may hang around for a few more weeks.
In this issue, I’ll break it all down for you. I’ll also bring you up to speed on Bed Bath & Beyond’s (BBBY) Q3 earnings report. It wasn’t good, but we already knew not to expect too much. Still, I like the beaten-up stock here. More on that in a bit.
We also have Q4 earnings season coming our way. Next week, Wells Fargo (WFC) will be our first Buy List stock to report earnings for this season. The big bank has seen its shares pull back for the last few days. I’ll give a preview of what to expect. But first, let’s take a closer look at what’s been rattling Wall Street this week.
China Shakes the U.S. Stock Market
In America, the trading day begins at 9:30 am ET, but investors have recently adopted the habit of waiting for the market in China to open because that’s where all the drama has been.
At the start of this year, China unveiled new “circuit breakers” for its stock markets. The rules were simple: If any index fell by 5% in a day, trading would be suspended for 15 minutes so everyone could chill out. If the index fell by 7%, trading would be halted for the entire day.
Well, the authorities didn’t have to wait long. Trading was first halted on Monday. Then on Thursday, the 5% trigger was reached 13 minutes into the trading day. That gave everyone 15 minutes to relax. Then trading resumed for one minute before they hit the 7% barrier and trading was shut down for the rest of the day. Trading on Thursday lasted for all of 14 minutes.
You don’t have to be a rocket surgeon to figure out that people were dumping stocks ahead of the circuit breakers because they didn’t want to be caught holding their positions during a shutdown. So instead of calming the market as intended, the circuit breakers actually inflamed volatility. You may not be surprised to learn that China has now suspended those rules. In America, by the way, the exchanges aren’t shut down unless there’s a 20% plunge.
Let me caution you not to read too much into the Chinese market. Trading there is closer to a puppet show than an open market. I simply don’t trust how those markets operate, and there seems to be a lot of rigging going on. I don’t blame China. It’s a young stock market (only 25 years old). Ours was horribly manipulated for decades, and we still have work to do.
The catalyst for the drama in Chinese stocks is coming from the government’s willingness to let its currency, the yuan, depreciate. This is a big deal. The government knows that the economy is getting weak, so it needs its currency to adjust. At first, the government tried fiscal stimulus, but that was mostly a bust, so it shifted towards managing the currency,
It’s almost as if the government feels it can lower the bar on the yuan a few millimeters at a time. The Chinese government likes to think it can control everything, so it’s not used to dealing with the international currency markets. Not surprisingly, very smart currency traders saw what the PBOC (the Chinese Fed) was up to, and they beat them to the punch.
There are actually two markets for the yuan—the “onshore” official rate and the “offshore” more freely-traded rate. (Take a wild guess which one you ought to pay attention to.) Investors are betting that the government has just started devaluing the currency and that it’ll have to keep letting the yuan sink lower. The weaker yuan ought to help China’s exports. The problem is that there are enormous spillover effects. For example, purchasers of Chinese exports will demand discounts to reflect the cheaper yuan, and that could spark a currency war.
In November, the IMF added the yuan to its official basket of currency reserves. To borrow a term from the Mafia, that’s roughly the equivalent of being a “made currency.” You belong. You’re part of a crew. That probably gave cover to the government to start toying with the currency markets to help its economy.
Like I said, the government thinks it can lower the currency slightly each time, and no one in the world can predict what will come next. There’s a lot of smart money out there. To add some perspective, the volume of the global forex market is more than $5 trillion every day. The PBOC actually had to jump back in and start buying yuan just to stop the bleeding. With more than $3 trillion in currency reserves, they have plenty of ammo to fight this war. It’s hard for me to escape the conclusion that the PBOC is clueless about how bad the problem is and what to do about it.
All attempts at currency manipulation come to an end. Many of those endings are unpleasant. To be clear, not much of this drama affects us. Don’t let the news from China scare you out of buying U.S. stocks. The government leaders in China could do their citizens and the world a favor by learning to cede control to free enterprise. Now let’s take a look at our Buy List earnings report from this week.
Bed Bath & Beyond Earns $1.09 per Share
I know many readers were certain that I was going to give Bed Bath & Beyond (BBBY) its walking papers this year, but I decided to keep the home-furnishings store on the Buy List for another year. It’s true that BBBY has been a disappointment. The latest earnings warning certainly didn’t help things. But there’s always the issue of price, and I think BBBY’s current price is worth a buy.
After the market closed on Thursday, Bed Bath & Beyond reported earnings of $1.09 per share for its fiscal Q3 (September, October and November). That’s not that good, but it’s basically what we expected. Two weeks ago, the company had told us to expect earnings between $1.07 and $1.10 per share. BBBY earned $1.23 per share for last year’s Q3.
Quarterly sales rose 0.3% to just under $3 billion. The key metric to watch here is same-store sales. Initially, the company had been expecting same-store sales to rise between 1% and 3%. They later downgraded that to -0.4%. Thursday’s results confirmed the downgrade—Q3 same-store sales fell by 0.4%, but adjusted for currency, same-store sales were flat.
Now for their Q4 guidance (bear in mind that Q4 is nearly half over). BBBY sees same-store sales rising by 0% to 2%. They see earnings coming in between $1.72 and $1.86 per share. That’s actually not as bad as it could have been. Wall Street had been expecting $1.85 per share, but I suspect a lot of people on the Street had been expecting a much larger miss.
Since the company has already made $3.19 per share for the first three quarters of its fiscal year, the current guidance works out to a full-year range of $4.91 to $5.05 per share. That’s compared with $5.03 per share last year. Basically, the company has been having a flat year, which is also what much of the rest of the corporate world has had.
I should also mention share buybacks. BBBY has been gobbling up its own stock at a pretty fast clip. Diluted share count is down 11% in the past year. That certainly makes the per-share results look better. Some people think this is somehow cheating. I don’t see why, as long as your cash flow keeps on flowing. Still, I’d prefer the company pay out a cash dividend.
To be clear, Bed Bath & Beyond is having some business trouble, but they’re not in dire straits. Thursday’s close of $46.51 means the company is going for about nine times this year’s earnings. The important news here is that same-store sales growth seems to have bottomed out. Bed Bath & Beyond remains a buy up to $53 per share.
Preview of Fourth-Quarter Earnings Season
Fourth-quarter season kicks off next week. This is an important one for Wall Street because it could snap our four-quarter streak of declining earnings. I usually discount Wall Street’s consensus earnings projections except in the very near term.
Wall Street currently expects the S&P 500 to report earnings of $29.00 per share. That’s the index-adjusted figure (every one point in the S&P 500 is worth about $8.7 billion). That would give an increase of 8.41% over Q4 of 2014. Earnings had fallen in the previous four quarters by increasing amounts: 5%, 6%, 11% and 14%.
Despite the expected rebound for Q4, it looks like earnings slightly fell last year. For all of 2015, operating earnings are expected to drop by 5.9%. Yet if we ignore energy, earnings rose by 5.7%. The pain isn’t over for energy. For Q4, the Street expects earnings in the energy sector to fall by 59%. That’s on top of a 28% earnings drop for the previous Q4.
Given that oil fell this week to a 12-year low, I expect pain in the energy patch to continue a while longer. On Thursday, the spot price for West Texas Crude closed at $33.26 per barrel. Dear Lord! In the last 19 months, oil has dropped by almost 70%. Crude is now at its lowest price since February 11, 2004. Oil is also lower than where it was when it peaked during the energy crisis 36 years ago.
For 2016, Wall Street now expects the S&P 500 to earn $125.56 per share in 2016. That would be an increase of more than 18% over 2015’s bottom line. It also means the index is currently going for about 15.5 times this year’s earnings estimate. I wouldn’t say that’s obviously overpriced.
Wells Fargo Is a Buy up to $56 per Share
Shares of Wells Fargo (WFC) have been taking a surprising beating recently. The shares are down six days in a row for a loss of nearly 9%. I say that this is surprising because Wells is normally such a steady stock.
The company is due to report Q4 earnings before the opening bell next Friday, January 15. Wall Street currently expects Wells to report earnings of $1.03 per share which is only a one-penny increase over Q4 from 2014.
I’ve said many times that I think Wells is the best large bank in America. Unfortunately, this has been a tough environment for banks. It’s tough to make a living in a low-rate world. Also, Wells has had some bum loans in the energy sector.
On the plus side, the slowly-improving economy has helped its community-banking unit. Mortgages have been a drag, but that ought to get better. Wells is in much better shape than most banks. This report should reflect a quiet quarter for Wells which is good as far as I’m concerned. Good banking is boring. Wells Fargo remains a buy up to $56 per share.
Current Buy List Bargains
Thanks to the recent downturn, there are several compelling values on our Buy List. I especially like Ford Motor (F) below $13 per share. Ford currently yields 4.7%. Look for good earnings later this month.
I also like AFLAC (AFL) below $58 per share. The duck stock gets hurt by the strong yen, but they’ve shown how resilient their business is. AFLAC is going for about nine times 2016’s earnings.
Wabtec (WAB) looks quite good below $65 per share. The stock is down by more than one third since this summer. I’m expecting decent earnings.
Biogen (BIIB) is a nice value if you can get it below $290 per share. It’s one of the best names in a very weak sector. Don’t let the high share price scare you.
That’s all for now. I’m writing this on Friday morning ahead of the big jobs report. Now that the Fed has already raised interest rates, I think the monthly jobs reports aren’t quite as important as they were before. Still, the Street will be paying close attention. The current estimate for nonfarm payrolls is for an increase of 200,000. There’s a very good chance that the unemployment rates dipped below 5% for the first time in eight years. Be sure to keep checking the blog for daily updates. I’ll have more market analysis for you in the next issue of CWS Market Review!
– Eddy
Morning News: January 8, 2016
Eddy Elfenbein, January 8th, 2016 at 7:00 amWorld Bank Cuts Global Growth Forecasts
SNB Suffers Record 23 Billion-Franc Loss on Strong Currency
China State Funds Said to Buy More Shares After Market Rout
Maths, Not Meddling, May Explain End of Cuts in PBOC Yuan Rate
Job Market Remains Strong Even as U.S. Economy Slows
Millennials Are Outpacing Everyone in Retirement Savings
Apple Isn’t The Only Smartphone Maker That’s Hurting
Boeing Delivers Record Number of Commercial Jets
Chinese Imports Just Doomed Another 1,200 Jobs at Alcoa
Macy’s Woes Could Signal Trouble For Retailers
Hyundai to Make Santa Fe Sport SUV at Alabama Plant
Campbell Labels Will Disclose G.M.O. Ingredients
Cullen Roche: China, China, China
Joshua Brown: There’s Got To Be A Bull Case In Here Somewhere…
Be sure to follow me on Twitter.
Another Ugly Day
Eddy Elfenbein, January 7th, 2016 at 1:18 pmThe market is down again today. The Dow is off by more than 300 points and the S&P 500 is close to dipping below 1,950. It wasn’t that long ago that the market was close to setting a new all-time high.
The S&P 500 High Beta Index is already in bear market territory, meaning it’s down by over 20%. Looking at the S&P 500 Sectors, Energy and Materials are already in bear markets while Financials, Healthcare, Utilities and Industrials are down more than 10%.
-
Archives
- June 2026
- May 2026
- April 2026
- March 2026
- February 2026
- January 2026
- December 2025
- November 2025
- October 2025
- September 2025
- August 2025
- July 2025
- June 2025
- May 2025
- April 2025
- March 2025
- February 2025
- January 2025
- December 2024
- November 2024
- October 2024
- September 2024
- August 2024
- July 2024
- June 2024
- May 2024
- April 2024
- March 2024
- February 2024
- January 2024
- December 2023
- November 2023
- October 2023
- September 2023
- August 2023
- July 2023
- June 2023
- May 2023
- April 2023
- March 2023
- February 2023
- January 2023
- December 2022
- November 2022
- October 2022
- September 2022
- August 2022
- July 2022
- June 2022
- May 2022
- April 2022
- March 2022
- February 2022
- January 2022
- December 2021
- November 2021
- October 2021
- September 2021
- August 2021
- July 2021
- June 2021
- May 2021
- April 2021
- March 2021
- February 2021
- January 2021
- December 2020
- November 2020
- October 2020
- September 2020
- August 2020
- July 2020
- June 2020
- May 2020
- April 2020
- March 2020
- February 2020
- January 2020
- December 2019
- November 2019
- October 2019
- September 2019
- August 2019
- July 2019
- June 2019
- May 2019
- April 2019
- March 2019
- February 2019
- January 2019
- December 2018
- November 2018
- October 2018
- September 2018
- August 2018
- July 2018
- June 2018
- May 2018
- April 2018
- March 2018
- February 2018
- January 2018
- December 2017
- November 2017
- October 2017
- September 2017
- August 2017
- July 2017
- June 2017
- May 2017
- April 2017
- March 2017
- February 2017
- January 2017
- December 2016
- November 2016
- October 2016
- September 2016
- August 2016
- July 2016
- June 2016
- May 2016
- April 2016
- March 2016
- February 2016
- January 2016
- December 2015
- November 2015
- October 2015
- September 2015
- August 2015
- July 2015
- June 2015
- May 2015
- April 2015
- March 2015
- February 2015
- January 2015
- December 2014
- November 2014
- October 2014
- September 2014
- August 2014
- July 2014
- June 2014
- May 2014
- April 2014
- March 2014
- February 2014
- January 2014
- December 2013
- November 2013
- October 2013
- September 2013
- August 2013
- July 2013
- June 2013
- May 2013
- April 2013
- March 2013
- February 2013
- January 2013
- December 2012
- November 2012
- October 2012
- September 2012
- August 2012
- July 2012
- June 2012
- May 2012
- April 2012
- March 2012
- February 2012
- January 2012
- December 2011
- November 2011
- October 2011
- September 2011
- August 2011
- July 2011
- June 2011
- May 2011
- April 2011
- March 2011
- February 2011
- January 2011
- December 2010
- November 2010
- October 2010
- September 2010
- August 2010
- July 2010
- June 2010
- May 2010
- April 2010
- March 2010
- February 2010
- January 2010
- December 2009
- November 2009
- October 2009
- September 2009
- August 2009
- July 2009
- June 2009
- May 2009
- April 2009
- March 2009
- February 2009
- January 2009
- December 2008
- November 2008
- October 2008
- September 2008
- August 2008
- July 2008
- June 2008
- May 2008
- April 2008
- March 2008
- February 2008
- January 2008
- December 2007
- November 2007
- October 2007
- September 2007
- August 2007
- July 2007
- June 2007
- May 2007
- April 2007
- March 2007
- February 2007
- January 2007
- December 2006
- November 2006
- October 2006
- September 2006
- August 2006
- July 2006
- June 2006
- May 2006
- April 2006
- March 2006
- February 2006
- January 2006
- December 2005
- November 2005
- October 2005
- September 2005
- August 2005
- July 2005
 Eddy Elfenbein is a Washington, DC-based speaker, portfolio manager and editor of the blog Crossing Wall Street. His