CWS Market Review – March 29, 2019
“The conventional view serves to protect us from the painful job of thinking.”
– John Kenneth Galbraith
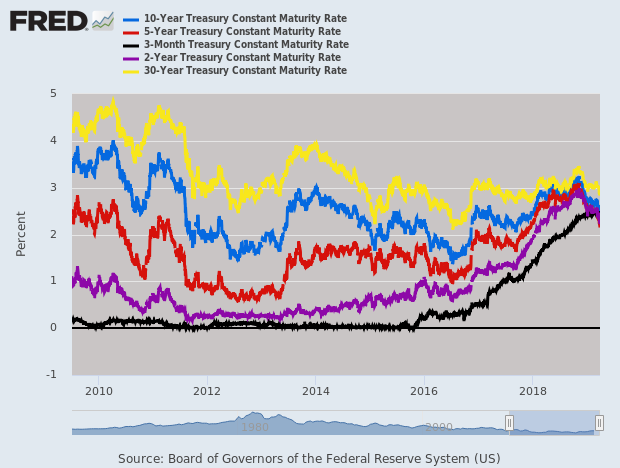
After ten years, the yield curve has finally gone flat. Ironically, this was caused by good economic news. A flat curve is a natural response to a growing economy, but the flat curve has some important implications for the economy, the stock market and our portfolios.
In this week’s CWS Market Review, we’ll take a deep dive into all things yield curve. I’ll also discuss the good earnings report from FactSet. The stock gapped up to a new 52-week high. I’ll also preview next week’s earnings report from RPM International, and I have a bunch of new Buy Below prices. But first, let’s look at what the yield curve has to say.
What Does the Flat Yield Curve Mean?
Wall Street has been in a tizzy over the yield curve. As we know, Wall Street loves to stress about something. Or anything. Wall Street’s favorite mode is being “concerned.” If need be, this can be upgraded to “distressed.” Most of the time, I tell you that this week’s “concern of the year” is over-rated and not to worry about it.
This is different. An inverted yield curve truly is a big deal. The hitch is that it’s not immediate. Let me take a step back. By yield curve, I mean the difference between short-term and long-term interest rates. Normally, the yield curve is upward sloping, meaning you get paid more the longer you lend your money. That makes sense, but every so often, the yield curve goes flat, or even gets inverted. That’s when short-term rates rise above long-term rates.
An inverted yield curve is one of the few good predictors of a bad economy. For a field with lots of stats, we still have little idea of how well the economy is doing at the moment. Economists have a terrible track record of predicting recessions, but the yield curve could have won a few Nobel Prizes based on its track record. The spread between the 2- and 10-year Treasuries has been an omen of bad times consistently for the last 35 years.
Check out this tidbit from MarketWatch:
Researchers at the San Francisco Fed say the 3-month/10-year curve is the most reliable indicator, while Cleveland Fed researchers note that inversions of that measure have preceded the past seven recessions with only two false positives — an inversion in late 1966 and a very flat curve in late 1998.
That’s way better than most economists.
To show you how much things have changed, in 2011, the 2/10 Spread reached 291 basis points. It’s now down to 16. The spread between the 10-year and three-month yield is currently negative by four basis points.
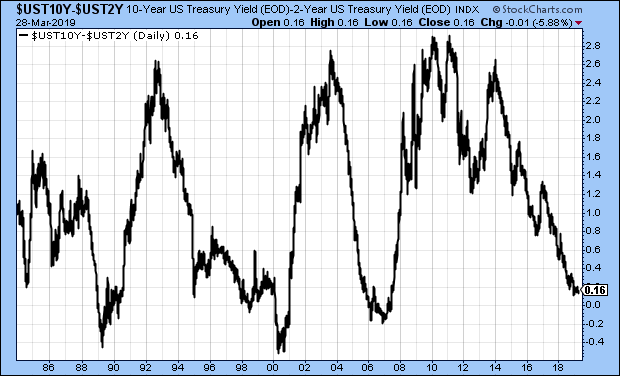
While the yield curve is important, I’ll caution you that it’s not an instant tripwire. Let’s look at some recent history. The 2/10 Spread inverted in May 1998. It then went back before becoming very inverted in 2000, but the recession didn’t officially begin until 2001. Even in the last recession, the 2/10 Spread inverted in late 2005. The recession didn’t start for two more years.
It’s a mistake to dismiss the yield curve as a technical indicator like the 200-day moving average. The yield curve has real world ramifications. A few years ago, I ran the numbers and found that the stock market does much better when the spread between the 90-day and 10-year Treasury yield is 121 basis points or more. If you’re a bank, an inverted curve means it’s not profitable to borrow short and lend long. (And yet, starting a bank in 2010 was probably one of the most profitable things you could do.)
In the 12 months following a negative 2/10 Spread, the economy has been in recession about 50% of the time. There is, however, the chance that the yield curve may have lost its predictive powers with the advent of the Fed’s new policies. These things can change. When we had a gold standard, inverted curves were the norm.
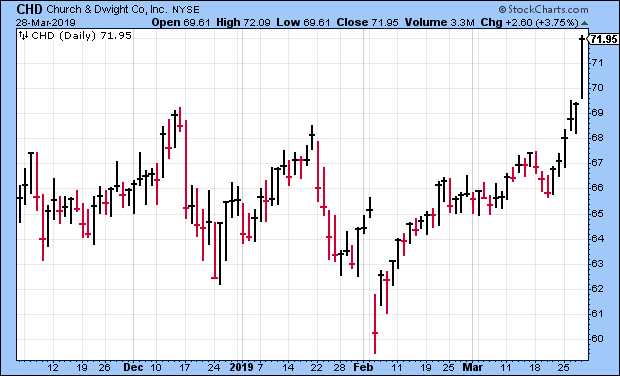
I don’t have any plans to alter our investing strategy. Our stocks are stronger than what a yield curve can do. With a flat curve, I would expect to see better valuations among defensive stocks. As I’ll explain later, stocks like Hershey (HSY) and Church & Dwight (CHD) have recently hit new highs. Think of it this way: an inverted yield curve is like rougher seas. If your ship is sturdy, then it doesn’t matter.
FactSet Is a Buy up to $258 per Share
On Tuesday, FactSet (FDS) reported earnings for its fiscal second quarter and the results were pretty good. This is for the quarter that covered December, January and February.
For Q2, FactSet earned $2.42 per share compared with $2.12 per share last year. Wall Street had been expecting $2.33 per share. Quarterly revenue rose 5.9% to $354.9 million, and organic revenue rose 5.7%. Annual Subscription Value, or ASV, rose to $1.44 billion. I was pleased to see that FactSet increased its adjusted operating margin to 33.2% from 31.4% a year ago.
“As we close the first half of the year, we are pleased to have built upon our long track record of continuous and steady growth. Our team capitalized on growing demand for our core solutions with focused execution as we continued to serve as a trusted partner to our clients,” said Phil Snow, FactSet CEO. “Looking ahead to the second half of the year, we will continue to execute against our proven strategy of providing smarter, connected data and technology solutions that make for an open and flexible user experience.”
As of the end of the quarter, FactSet has a client count of 5,405. That’s an increase of 108. The user count increased by 6,854 to 122,063. Annual client retention was greater than 95% of ASV.
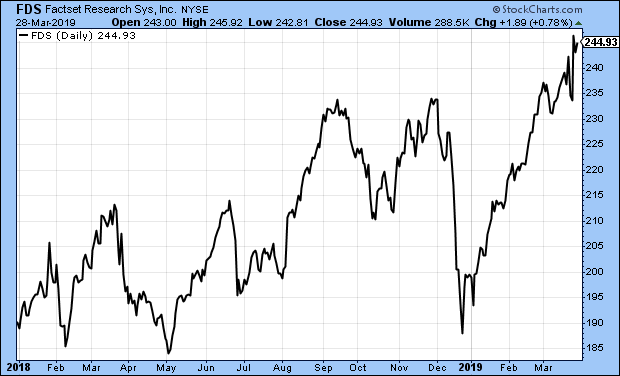
FactSet also updated its financial guidance. The company expects revenue to range between $1.41 billion and $1.45 billion. They see adjusted operating margin between 31.5% and 33.5%. Lastly, they see full-year earnings between $9.50 and $9.65 per share. That’s an increase of five cents to the low end. This was a solid report for FDS.
After the report, shares of FDS opened higher, then lost it all, then rallied back very impressively. This week, FDS hit a new 52-week high. I’m lifting my Buy Below on FactSet to $258 per share.
Preview of RPM International’s Earnings
We have one earnings report next week. RPM International (RPM) is due to report its fiscal Q3 earnings on Thursday morning, April 4. This will be our final off-cycle report until Q1 earnings season begins in mid-April.
I’ll be honest – RPM has been a disappointment this year. The last earnings report was pretty ugly. For its fiscal Q2, RPM reported earnings of 52 cents per share. Sales rose 3.6% to $1.36 billion. Wall Street had been expecting 68 cents per share.
The CEO had some excuses: “Like many manufacturers, our bottom line was impacted by a continued rise in costs for raw materials, freight, labor and energy, as well as adverse foreign-exchange translation.” We already knew the company was facing these issues, but I didn’t realize the problem was so acute. For Q3, RPM expects earnings between 10 and 12 cents per share.
I’m not done yet with RPM. There’s still a lot of time to turn things around, but I want to see some evidence soon. All companies hit rough patches, but not all manage through them the same.
Buy List Updates
Continental Building Products (CBPX) rallied after its last earnings report. Since then, it’s given back the entire gain, and then some. I still like Continental and this is a good price. This week, I’m dropping my Buy Below down to $26 per share.
Eagle Bancorp (EGBN) is another good stock that’s been weak lately. In five trading days, EGBN fell 13%. I’m not worried about Eagle. The stock is going for about ten times this year’s earnings. I’m lowering my Buy Below to $55 per share.
Remember when Church & Dwight (CHD) fell sharply after missing earnings by one penny? The stock lost more than 7% in one day. As it turns out, a stock that’s raised its dividend for 23 years in a row is worth sticking with. Since then, CHD made back everything it lost and just hit a 52-week high on Thursday. I’m raising my Buy Below on CHD to $75 per share.
There are a few other Buy Below changes I want to make. Fiserv (FISV) continues to look very good. I’m expecting another good earnings report. This week, I’m lifting our Buy Below on Fiserv to $92 per share. Hershey (HSY) is another stock that just hit a 52-week high. I’m raising our Buy Below on Hershey to $120 per share. JM Smucker (SJM) is doing very well this year. The jam stock is up 24% for us so far in 2019. I’m increasing the Buy Below on SJM to $122.
That’s all for now. The first quarter ends with the close of trading today. This looks to be one of the best quarters for the stock market in years. The second quarter starts up next week. On Monday, we’ll get the ISM and retail sales reports. Tuesday is durable goods. Then on Wednesday, we’ll see the ADP payroll report. That leads up to the March jobs report on Friday. The last report was quite low. I’ll be curious to see if it gets revised higher. Be sure to keep checking the blog for daily updates. I’ll have more market analysis for you in the next issue of CWS Market Review!
– Eddy
Posted by Eddy Elfenbein on March 29th, 2019 at 7:08 am
The information in this blog post represents my own opinions and does not contain a recommendation for any particular security or investment. I or my affiliates may hold positions or other interests in securities mentioned in the Blog, please see my Disclaimer page for my full disclaimer.
-
Archives
- July 2026
- June 2026
- May 2026
- April 2026
- March 2026
- February 2026
- January 2026
- December 2025
- November 2025
- October 2025
- September 2025
- August 2025
- July 2025
- June 2025
- May 2025
- April 2025
- March 2025
- February 2025
- January 2025
- December 2024
- November 2024
- October 2024
- September 2024
- August 2024
- July 2024
- June 2024
- May 2024
- April 2024
- March 2024
- February 2024
- January 2024
- December 2023
- November 2023
- October 2023
- September 2023
- August 2023
- July 2023
- June 2023
- May 2023
- April 2023
- March 2023
- February 2023
- January 2023
- December 2022
- November 2022
- October 2022
- September 2022
- August 2022
- July 2022
- June 2022
- May 2022
- April 2022
- March 2022
- February 2022
- January 2022
- December 2021
- November 2021
- October 2021
- September 2021
- August 2021
- July 2021
- June 2021
- May 2021
- April 2021
- March 2021
- February 2021
- January 2021
- December 2020
- November 2020
- October 2020
- September 2020
- August 2020
- July 2020
- June 2020
- May 2020
- April 2020
- March 2020
- February 2020
- January 2020
- December 2019
- November 2019
- October 2019
- September 2019
- August 2019
- July 2019
- June 2019
- May 2019
- April 2019
- March 2019
- February 2019
- January 2019
- December 2018
- November 2018
- October 2018
- September 2018
- August 2018
- July 2018
- June 2018
- May 2018
- April 2018
- March 2018
- February 2018
- January 2018
- December 2017
- November 2017
- October 2017
- September 2017
- August 2017
- July 2017
- June 2017
- May 2017
- April 2017
- March 2017
- February 2017
- January 2017
- December 2016
- November 2016
- October 2016
- September 2016
- August 2016
- July 2016
- June 2016
- May 2016
- April 2016
- March 2016
- February 2016
- January 2016
- December 2015
- November 2015
- October 2015
- September 2015
- August 2015
- July 2015
- June 2015
- May 2015
- April 2015
- March 2015
- February 2015
- January 2015
- December 2014
- November 2014
- October 2014
- September 2014
- August 2014
- July 2014
- June 2014
- May 2014
- April 2014
- March 2014
- February 2014
- January 2014
- December 2013
- November 2013
- October 2013
- September 2013
- August 2013
- July 2013
- June 2013
- May 2013
- April 2013
- March 2013
- February 2013
- January 2013
- December 2012
- November 2012
- October 2012
- September 2012
- August 2012
- July 2012
- June 2012
- May 2012
- April 2012
- March 2012
- February 2012
- January 2012
- December 2011
- November 2011
- October 2011
- September 2011
- August 2011
- July 2011
- June 2011
- May 2011
- April 2011
- March 2011
- February 2011
- January 2011
- December 2010
- November 2010
- October 2010
- September 2010
- August 2010
- July 2010
- June 2010
- May 2010
- April 2010
- March 2010
- February 2010
- January 2010
- December 2009
- November 2009
- October 2009
- September 2009
- August 2009
- July 2009
- June 2009
- May 2009
- April 2009
- March 2009
- February 2009
- January 2009
- December 2008
- November 2008
- October 2008
- September 2008
- August 2008
- July 2008
- June 2008
- May 2008
- April 2008
- March 2008
- February 2008
- January 2008
- December 2007
- November 2007
- October 2007
- September 2007
- August 2007
- July 2007
- June 2007
- May 2007
- April 2007
- March 2007
- February 2007
- January 2007
- December 2006
- November 2006
- October 2006
- September 2006
- August 2006
- July 2006
- June 2006
- May 2006
- April 2006
- March 2006
- February 2006
- January 2006
- December 2005
- November 2005
- October 2005
- September 2005
- August 2005
- July 2005
 Eddy Elfenbein is a Washington, DC-based speaker, portfolio manager and editor of the blog Crossing Wall Street. His