CWS Market Review – May 31, 2019
“Intelligent investment is more a matter of mental approach than it is of technique.”
– Ben Graham
There’s an old Wall Street adage: “sell in May and go away.” Indeed, the historical data shows that the best six-month stretch for investors has been from November to May while the worst has been from May to November.
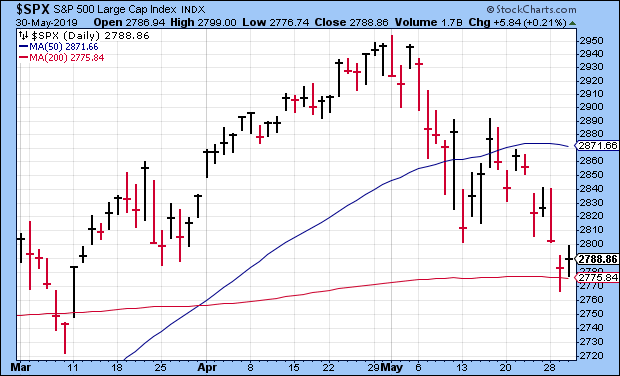
This year, that advice was exactly right. The S&P 500 had its all-time highest close on the final day of April when the index closed at 2,945.83. The following day, the index reached its intra-day high of 2,954.13.
Since then, the market has gradually drifted lower. On Wednesday, the S&P 500 closed at its lowest level since March 8. The same day, the Dow slipped below 25,000 for the first time in 16 weeks. The S&P 500 is now below its 50-day moving average, and this week it briefly fell below its 200-day moving average.
So what has everyone so nervous? The tipping point was President Trump’s tweet from May 5 which escalated the Great Trade War of 2019. What’s interesting about this latest downturn is that it was foreshadowed by the bond market. Not only has the bond market rallied (a lot) but it’s also become inverted, though only partially.
Confused? Fear not. In this week’s CWS Market Review, I’ll explain what it all means. I’ll also take a look at our two recent Buy List earnings reports, Hormel Foods and Ross Stores. Later on, I’ll preview next week’s earnings report from JM Smucker. But first, let’s look at what has Wall Street on edge.
The Yield Curve Gets Inverted…But Only a Little
While the stock market has been weak lately, the bond market has been quite strong. Since November 8, the 10-year yield is down more than 1% (3.24% to 2.22%.) That’s a huge move. We’re in an unusual position right now because the current Treasury yield curve is inverted, but only partially. Treasury yields gradually decrease from one month out until three years out. After that, yields rise again. It almost looks like a check mark.
What explains a check mark curve? Perhaps the market expects one or two therapeutic rates within a broader tightening cycle. The futures market thinks there’s a 65% chance that the Fed will cut by the September meeting. It could happen, but I’m a doubter. Going by the Fed’s statements, they seem to like things as they are. For a rate cut to be on the table, I would expect to see decidedly worse economic news (and worse financial markets). We’re just not seeing it.
The Fed meets again in mid-June. It’s also a meeting where they’ll update their economic forecasts. Personally, I think that meeting will be a big snoozer. The Fed doesn’t like the perception, not unfairly held, that they’re Wall Street’s lackey. It took a pretty big market hissy fit last year just to get the Fed to back off on planned rate hikes. Actual rate cuts are quite another thing.
The Fed also doesn’t want to be seen as bailing out a president in a trade spat they most certainly oppose. The latest is that President Trump is hitting Mexico with a 5% tariff. There is, however, a possible finale to all the trade rhetoric. In June, there’s a big G20 meeting, and it’s possible that President Trump will announce a trade deal with President Xi Jinping of China.
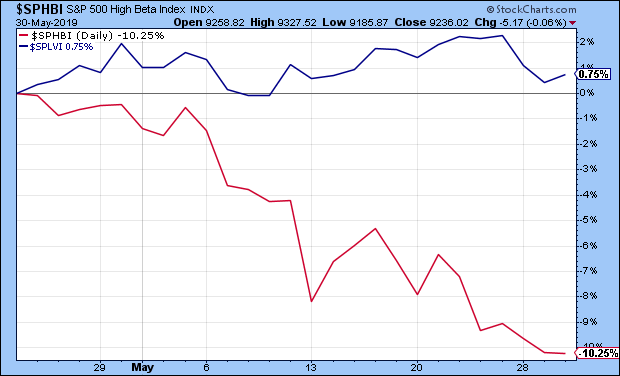
The trade talk and bond-market rally has had an interesting impact on the stock market outside of simply going down. Over the past few weeks, a wide gap has opened between “high beta” stocks and those with low volatility. The more volatile stocks have been dropping the most, while the low volatility sector has been holding steady. Over the last few weeks, the high beta sector is down 10.25% while the low vol sector is higher by 0.75%.
When the stock and bond markets act like this, it means that investors are shunning risk and seeking safety. The 30-year Treasury is now near its lowest point since Election Day in 2016. Within the stock market, sectors like tech, energy and industrials have been lagging. On the other hand, defensive areas have been doing well.
Since our Buy List is concentrated in high-quality stocks, we’ve been doing very well lately, in a relative sense. Or more precisely, we’re flat while everyone else is dropping. For the year so far, our Buy List is up 14.94% to the S&P 500’s 11.25%. But you can really see the divergence in the last month. Since April 22, the S&P 500 is down 4.10% while our Buy List is actually higher by 0.17%. That’s an unusually big gap for such a short time period. This is exactly why we own high-quality stocks. Now let’s take a look at two recent earnings reports from our Buy List.
Earnings from Hormel Foods and Ross Stores
We had two Buy List earnings reports last week. These were for companies that had quarters ending at the end of April. Let’s start with Hormel Foods (HRL). On Thursday, May 23, the Spam company reported fiscal-Q2 earnings of 46 cents per share. That beat expectations by one penny per share.
Despite the earnings beat, Hormel lowered its fiscal 2019 outlook. They now see sales of $9.5 billion to $10 billion. The previous guidance was $9.7 billion to $10.2 billion. They also lowered their EPS guidance to $1.71 to $1.85. The previous range was $1.77 to $1.91 per share.
Jim Snee, Hormel’s CEO, said that despite record sales, Q2 did not meet their expectations: “African swine fever in China started to impact global hog and pork markets this quarter, which led to rapidly increasing input costs. In response, we have announced pricing action across our branded value-added portfolio in the Grocery Products, Refrigerated Foods and International segments.”
Snee said that the lower guidance “is based on the input cost increases experienced in the second quarter and a forecast for volatile domestic pork prices in the second half of fiscal 2019.”
On Thursday, shares of Hormel gapped down at the open. At one point, HRL was off by 6.3%. After that, HRL rallied back, and it closed yesterday not far from where it was before the earnings. It’s as if the market thought it over and changed its mind.
Hormel’s outlook is troubling, but I’m still confident the company can manage its way through short-term issues. As a precaution, this week, I’m lowering my Buy Below on Hormel Foods to $42 per share.
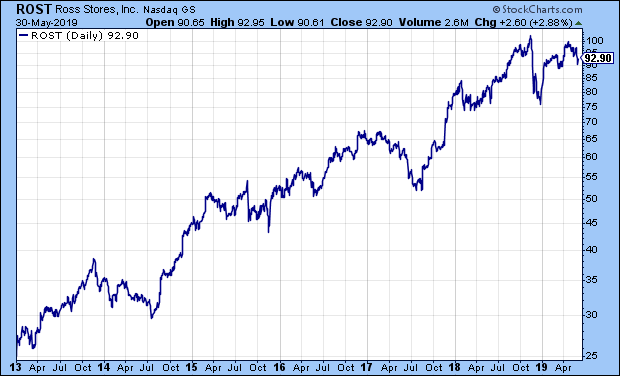
Also on Thursday, Ross Stores (ROST) released its fiscal-Q1 earnings report. For the February/March/April period, Ross made $1.15 per share. Previously, the deep-discounter had given us an earnings range of $1.05 to $1.11 per share. As usual, their guidance was conservative. Comparable-store sales were up 2%.
Barbara Rentler, Chief Executive Officer, commented, “For the first quarter, we delivered sales gains at the high end of our guidance as well as better-than-expected earnings-per-share growth despite continued underperformance in Ladies’ apparel. While operating margin of 14.1% was down from the prior year, it was above plan mainly due to higher merchandise margin. As expected, this improvement was more than offset by increases in freight and wage costs and the timing of packaway-related expenses that benefited the prior-year period.”
For Q2, Ross sees comparable-store sales growth of 1% to 2%. For EPS, the company sees the exact same as Q1, $1.05 to $1.11 per share. Wall Street had been expecting $1.14 per share.
The company also updated its full-year guidance. Ross now sees earnings of $4.38 to $4.52 per share. That includes seven cents per share thanks to a favorable tax benefit. The previous range was $4.30 to $4.52 per share. Adjusting for that, in effect, ROST’s guidance range narrowed thanks to a one-cent increase at the low end and a five-cent decrease at the high end.
The shares pulled back after the earnings report, but it was nothing too serious. At one point on Wednesday, ROST dipped below $90 per share. I’m still a fan. Ross Stores is a buy up to $95 per share.
Earnings from Smucker on June 6
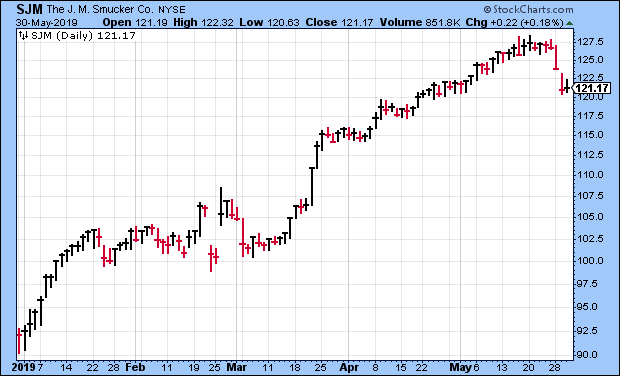
At the start of the year, I would not have guessed that JM Smucker (SJM) would be a 30% winner for us by May, but here we are. Of course, one of the best parts of our strategy is that we don’t have to make such guesses. We buy and we wait. The jelly people are due to report their fiscal-Q4 earnings next Thursday, June 6.
For their fiscal Q3, Smucker earned $2.26 per share, which nicely beat Wall Street’s estimate of $2.02 per share. Sales rose 6% to just over $2 billion. Most importantly, the company stood by its full-year forecast.
For the entire fiscal year, Smucker expects sales of $7.9 billion and earnings of $8.00 to $8.20 per share. They’ve already made $6.20 per share for the first three quarters, so that translates to a Q4 range of $1.80 to $2.00 per share. Wall Street expects $1.95 per share.
Smucker also said that results for FY 2020, which began on May 1, will be above Wall Street’s expectations. At the time, Wall Street had been expecting 2020 earnings of $8.22 per share. That consensus is now up to $8.33 per share. The current share price is about 14.5 times that, so the stock is reasonably valued.
Remember that Smucker is a lot more than jelly. Their divisions are coffee, retail consumer foods, retail pet foods and international. The stock actually got dinged on Tuesday and Wednesday of this week. Look for a solid earnings report.
After the Smucker report, we enter a dry patch for Buy List earnings. There’s not much until the Q2 earnings season heats up in mid-July. We have two Buy List stocks with quarters that ended in May. FactSet (FDS) will report its earnings on June 25. The other is RPM International (RPM), but they won’t report until mid-to-late July. Companies are allowed extra time with their fiscal Q4 report.
Speaking of FactSet, last week the company raised its dividend by 12.5%. The payout will rise from 64 cents to 72 cents per share. This is the 14th annual dividend increase in a row. The cash dividend will be paid on June 18 to holders of record at the close of business on May 31.
Before I go, I wanted to mention Check Point Software (CHKP). This is a very good company, but the shares have been knocked around lately. In April, CHKP beat earnings by a penny, but traders got spooked by poor guidance. In my opinion, that guidance wasn’t that bad. The day of the earnings report, the shares dropped 7.4%. What’s surprised me is that CHKP has fallen another 6.2% on top of that. Look for a bounce. I’m lowering my Buy Below on Check Point to $120 per share.
That’s all for now. Next week is the first week of June, and with that, we’ll get several of the key turn-of-the-month economic reports. The ISM Manufacturing report comes out on Monday. This is often a good gauge of the factory sector. ADP will release its payroll report on Wednesday. Then on Thursday, the jobless-claims report is due out. This all leads up to the big jobs report next Friday. That last report showed the lowest unemployment rate in five decades. Be sure to keep checking the blog for daily updates. I’ll have more market analysis for you in the next issue of CWS Market Review!
– Eddy
Posted by Eddy Elfenbein on May 31st, 2019 at 7:08 am
The information in this blog post represents my own opinions and does not contain a recommendation for any particular security or investment. I or my affiliates may hold positions or other interests in securities mentioned in the Blog, please see my Disclaimer page for my full disclaimer.
-
Archives
- July 2026
- June 2026
- May 2026
- April 2026
- March 2026
- February 2026
- January 2026
- December 2025
- November 2025
- October 2025
- September 2025
- August 2025
- July 2025
- June 2025
- May 2025
- April 2025
- March 2025
- February 2025
- January 2025
- December 2024
- November 2024
- October 2024
- September 2024
- August 2024
- July 2024
- June 2024
- May 2024
- April 2024
- March 2024
- February 2024
- January 2024
- December 2023
- November 2023
- October 2023
- September 2023
- August 2023
- July 2023
- June 2023
- May 2023
- April 2023
- March 2023
- February 2023
- January 2023
- December 2022
- November 2022
- October 2022
- September 2022
- August 2022
- July 2022
- June 2022
- May 2022
- April 2022
- March 2022
- February 2022
- January 2022
- December 2021
- November 2021
- October 2021
- September 2021
- August 2021
- July 2021
- June 2021
- May 2021
- April 2021
- March 2021
- February 2021
- January 2021
- December 2020
- November 2020
- October 2020
- September 2020
- August 2020
- July 2020
- June 2020
- May 2020
- April 2020
- March 2020
- February 2020
- January 2020
- December 2019
- November 2019
- October 2019
- September 2019
- August 2019
- July 2019
- June 2019
- May 2019
- April 2019
- March 2019
- February 2019
- January 2019
- December 2018
- November 2018
- October 2018
- September 2018
- August 2018
- July 2018
- June 2018
- May 2018
- April 2018
- March 2018
- February 2018
- January 2018
- December 2017
- November 2017
- October 2017
- September 2017
- August 2017
- July 2017
- June 2017
- May 2017
- April 2017
- March 2017
- February 2017
- January 2017
- December 2016
- November 2016
- October 2016
- September 2016
- August 2016
- July 2016
- June 2016
- May 2016
- April 2016
- March 2016
- February 2016
- January 2016
- December 2015
- November 2015
- October 2015
- September 2015
- August 2015
- July 2015
- June 2015
- May 2015
- April 2015
- March 2015
- February 2015
- January 2015
- December 2014
- November 2014
- October 2014
- September 2014
- August 2014
- July 2014
- June 2014
- May 2014
- April 2014
- March 2014
- February 2014
- January 2014
- December 2013
- November 2013
- October 2013
- September 2013
- August 2013
- July 2013
- June 2013
- May 2013
- April 2013
- March 2013
- February 2013
- January 2013
- December 2012
- November 2012
- October 2012
- September 2012
- August 2012
- July 2012
- June 2012
- May 2012
- April 2012
- March 2012
- February 2012
- January 2012
- December 2011
- November 2011
- October 2011
- September 2011
- August 2011
- July 2011
- June 2011
- May 2011
- April 2011
- March 2011
- February 2011
- January 2011
- December 2010
- November 2010
- October 2010
- September 2010
- August 2010
- July 2010
- June 2010
- May 2010
- April 2010
- March 2010
- February 2010
- January 2010
- December 2009
- November 2009
- October 2009
- September 2009
- August 2009
- July 2009
- June 2009
- May 2009
- April 2009
- March 2009
- February 2009
- January 2009
- December 2008
- November 2008
- October 2008
- September 2008
- August 2008
- July 2008
- June 2008
- May 2008
- April 2008
- March 2008
- February 2008
- January 2008
- December 2007
- November 2007
- October 2007
- September 2007
- August 2007
- July 2007
- June 2007
- May 2007
- April 2007
- March 2007
- February 2007
- January 2007
- December 2006
- November 2006
- October 2006
- September 2006
- August 2006
- July 2006
- June 2006
- May 2006
- April 2006
- March 2006
- February 2006
- January 2006
- December 2005
- November 2005
- October 2005
- September 2005
- August 2005
- July 2005
 Eddy Elfenbein is a Washington, DC-based speaker, portfolio manager and editor of the blog Crossing Wall Street. His