Archive for October, 2019
-
Morning News: October 29, 2019
Eddy Elfenbein, October 29th, 2019 at 7:17 amAramco IPO’s Local Push May Dim Saudi ‘Vision’
Vietnam Is a Trade War Winner. Now It Has To Figure Out How To Stay Ahead.
Why the Economy Might Not Sway 2020 Voters
Australia Says Google Misled Consumers Over Location Tracking
Google, In Rare Stumble, Posts 23% Decline in Profits
Google Owner Alphabet in Bid to Buy Fitbit
Amazon Set to Challenge Loss of $10 Billion Pentagon JEDI Cloud Computing Contract
Biggest Private Coal Miner Goes Bust After Trump Rescue Fails
The Men Who Would Be King of Glencore Move Into the Spotlight
AT&T Deals With Elliott. Now It Needs to Nail HBO Max.
Richard Branson’s Virgin Galactic Is a Huge Financial Risk
California Blackouts Hit Cellphone Service, Fraying a Lifeline
Howard Lindzon: Momentum Monday – Earnings Earnings Earnings
Joshua Brown: Why the Stock Market Rallies Into Year End & Bond Market is Trick Or Treating at the Fed
Jeff Carter: Returns to Angel Investing
Ben Carlson: Talk Your Book: Crossing Wall Street with Eddy Elfenbein
Be sure to follow me on Twitter.
-
Repost: How the Market Behaves at All-Time Highs
Eddy Elfenbein, October 28th, 2019 at 1:35 pmFinance people tend to be numbers people. I’d certainly include myself in that group. You can mention any financial topic and there are dozens of studies, charts and regressions on it. Name it and the numbers have been crunched.
This obscures an important point. All these numbers do is explain a few basic truths about the market. What can be told with numbers only reinforces what can be said with words, and usually in only a few words.
The important truths about the market aren’t many and they aren’t complicated. Investors need to understand them. On Monday, for example, I highlighted the recent behavior of Royal Caribbean (RCL). The stock dove in October due to fears of Ebola. It’s recovered and gone on to soar to new heights.
With our RCL example, the important truth is that stocks oscillate between large, quick downdrafts and long, slow up trends. The downs are fast and dramatic, the recoveries are slow and boring. Yet, it’s the boring part that makes all the difference. People spend too much time worrying about the painful declines and not enough time on riding out the long rallies.
Earlier this year, I looked at all the daily closes for the S&P 500 going back to the 1930s. I found that all the days where the market went up or down by more than 1.17% canceled each other out. The entire gain came from the low volume days. You hear a lot about tail risk, but the important part of the distribution is the tall heads.
(Incidentally, the market’s returns aren’t merely fat-tailed, they’re tall-headed as well. That’s “leptokurtic” if you’re looking to impress people.)
Most of the market’s big one-day gains have come right after big one-day losses. I asked Ryan Detrick, a must-follow on Twitter, to look at how the S&P 500 has behaved when it’s at a new all-time high. As I suspected, the market is far calmer than it normally is, and the return has been better as well.
Since 1950, there have been 1,026 trading days following a new high. (Technically, we could say the study goes back to 1929 because it took until 1954 for the index to make a new high.) That’s about 6.2% of the time, or one new high in every 16.1 days.
Of those 1,026 new highs, the market rose the following day nearly 56% of the time. That compares with 53% for all days.
To me the arresting fact is the standard deviation. For all market days, the standard deviation is 0.965%. But when the market’s at a new high, it’s only 0.611%. That’s more than 36% less volatility.
In the last 60 years, the S&P 500 has risen by more than 2% following a new high just three times. The normal market sees 2% up days more than four times more frequently. It’s probably more appropriate to say that volatility rises when the market is off its high than to say that volatility is lower at the top.
In the last 60 years, the biggest rally off a new high came on January 6, 1999 when the S&P 500 gained 2.21%. Of all days, that’s only the 265th best day.
If you had invested solely in those 1,026 days (with no transaction costs), you would have made 95.6%. Those 1,026 days are equal to about four years. The annualized return works out to 18%.
Let’s consider this hypothetical. Let’s say the entire stock market only offered two rewards. For 95% of the time, the market gained 1.2% a month. For 5% of the time, it lost 10% a month. Those are your only two outcomes.
That’s a good way to think about market behavior. The annualized outcome of our hypothetical is about 7.5%, but there are pronounced dips along the way. If you invest for several years, you’ll likely experience more than a few down months bunched together. The long-term trend, however, is unmistakable.
You’ll notice that market commentators spend far too much time talking about the inevitable declines than they do on what drives the vol gains. As a successful investor, view downturns as both necessary and fleeting.
(This post originally appeared on August 12th, 2015.)
-
All-Time High
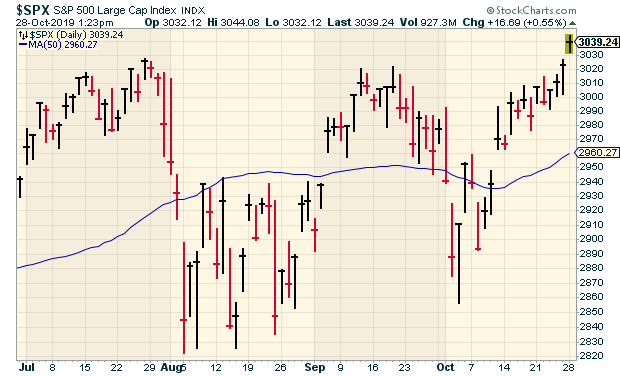
Eddy Elfenbein, October 28th, 2019 at 1:24 pmThe S&P 500 is up to a new all-time high today. If you recall, the S&P 500 dropped 5.6% in four days this summer. That sparked a lot of worrying that the economy was about to plunge.
All we had to do was wait a few weeks and we’re at a new high.
Since the bull market started in March 2009, there have been 25 pullbacks of 5% or more. Every single one has been turned back.
Here’s the chart. The blue line is the 50-day moving average.
-
Chatting with the Animal Spirits
Eddy Elfenbein, October 28th, 2019 at 11:07 amI’m a big fan of the Animal Spirits podcast with Michael Batnick and Ben Carlson, so it was a great honor to be invited on.
We had a fun conversation that covered several topics. Check it out.
-
Check Point Earns $1.44 per Share
Eddy Elfenbein, October 28th, 2019 at 10:59 amWe had a good earnings report this morning from Check Point Software (CHKP). The company earned $1.44 for Q3 which was four cents more than estimates.
Previously, Check Point told us to expect earnings to range between $1.36 and $1.44 per share on revenue of $480 to $500 million. Total revenue was $491 million.
I haven’t seen updated guidance yet but from the previous report, CHKP said they project full-year earnings between $5.85 and $6.25 per share and revenue between $1.94 and $2.04 billion.
The shares are up a bit in early trading.
Here are some highlights:
Total Revenue: $491 million, 4 percent increase year over year
Deferred Revenues: $1,242 million, 8 percent increase year over year
GAAP Operating Income: $214 million, representing 44 percent of revenues
Non-GAAP Operating Income: $246 million, representing 50 percent of revenues
GAAP EPS: $1.25, Non-GAAP EPS: $1.44“During the third quarter, our security subscriptions continued to drive results with 13 percent growth. This was underscored by expanded customer adoption of our cloud solutions,” said Gil Shwed, Founder and CEO of Check Point Software Technologies. “We continued to increase the breadth of our offerings with the introduction of CloudGuard Connect and CloudGuard Edge, providing enterprises with industry leading threat prevention driven by a cloud service.”
Total Revenue: $491 million compared to $471 million in the third quarter of 2018, a 4 percent increase year over year.
GAAP Operating Income: $214 million compared to $226 million in the third quarter of 2018, representing 44 percent and 48 percent of revenues in the third quarter of 2019 and 2018, respectively.
Non-GAAP Operating Income: $246 million compared to $250 million in the third quarter of 2018, representing 50 percent and 53 percent of revenues in the third quarter of 2019 and 2018, respectively.
GAAP Taxes on Income: $47 million compared to $45 million in the third quarter of 2018.
GAAP Net Income & Earnings per Diluted Share: GAAP net income was $188 million compared to $198 million in the third quarter of 2018. GAAP earnings per diluted share were $1.25, same as third quarter of 2018.
Non-GAAP Net Income & Earnings per Diluted Share: Non-GAAP net income was $217 million compared to $219 million in the third quarter of 2018. Non-GAAP earnings per diluted share were $1.44 compared to $1.38 in the third quarter of 2018, a 4 percent increase year over year.
Deferred Revenues: As of September 30, 2019, deferred revenues were $1,242 million compared to $1,148 million as of September 30, 2018, an 8 percent increase year over year.
Cash Balances, Marketable Securities & Short Term Deposits: $4,055 million as of September 30, 2019, compared to $4,072 million as of September 30, 2018.
Cash Flow: Cash flow from operations of $244 million compared to $249 million in the third quarter of 2018.
Share Repurchase Program: During the third quarter of 2019, the company repurchased approximately 2.9 million shares at a total cost of approximately $323 million.Update
Check Point provided Q4 guidance on the earnings call.
With that said, our revenues for the fourth quarter are expected to be between $527 million to $557 million and non-GAAP EPS is expected to be between $1.93 to $2.04. GAAP EPS is expected to be approximately $0.19 lower.
-
Morning News: October 28, 2019
Eddy Elfenbein, October 28th, 2019 at 7:29 amChinese Investment Pits Wall Street Against Washington
Bitcoin Holds Ground After China Voices Support for Blockchain
Aramco’s I.P.O. Will Be Less Gigantic Than Promised
Microsoft Shares Surge After Controversial Pentagon Contract Win
Tiffany Receives $14.5 Billion Takeover Offer From LVMH
HSBC Needs More Than Cosmetic Cuts
The Advertising Industry Has a Problem: People Hate Ads
Disney Is New to Streaming, but Its Marketing Is Unmatched
Google Results to Share Stage with U.S. Antitrust Probe
JPMorgan Weighs Shifting Thousands of Jobs Out of New York Area
GM Labor Deal Could Be Costly to Detroit Rivals
New York Doesn’t Need a Smoking Gun to Win the Exxon Climate Trial
Jeff Miller: Weighing the Week Ahead: Analyzing Market Expectations
Ben Carlson: Everything You Need to Know About Recessions & Do We Need to Farm an Asteroid For Stocks to Keep Rising?
Michael Batnick: 12 Charts You Ought to See Before the Next Recession
Be sure to follow me on Twitter.
-
Bloomberg ETF IQ
Eddy Elfenbein, October 25th, 2019 at 12:01 pmOn Wednesday, I was on Bloomberg’s ETF IQ program.
-
CWS Market Review – October 25, 2019
Eddy Elfenbein, October 25th, 2019 at 7:08 am“99% of the troubles that threaten our civilization come from too optimistic accounting.” – Charlie Munger
We’re at the high tide of earnings season. We had seven Buy List earnings reports this week, and there are another six coming our way next week. If that’s not enough, there’s a Federal Reserve meeting next week as well, plus a jobs report next Friday.
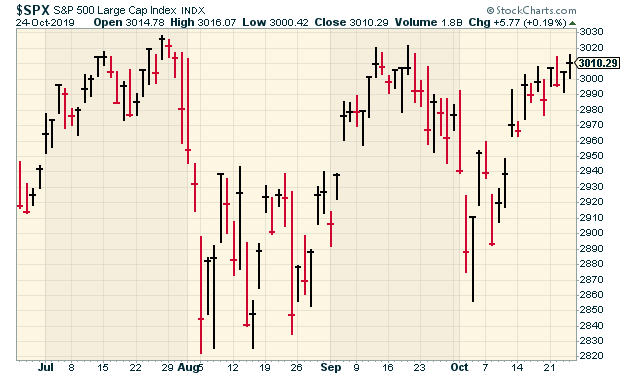
So far, Wall Street seems to like earnings season. On Thursday, the S&P 500 closed at 3,010.29. That’s the highest close in nearly three months, and we’re very close to a new all-time high. In fact, the S&P 500 Total Return Index, which includes dividends, finished Thursday just 0.02% from an all-time-high close.
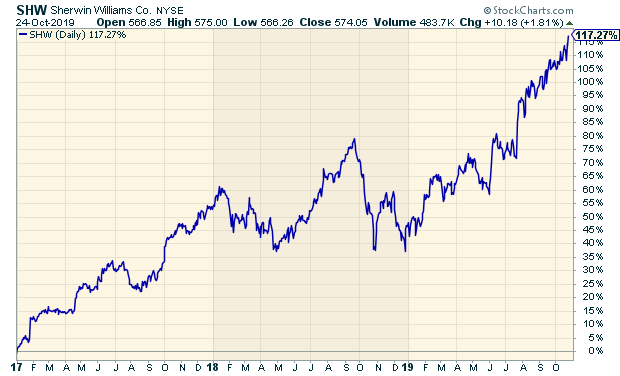
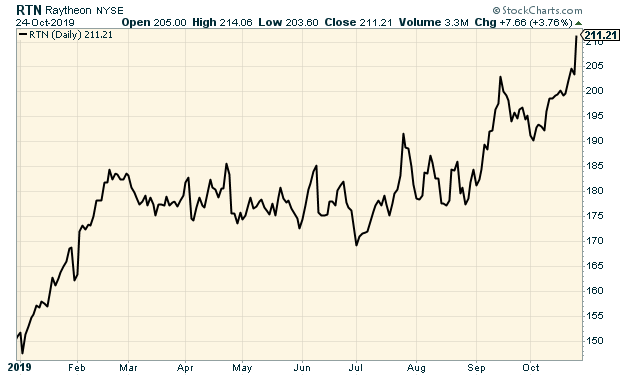
In this week’s CWS Market Review, I’ll summarize all the earnings reports for you. So far, every one of our stocks has beaten earnings expectations. Stand-outs so far include Sherwin-Williams, which beat earnings, increased guidance and gapped up to a new high. The same for Raytheon. AFLAC beat and guided higher, but no new high. At least, not yet.
There’s so much earnings news that I won’t have time to discuss the Fed meeting, but you can expect the Fed to cut rates again. Now let’s take a look at this week’s Buy List earnings reports.
This Week’s Earnings Reports
Here’s an updated look at this season’s earnings calendar:
Company Symbol Date Estimate Results Eagle Bancorp EGBN 16-Oct $1.07 $1.08 Signature Bank SBNY 17-Oct $2.70 $2.75 Sherwin-Williams SHW 22-Oct $6.48 $6.65 Globe Life GL 23-Oct $1.69 $1.73 AFLAC AFL 24-Oct $1.07 $1.16 Cerner CERN 24-Oct $0.66 $0.66 Danaher DHR 24-Oct $1.15 $1.16 Hershey HSY 24-Oct $1.60 $1.61 Raytheon RTN 24-Oct $2.86 $3.08 Check Point Software CHKP 28-Oct $1.40 Stryker SYK 29-Oct $1.90 Cognizant Technology Solutions CTSH 30-Oct $1.05 Moody’s MCO 30-Oct $2.00 Church & Dwight CHD 31-Oct $0.61 Intercontinental Exchange ICE 31-Oct $0.96 Becton, Dickinson BDX 5-Nov $3.30 Broadridge Financial BR 6-Nov $0.71 Fiserv FISV 6-Nov $0.99 Disney DIS 7-Nov $0.95 Continental Building Products CBPX TBA $0.40 On Tuesday, Sherwin-Williams (SHW) posted Q3 adjusted earnings of $6.65 per share. That beat Wall Street’s estimates of $6.48 per share. This was a very good quarter for the paint people. The CEO said:
“Sherwin-Williams delivered strong results in the quarter as adjusted earnings per share increased 17.1% year-over-year to $6.65. Our performance in the quarter was driven by continued strength in North American architectural paint markets, which offset choppiness in some industrial-end markets. U.S. and Canada same-store sales growth was 8.1% as our pro painting customers continued to report strong demand. As a result of this strong volume and operating efficiencies, consolidated gross margin expanded over 300 basis points to 45.7%. Adjusted EBITDA margin in the quarter improved 150 basis points to 18.9% compared to the prior year.
“For the second consecutive quarter, all three operating segments increased segment profit and margin compared to the same period last year. In The Americas Group, our North American paint stores generated strong growth in all regions and all customer-end markets, led by double-digit growth in residential repaint. With the strong volume, the team delivered incremental operating margin of approximately 37%, and we have opened 31 net new stores year to date.
Segment profit in The Americas Group increased $85.9 million to $663.7 million in the quarter and increased $122.1 million to $1.61 billion in nine months, due primarily to higher paint-sales volume and selling-price increases.
The best news is that Sherwin increased its full-year guidance range to $20.90 – $21.30 per share. The previous range was $20.40 to $21.40 per share. Since Sherwin has already made $16.83 per share for the first nine months of this year, the new range implies Q4 earnings of $4.07 to $4.47 per share.
Sherwin-Williams is now up 117.3% since we added it to the Buy List in 2017. This week, I’m lifting our Buy Below on SHW to $590 per share.
On Wednesday, Globe Life (GL) reported Q3 net operating income of $1.73 per share compared with $1.59 per share for the year-ago quarter. Wall Street had been expecting $1.69 per share. This was GL’s first earnings report under the new name. Here are some highlights from the quarter:
• Net income as an ROE was 12.0%. Net operating income as an ROE excluding net unrealized gains on fixed maturities was 14.7%.
• Life underwriting margins at Liberty National Exclusive Agency and American Income Exclusive Agency increased over the year-ago quarter by 12% and 9%, respectively.
• Health underwriting margin at Family Heritage Exclusive Agency increased over the year-ago quarter by 12%.
• Life premiums increased over the year-ago quarter by 7% at American Income Exclusive Agency, and health premiums increased over the year-ago quarter by 7% at both Family Heritage Exclusive Agency and American Income Exclusive Agency.
• Life net sales at Liberty National Exclusive Agency and American Income Exclusive Agency increased over the year-ago quarter by 12% and 9%, respectively.
• 932,946 shares of common stock were repurchased during the quarter.The stock hit a new high on Thursday. Globe Life has quietly turned into a nice winner for us this year. I’m keeping the Buy Below at $100 per share.
Thursday was an especially busy day for us. We had five Buy List earnings reports.
Let’s start with Hershey (HSY). The chocolate folks reported earnings of $1.61 per share. That beat Wall Street by a penny per share.
It was a good quarter, but Hershey didn’t change its full-year guidance of $5.68 to $5.74 per share. That’s the same story as three months ago. With the Q2 earnings beat, I thought Hershey would raise guidance, but it didn’t. The company seems to be low-balling Q4.
The guidance implies Q4 earnings of $1.18 to $1.24 per share. Wall Street had been expecting $1.27 per share. On the bright side, Hershey increased full-year sales guidance by a tiny bit. Hershey remains a buy up to $162 per share.
Raytheon (RTN) had a great Q3. The defense company made $3.08 per share which was 22 cents better than estimates. Sales for the quarter rose by 9.4% to $7.45 billion. Raytheon also boosted its full-year range to $11.70 to $11.80. The previous range was $11.50 to $11.70.
The company said the earnings beat was driven by higher net sales in classified programs. (I’m afraid to ask.) For the quarter, Raytheon’s bookings grew by 8.4% to $9.44 billion. Their backlog was up 7% to $44.6 billion. The shares rallied nearly 4% on Thursday and made a new high.
Raytheon is planning to merge with United Technologies (UTX). The merger should happen sometime during the first half of next year. RTN shareholders will get 2.3348 shares of Raytheon Technologies. This week, I’m lifting my Buy Below on Raytheon to $220 per share.
Danaher (DHR) reported Q3 earnings of $1.16 per share. That was a penny better than estimates. For Q4, Danaher sees earnings ranging between $1.32 and $1.35 per share. The works out to full-year earnings of $4.74 to $4.77. That’s a little lower than the previous guidance of $4.75 to $4.80 per share.
There are two important notes to add. One is that Danaher is buying GE’s Biopharma business. The deal should close sometime in Q4. Also, Danaher recently IPO’d Envista (NVST), which was their dental business. Danaher still owns about 80% of the company.
For Q3, Cerner (CERN) made 66 cents per share, which was in the middle of their guidance of 65 to 67 cents per share.
For Q4, Cerner expects earnings between 73 and 75 cents per share on revenue of $1.41 billion to $1.46 billion. The healthcare-IT firm sees new-business booking ranging between $1.45 and $1.65 billion. The Q4 earnings guidance is effectively a narrowing of their previous full-year guidance. Previously, Cerner had expected 2019 earnings of $2.64 to $2.72 per share. With new Q4 guidance, that works out to $2.66 – $2.68 per share.
This report is basically what I had expected—maybe a tad light, but nothing to worry about. Earlier this year, Cerner reached an agreement with Starboard Value to start paying a dividend and increase its buyback authorization by $1.5 billion. Cerner remains a buy up to $71 per share.
For Q3, AFLAC (AFL) made $1.16 per share which beat the Street by nine cents per share. Forex added two cents per share to their bottom line.
The good news is that the duck stock raised its full-year guidance to a range of $4.35 to $4.45 per share. That’s a big increase over the old guidance of $4.10 to $4.30 per share. The range is based on the 2018 exchange rate of ¥110.39 yen to the dollar.
AFLAC said it’s aiming to buy back $1.3 to $1.7 billion worth of stock this year. AFLAC remains a buy up to $57 per share.
Six More Reports Next Week
Now let’s look ahead to next week which will be another busy week of earnings for us.
On Monday, Check Point Software (CHKP) is due to report. The stock has not done well for us this year. The earnings really haven’t been that bad. Wall Street, however, hasn’t liked the earnings guidance.
For Q3, Check Point told us to expect earnings to range between $1.36 and $1.44 per share on revenue of $480 to $500 million. That’s not bad. For the entire year, CHKP projected earnings between $5.85 and $6.25 per share and revenue between $1.94 and $2.04 billion.
Three months ago, Stryker (SYK) raised its guidance for 2019. The orthopedics company now expects full-year organic net sales to rise by 7.5% to 8.0%. Stryker expects earnings to range between $8.15 and $8.25 per share. The previous range was $8.05 to $8.20 per share.
For Q3, Stryker sees earnings between $1.87 and $1.92 per share. It should be able to top that. The earnings report is due out on Tuesday. The stock is up nearly 35% for us this year.
Cognizant Technology Solutions (CTSH) has not been a strong performer for us this year. I’ve been patient with CTSH, but we need to see signs that business is improving. After the May earnings report, CTSH lost 18% in two days. The last earnings report was somewhat of an improvement, but we need to see more.
Cognizant said it now expects full-year earnings between $3.92 and $3.98 per share. That’s an increase from the previous range which was $3.87 to $3.95 per share. However, that was a big cut from the initial guidance of at least $4.40 per share. For Q3, Cognizant expects revenue growth in the range of 3.8 to 4.8% in constant currency. The earnings report will come out on Wednesday. Wall Street expects earnings of $1.05 per share.
Moody’s (MCO) is scheduled to report earnings on Wednesday. This is our top-performing stock this year, with a YTD gain of 54%. The jewel in the crown is Moody’s Analytics which makes up about 40% of revenues. Three months ago, Moody’s beat earnings and raised guidance. For 2019, Moody’s expects earnings between $7.95 and $8.15 per share. Consensus is for $2 per share.
Church & Dwight (CHD) will report on Thursday. For Q3, CHD sees earnings of 60 cents per share, and $2.47 for the entire year. The company has grown organic sales by more than 4% for five quarters in a row. The stock took a sharp drop in early September after an investment firm came out with a negative piece on the consumer-products company. I won’t address the specifics of their allegations, but I’ll note that these things happen every so often. Wall Street expects 61 cents per share.
Last is Intercontinental Exchange (ICE). The exchange operator is also due to report on Thursday. ICE didn’t offer EPS guidance, but it did for a few other metrics. What stood out to me was the ranges for data revenue. ICE said Q3 data revenues are expected to be in a range of $550 million to $555 million. For all of 2019, ICE sees data revenues in a range of $2.19 billion to $2.24 billion. The analyst consensus is for 96 cents per share.
That’s all for now. Lots more earnings next week. The Federal Reserve meets on Tuesday and Wednesday. Expect a rate cut. The policy statement will be out on Wednesday at 2 p.m. ET. Also on Wednesday, we’ll get our first look at the Q3 GDP report. The October jobs report is due out on Friday morning. The last report showed the lowest unemployment rate in 50 years. Be sure to keep checking the blog for daily updates. I’ll have more market analysis for you in the next issue of CWS Market Review!
– Eddy
Morning News: October 25, 2019
Eddy Elfenbein, October 25th, 2019 at 7:04 amEU Diplomats Defer Decision on Length of Brexit Extension
Pentagon Pushes Tech Industry to Help U.S. Retain Military Edge
Amazon’s Earning Shocker Is Set To Wipe Over $50 Billion From Its Market Cap
Why An Amazon-Oracle Merger Is A Very Real Possibility
Google Says New AI-Powered Search Update Is ‘Huge Step Forward’
The C.E.O. Taking On the Gun Lobby
Behind AT&T’s Plan To Take On Netflix, Apple and Disney with HBO Max
How SoftBank Made WeWork An Offer It Had to Accept
After 15 Years, Dream Mall Finally Becomes a Reality
George Soros Has Enemies. He’s Fine With That.
Future Delivery: Japanese Trucks Designed With No Cabin and Interchangeable Cargo Holds
Subprime Auto Giant’s Loans Souring at Fastest Clip Since 2008
Howard Lindzon: Payment Heaven Or Hell…Update
Cullen Roche: Three Things I Think I Think – This Might Make You Mad
Roger Nusbaum: Should You Buy An ETF You Expect To Go To Zero? & Managed Futures Evolves
Be sure to follow me on Twitter.
Three Earnings Reports This Morning
Eddy Elfenbein, October 24th, 2019 at 1:51 pmToday is a big earnings day for us. We had three Buy List earnings reports before the bell and another two will come after the close.
Let’s start with Hershey (HSY). The chocolate folks reported earnings of $1.61 per share. That beat Wall Street by a penny per share.
It was a good quarter, but guidance was disappointing. Hershey didn’t change its full-year guidance of $5.68 to $5.74 per share. That implies Q4 earnings of $1.18 to $1.24 per share. Wall Street had been expecting $1.27 per share. I expected a better outlook considering the results.
Raytheon (RTN) had a great Q3. The defense company made $3.08 per share which was 22 cents better than estimates. Overall sales rose 9.4% to $7.45 billion.
Raytheon also boosted its full-year range to $11.70 – $11.80. The previous range was $11.50 to $11.70.
“Raytheon delivered strong bookings, sales growth, EPS and cash generation in the third quarter,” said Thomas A. Kennedy, Raytheon Chairman and CEO. “Bookings strength across our broad portfolio of proven technology solutions positions the company well for future growth.
Danaher (DHR) reported Q3 earnings of $1.16 per share. That was a penny better than estimates. For Q4, Danaher sees earnings ranging between $1.32 and $1.35 per share. That works out to full-year earnings of $4.74 to $4.77.
Thomas P. Joyce, Jr., President and Chief Executive Officer, stated, “We are pleased by our strong third quarter performance as we delivered another quarter of 5% core revenue growth and solid margin expansion. We believe our ongoing investments in innovation and commercial initiatives helped to continue building sustainable competitive advantages across a number of our businesses.”
AFLAC and Cerner are due out after the close.
-
Archives
- July 2026
- June 2026
- May 2026
- April 2026
- March 2026
- February 2026
- January 2026
- December 2025
- November 2025
- October 2025
- September 2025
- August 2025
- July 2025
- June 2025
- May 2025
- April 2025
- March 2025
- February 2025
- January 2025
- December 2024
- November 2024
- October 2024
- September 2024
- August 2024
- July 2024
- June 2024
- May 2024
- April 2024
- March 2024
- February 2024
- January 2024
- December 2023
- November 2023
- October 2023
- September 2023
- August 2023
- July 2023
- June 2023
- May 2023
- April 2023
- March 2023
- February 2023
- January 2023
- December 2022
- November 2022
- October 2022
- September 2022
- August 2022
- July 2022
- June 2022
- May 2022
- April 2022
- March 2022
- February 2022
- January 2022
- December 2021
- November 2021
- October 2021
- September 2021
- August 2021
- July 2021
- June 2021
- May 2021
- April 2021
- March 2021
- February 2021
- January 2021
- December 2020
- November 2020
- October 2020
- September 2020
- August 2020
- July 2020
- June 2020
- May 2020
- April 2020
- March 2020
- February 2020
- January 2020
- December 2019
- November 2019
- October 2019
- September 2019
- August 2019
- July 2019
- June 2019
- May 2019
- April 2019
- March 2019
- February 2019
- January 2019
- December 2018
- November 2018
- October 2018
- September 2018
- August 2018
- July 2018
- June 2018
- May 2018
- April 2018
- March 2018
- February 2018
- January 2018
- December 2017
- November 2017
- October 2017
- September 2017
- August 2017
- July 2017
- June 2017
- May 2017
- April 2017
- March 2017
- February 2017
- January 2017
- December 2016
- November 2016
- October 2016
- September 2016
- August 2016
- July 2016
- June 2016
- May 2016
- April 2016
- March 2016
- February 2016
- January 2016
- December 2015
- November 2015
- October 2015
- September 2015
- August 2015
- July 2015
- June 2015
- May 2015
- April 2015
- March 2015
- February 2015
- January 2015
- December 2014
- November 2014
- October 2014
- September 2014
- August 2014
- July 2014
- June 2014
- May 2014
- April 2014
- March 2014
- February 2014
- January 2014
- December 2013
- November 2013
- October 2013
- September 2013
- August 2013
- July 2013
- June 2013
- May 2013
- April 2013
- March 2013
- February 2013
- January 2013
- December 2012
- November 2012
- October 2012
- September 2012
- August 2012
- July 2012
- June 2012
- May 2012
- April 2012
- March 2012
- February 2012
- January 2012
- December 2011
- November 2011
- October 2011
- September 2011
- August 2011
- July 2011
- June 2011
- May 2011
- April 2011
- March 2011
- February 2011
- January 2011
- December 2010
- November 2010
- October 2010
- September 2010
- August 2010
- July 2010
- June 2010
- May 2010
- April 2010
- March 2010
- February 2010
- January 2010
- December 2009
- November 2009
- October 2009
- September 2009
- August 2009
- July 2009
- June 2009
- May 2009
- April 2009
- March 2009
- February 2009
- January 2009
- December 2008
- November 2008
- October 2008
- September 2008
- August 2008
- July 2008
- June 2008
- May 2008
- April 2008
- March 2008
- February 2008
- January 2008
- December 2007
- November 2007
- October 2007
- September 2007
- August 2007
- July 2007
- June 2007
- May 2007
- April 2007
- March 2007
- February 2007
- January 2007
- December 2006
- November 2006
- October 2006
- September 2006
- August 2006
- July 2006
- June 2006
- May 2006
- April 2006
- March 2006
- February 2006
- January 2006
- December 2005
- November 2005
- October 2005
- September 2005
- August 2005
- July 2005
 Eddy Elfenbein is a Washington, DC-based speaker, portfolio manager and editor of the blog Crossing Wall Street. His