CWS Market Review – June 1, 2021
(This is the free version of CWS Market Review. Don’t forget to sign up for the premium newsletter for $20 per month or $200 for the whole year. Thank you for your support.)
The month of May is on the books, and it was another good one for Wall Street. The S&P 500 gained 0.55% last month. If we include dividends, then the index gained 0.70%. This was the index’s fourth monthly gain in a row, and the 11th up month of the last 14.
Interestingly, May has been a sluggish month historically for the stock market. Adding up the numbers, the Dow has lost an average of 0.22% during May.
That may sound small, and it is, but it’s quite large for an average of 125 years. By tradition, the market starts to heat up along with summer temperatures. For July and August, the Dow has gained an average of nearly 3%. That’s close to 40% of the index’s total gain for the year coming in just two months. Historically, the market acts well during the summer but then usually gets weak again shortly after Labor Day.
The stock market was down slightly today, although we’re not far from our all-time high. The S&P 500 lost only 0.05% today. Today was the fifth day in a row that the S&P 500 closed up or down by less than 0.22%.
Jobs and the Stock Market
This morning, the Institute for Supply Management said the ISM Manufacturing Index rose to 61.2 for May. That’s up from 60.7 for April. That’s a very good number. Wall Street had been expecting 60.9. Any number above 50 means that the factory sector of the economy is expanding.
I like to watch for the ISM figure for a few reasons. Although the manufacturing sector is currently above 12% of the economy, the ISM usually comes on the first business day of the month. Usually, the better the economic report, the longer the lead time. The ISM has a pretty good track record of signaling recessions. Recessions usually occur when the ISM is around 45 or less. We’re far from that.
What’s happening is that there’s clearly a lot of pent-up demand in the economy. When you keep people locked up for so long, they’re going to want to go out and spend. On top of that, the major stimulus efforts from Washington are aiding the economy. In fact, one of the major obstacles that the economy faces right now is supply bottlenecks.
The U.S. economy is at an unusual crossroads. There are 10 million unemployed, yet there’s a worker shortage. That sounds weird but here we are. Part of that, without a doubt, is due to generous unemployment benefits that are keeping folks from returning to work. Many people also face problems with childcare. And there are many people who are still cautious about returning to an office environment.
This is jobs week which means we’ll get the big May employment report this Friday. Leading up to the jobs report, we’ll get the ADP private payrolls report on Thursday. Also on Thursday, we’ll see the latest report on jobless claims. The last jobless claims report was 406,00 which was another pandemic low.
These reports are slowly getting back to normal. The last report was lower than nearly every jobless-claims report in 2009 and 2010. Bear in mind that a little over a year ago, the jobless claims figure peaked at more than six million.
For Friday’s jobs report, Wall Street expects a gain of 674,000 nonfarm jobs, and it expects the unemployment rate to fall to 5.9%.
The jobs report for April was a huge disappointment. Economists were expecting an increase of one million jobs. Instead, the U.S. economy added just 266,000. The unemployment rate ticked up to 6.1%. The jobs report was especially frustrating as more state and local economies are getting back to normal. One analyst said, “This might be one of the most disappointing jobs reports of all time.”
I have to agree. Plus, it came at the same time we got reports that job openings were at an all-time high. Bloomberg reports that “many employers say they are unable to fill positions because of ongoing fears of catching the coronavirus, child-care responsibilities and generous unemployment benefits.” There are two million more job vacancies than new hires. That’s the highest on record.
Here’s a chart of the stock market in blue and the unemployment rate in red. It’s a fascinating chart.
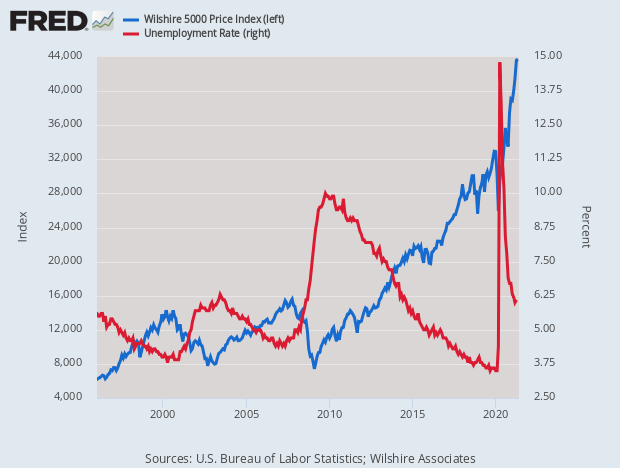
Historically, what’s been the relationship between unemployment and the stock market? To find out, I went over to the Bureau of Labor Statistics and downloaded all the monthly unemployment numbers since 1948. That’s when the series begins. I then went to Professor Robert Shiller’s data library (a great resource) and downloaded all the monthly inflation-adjusted returns of the stock market since 1948. (His numbers go way back.)
I then separated the data into four roughly equal groups. When the unemployment rate has been 4.65% or less, stocks have averaged 4.82% annualized.
When the unemployment rate has been between 4.65% and 5.69%, stocks have averaged 4.81% annualized. Almost exactly the same as the first group.
Now things get interesting. When the unemployment rate has been between 5.69% and 7.28%, stocks have averaged an 8.42% annualized returned. The worse for jobs, the better for stocks, which makes sense.
Now for the final group. When the unemployment rate has been greater than 7.28%, stocks have averaged an annualized gain of 14.87%. That’s quite good.
Very roughly, the tripping point appears to be 6%. Below that, stocks have averaged 3.85%. Above 6%, stocks have gained 15.50%. It’s far from a perfect relationship but it illustrates Warren Buffett’s famous dictum: “Be fearful when others are greedy, and greedy when others are fearful.”
Another sign of a return to normalcy is that the price for oil got to a two-year high today. OPEC and its allies are adjusting to surging demand but they’re trying to do it carefully. Oil is already up 30% this year.
Stock Focus: Mueller Industries (MLI)
One of the most-requested features I run is when I highlight a not-well-known company with a great long-term track record.
A perfect example of this is this week’s stock in focus, Mueller Industries (MLI). Mueller is a leading manufacturer of copper, brass, aluminum and plastic products. This is a classic small-cap cyclical stock. Once you realize the scope of their business, you understand that the use of Mueller’s products is seemingly endless. Mueller makes everything from copper tubing and fittings to brass and copper alloy bars and refrigeration valves.
You can find Mueller most anywhere. Some of the companies that rely on Mueller are in sectors like plumbing, heating, air conditioning, refrigeration, appliance, medical, automotive, military and defense, marine and recreational. Mueller’s operations are located throughout the United States and in Canada, Mexico, Great Britain, South Korea, and China.
Mueller has about 5,000 employees and it’s based in Collierville, Tennessee. The company’s operations are divided among three divisions: Piping Systems, Industrial Metals, and Climate.
MLI’s current market cap is about $2.7 billion. Mueller pays out a quarterly dividend of 13 cents per share. That gives the stock a dividend yield of about 1.1%. Mueller traces its roots back to 1917.
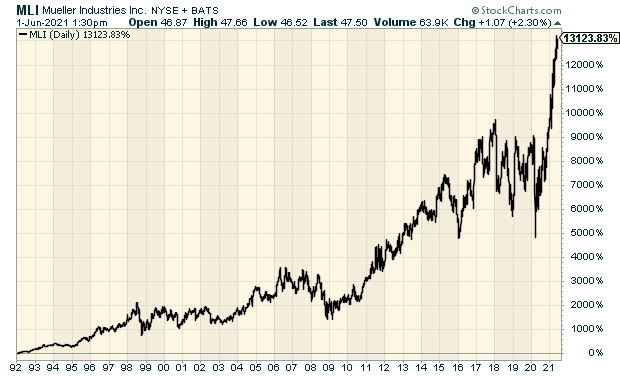
Last year, when Covid first hit, shares of MLI got chopped in half within a few weeks. The stock fell from $34 to $16. Since then, the shares have roared back. Recently, MLI broke above $48 per share. That’s a remarkable turnaround. Over the last 30 years, MLY has gained 132-fold (including dividends).
Let’s look at some numbers. A few weeks ago, Mueller reported very good numbers for Q1. The company made $1.11 per share which nearly doubled the 57 cents per share one year ago. The rise in copper prices has been a big help for Mueller.
Last year, Mueller made $2.47 per share. I think the company has a decent shot of making $4 per share for this year. If I’m right, that means the stock is going for less than 12 times this year’s earnings.
One of the best valuation metrics to follow is Enterprise Value/EBITDA. For Mueller, that’s currently just under 9.57 which is very good. In fact, I think it would be quite reasonable to pay 20% more than that. In February, Muller raised its quarterly dividend by 30% to 13 cents per share.
Best of all, zero Wall Street analysts follow the stock. Keep an eye on Mueller. This could be a big winner in the months ahead.
That’s all for now. I’ll have more for you in the next issue of CWS Market Review.
– Eddy
P.S. Don’t forget to sign up for our premium newsletter.
Posted by Eddy Elfenbein on June 1st, 2021 at 3:17 pm
The information in this blog post represents my own opinions and does not contain a recommendation for any particular security or investment. I or my affiliates may hold positions or other interests in securities mentioned in the Blog, please see my Disclaimer page for my full disclaimer.
-
Archives
- July 2026
- June 2026
- May 2026
- April 2026
- March 2026
- February 2026
- January 2026
- December 2025
- November 2025
- October 2025
- September 2025
- August 2025
- July 2025
- June 2025
- May 2025
- April 2025
- March 2025
- February 2025
- January 2025
- December 2024
- November 2024
- October 2024
- September 2024
- August 2024
- July 2024
- June 2024
- May 2024
- April 2024
- March 2024
- February 2024
- January 2024
- December 2023
- November 2023
- October 2023
- September 2023
- August 2023
- July 2023
- June 2023
- May 2023
- April 2023
- March 2023
- February 2023
- January 2023
- December 2022
- November 2022
- October 2022
- September 2022
- August 2022
- July 2022
- June 2022
- May 2022
- April 2022
- March 2022
- February 2022
- January 2022
- December 2021
- November 2021
- October 2021
- September 2021
- August 2021
- July 2021
- June 2021
- May 2021
- April 2021
- March 2021
- February 2021
- January 2021
- December 2020
- November 2020
- October 2020
- September 2020
- August 2020
- July 2020
- June 2020
- May 2020
- April 2020
- March 2020
- February 2020
- January 2020
- December 2019
- November 2019
- October 2019
- September 2019
- August 2019
- July 2019
- June 2019
- May 2019
- April 2019
- March 2019
- February 2019
- January 2019
- December 2018
- November 2018
- October 2018
- September 2018
- August 2018
- July 2018
- June 2018
- May 2018
- April 2018
- March 2018
- February 2018
- January 2018
- December 2017
- November 2017
- October 2017
- September 2017
- August 2017
- July 2017
- June 2017
- May 2017
- April 2017
- March 2017
- February 2017
- January 2017
- December 2016
- November 2016
- October 2016
- September 2016
- August 2016
- July 2016
- June 2016
- May 2016
- April 2016
- March 2016
- February 2016
- January 2016
- December 2015
- November 2015
- October 2015
- September 2015
- August 2015
- July 2015
- June 2015
- May 2015
- April 2015
- March 2015
- February 2015
- January 2015
- December 2014
- November 2014
- October 2014
- September 2014
- August 2014
- July 2014
- June 2014
- May 2014
- April 2014
- March 2014
- February 2014
- January 2014
- December 2013
- November 2013
- October 2013
- September 2013
- August 2013
- July 2013
- June 2013
- May 2013
- April 2013
- March 2013
- February 2013
- January 2013
- December 2012
- November 2012
- October 2012
- September 2012
- August 2012
- July 2012
- June 2012
- May 2012
- April 2012
- March 2012
- February 2012
- January 2012
- December 2011
- November 2011
- October 2011
- September 2011
- August 2011
- July 2011
- June 2011
- May 2011
- April 2011
- March 2011
- February 2011
- January 2011
- December 2010
- November 2010
- October 2010
- September 2010
- August 2010
- July 2010
- June 2010
- May 2010
- April 2010
- March 2010
- February 2010
- January 2010
- December 2009
- November 2009
- October 2009
- September 2009
- August 2009
- July 2009
- June 2009
- May 2009
- April 2009
- March 2009
- February 2009
- January 2009
- December 2008
- November 2008
- October 2008
- September 2008
- August 2008
- July 2008
- June 2008
- May 2008
- April 2008
- March 2008
- February 2008
- January 2008
- December 2007
- November 2007
- October 2007
- September 2007
- August 2007
- July 2007
- June 2007
- May 2007
- April 2007
- March 2007
- February 2007
- January 2007
- December 2006
- November 2006
- October 2006
- September 2006
- August 2006
- July 2006
- June 2006
- May 2006
- April 2006
- March 2006
- February 2006
- January 2006
- December 2005
- November 2005
- October 2005
- September 2005
- August 2005
- July 2005
 Eddy Elfenbein is a Washington, DC-based speaker, portfolio manager and editor of the blog Crossing Wall Street. His