CWS Market Review – April 11, 2023
(This is the free version of CWS Market Review. If you like what you see, then please sign up for the premium newsletter for $20 per month or $200 for the whole year. If you sign up today, you can see our two reports, “Your Handy Guide to Stock Orders” and “How Not to Get Screwed on Your Mortgage.”)
What to Expect from Tomorrow’s CPI Report
The stock market has been holding up pretty well over the past few days. Despite a small drop on Tuesday, the S&P 500 is still close to a two-month high. The longer-term rally that started six months ago appears to be intact. The stock market keeps making higher highs and higher lows. That’s good to see.
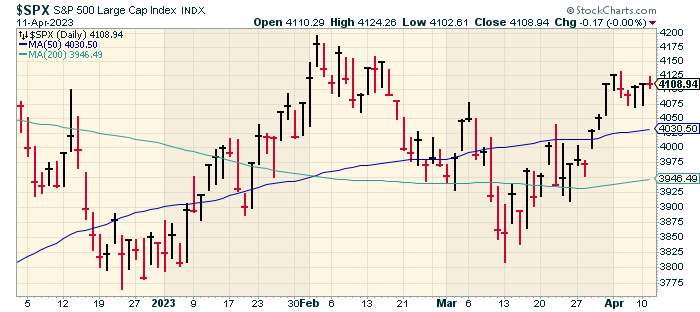
The next big test for the market will come tomorrow when the government releases the CPI report for March. The good news is that inflation has cooled off over the last several months. The bad news is that it still has a way to go to reach the Federal Reserve’s target of 2%.
The Fed has declared total war against inflation, and it doesn’t care how much damage to the housing sector it needs to do to guarantee victory. So far, the results have been unimpressive.
Last June, the 12-month inflation rate reached 9.1%. In February, the 12-month rate rate reached 6.0% That’s still too high. For March, the 12-month rate is expected to fall to 5.2%. I’m afraid that may be overly optimistic. Either way, I don’t see the Fed pulling back on its rate hikes just yet.
Economists like to focus on the “core rate” of inflation because that strips out food and energy prices. The 12-month core rate is expected to be 5.6% which is an increase of 0.1% over the 12-month rate for February. The major change to inflation recently is that home prices have been falling, and that will probably be reflected in tomorrow’s report.
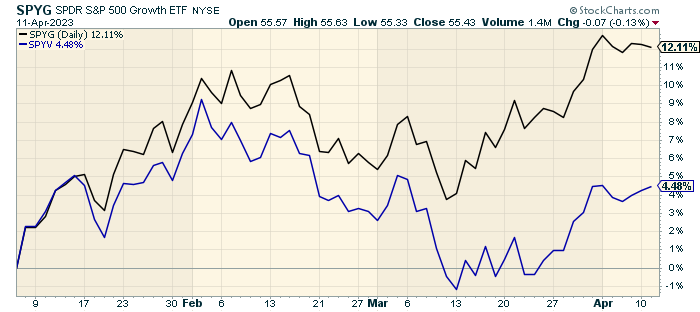
The Fed’s gameplan for the economy is important for investors because Wall Street has been expecting the Fed to pause its rate hikes sometime soon. That belief has spurred a big rally in growth stocks since the start of this year.
Since January 5, the S&P 500 Growth ETF (black line) is up 12.11% while the S&P 500 Value Index (blue line) is up only 4.48%. It’s as if Wall Street expects the Fed to bring back the furious low-quality rally that dominated Wall Street in 2020 and 2021. Speaking of which, bitcoin broke $30,000 today. The cryptocurrency is up more than 80% this year.
There’s a growing gap between what the Fed is saying and what Wall Street expects. Fed officials are talking tough, but Wall Street only sees a worsening economy and trouble with the banks.
The futures market now strongly favors another 0.25% rate hike at the next Fed meeting in three weeks. After that, the data starts to get a little noisy. Traders expect a 0.25% hike in May, and they then expect it to be taken away in July. Traders expect two more cuts later this year, in November and again in December. This reflects Wall Street’s fear that the economy is slowing down. For next year, traders see the Fed cutting rate by 125 basis points.
On top of inflation, earnings season kicks off this week. On Friday, several major banks such as Wells Fargo, Citigroup and JPMorgan are due to report earnings. I’ll be curious to hear if the banks have been impacted by the recent mess in the banking sector. I suspect it happened too late in Q1 to have a major impact. In fact, the big banks probably benefitted from customers leaving.
For the market as a whole, Q1 earnings are expected to be 6.8% lower than last year’s Q1. Abbott Labs will be our first Buy List stock to report earnings, one week from tomorrow.
A Closer Look at Last Week’s Jobs Report
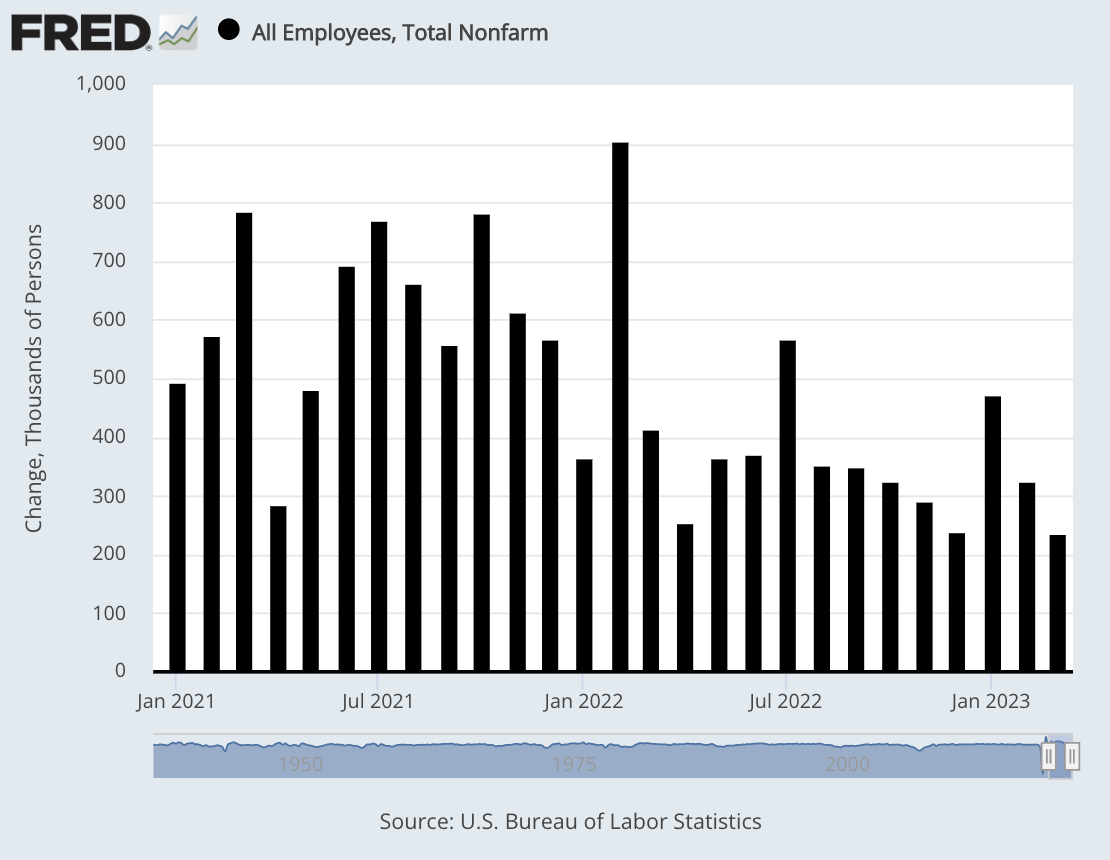
Last Friday, the government reported that the U.S. economy created a net gain of 236,000 new jobs during March. This was unusual because it nearly matched Wall Street’s forecast for a gain of 238,000. The economy added 326,000 jobs during February.
The unemployment rate ticked down 0.1% to 3.5% which is still near a multi-decade low. The unemployment rate for African Americans fell 0.7% to 5% which is the lowest since the government started tracking the data 61 years ago. The jobs-to-population ratio for African Americans last month was higher than it was for white Americans. I should note that that’s not a precise comparison since the white community tends to be older.
The problem spot continues to be wages. Last month, average hourly earnings rose by 0.3%. Over the last year, earnings are up 4.2%. That’s the lowest 12-month growth rate in nearly two years.
With previous economies, we’ve talked about jobless recoveries. This time, it seems like we have growthless hiring. That may be explained by the fact that earnings have trailed inflation.
I’ll be honest – it was a pretty good report, but it doesn’t alter my view that the broader economy is slowing down. This was the lowest monthly gain for new jobs since December 2020. Since the stock market was closed for Good Friday, we couldn’t see the market’s reaction until Monday when the S&P 500 moved a bit higher.
Here are some details from the report:
Leisure and hospitality led sectors with growth of 72,000 jobs, below the 95,000 pace of the past six months. Government (47,000), professional and business services (39,000) and health care (34,000) also posted solid increases. Retail saw a loss of 15,000 positions.
While the February report was revised up from its initially reported 311,000, January’s number moved lower to 472,000, a reduction of 32,000 from the last estimate.
An alternative measure of unemployment that includes discouraged workers and those holding part-time jobs for economic reasons edged lower to 6.7%. The household survey, which is used to calculate the unemployment rate, was much stronger than the establishment survey, showing growth of 577,000 jobs.
Also last week, the Labor Department said that job openings fell to 9.9 million. That was the lowest number in nearly two years. There used to be 1.9 jobs for every unemployed person. That has fallen to 1.7 jobs.
Are Stocks Really Too Expensive?
The Wall Street Journal recently ran a story titled, “Stocks Haven’t Looked This Unattractive Since 2007.” These stories always get my attention. The financial media’s track record isn’t merely bad – it can often be a perfectly negative indicator.
This isn’t new. The New York Times famously said that stocks looked good just before the Panic of 1893. Both political parties get into the act. Right at the 2009 low, the WSJ told us, “Obama’s Radicalism Is Killing the Dow.” Paul Krugman said much the same after President Trump was elected.
But I wanted to look at the WSJ’s case this time. The argument is that the stock market’s equity risk premium is at 1.59% which is very low.
The equity risk premium is the yield difference between the 10-year Treasury and the stock market’s earnings yield (that’s the inverse of the P/E Ratio). The argument is that stock investors are not being paid very much to shoulder the risk of owning stocks. Typically, stocks carry earnings yields are that 3% to 4% more than the 10-year Treasury.
But this analysis misses a key point. This only looks at the relative value of stocks versus bonds, not the value of stocks in general. In fact, it could mean that bonds are underpriced. The equity risk premium could return to normal if bonds rallied. The Fed hiking rates over the last year has had a big impact on Treasury yields.
With the Fed moving against inflation as it has, that’s distorted the overall market. Bond yields and mortgage rates would never be this high without the Fed’s intervention. Stocks aren’t expensive right now. Instead, the yield curve has been squeezed to the brink and it will redound on the economy.
Stock Focus: Stryker
This week, I’ve chosen one of our Buy List stocks to focus on which is Stryker (SYK). This is one of my favorite stocks and it’s been a member of the Buy List for a long time. Stryker is one of the world’s leading orthopedic companies.
We first added Stryker to our Buy List on December 31, 2007. This is its 16th year on our Buy List.
As it turns out, we added Stryker at a terrible time. The stock rallied well during 2007. Our initial price was $74.72 per share which I thought was a good price. It wasn’t. By March of 2009, SYK was going for $30 per share. Ugh!
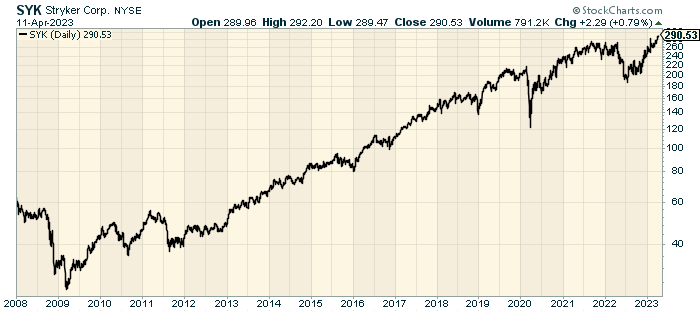
But we held on. We didn’t make a profit on Stryker until the middle of 2013. We continued to hold on. From the beginning of 2013 until August of 2019, Stryker gained 340% for us while the S&P 500 gained 133%.
The stock hit another rough patch for us last year. With its Q1 earnings report last April, Stryker said it expected full-year earnings to come in at the low end of its range which was $9.60 to $10 per share. In July, Stryker lowered its range to $9.30 to $9.50 per share. In October, it was lowered again to $9.15 to $9.25 per share. In two months, shares of SYK lost 30%.
But we held on. As it turned out, Stryker made $9.34 per share last year. The company said it expects earnings this year between $9.85 and $10.15 per share. Not only has Stryker made back everything it lost, but the stock hit a new all-time high today of $292.20 per share.
We’re still holding on.
That’s all for now. I’ll have more for you in the next issue of CWS Market Review.
– Eddy
P.S. If you want more info on our ETF, you can check out the ETF’s website.
Posted by Eddy Elfenbein on April 11th, 2023 at 6:31 pm
The information in this blog post represents my own opinions and does not contain a recommendation for any particular security or investment. I or my affiliates may hold positions or other interests in securities mentioned in the Blog, please see my Disclaimer page for my full disclaimer.
-
Archives
- July 2026
- June 2026
- May 2026
- April 2026
- March 2026
- February 2026
- January 2026
- December 2025
- November 2025
- October 2025
- September 2025
- August 2025
- July 2025
- June 2025
- May 2025
- April 2025
- March 2025
- February 2025
- January 2025
- December 2024
- November 2024
- October 2024
- September 2024
- August 2024
- July 2024
- June 2024
- May 2024
- April 2024
- March 2024
- February 2024
- January 2024
- December 2023
- November 2023
- October 2023
- September 2023
- August 2023
- July 2023
- June 2023
- May 2023
- April 2023
- March 2023
- February 2023
- January 2023
- December 2022
- November 2022
- October 2022
- September 2022
- August 2022
- July 2022
- June 2022
- May 2022
- April 2022
- March 2022
- February 2022
- January 2022
- December 2021
- November 2021
- October 2021
- September 2021
- August 2021
- July 2021
- June 2021
- May 2021
- April 2021
- March 2021
- February 2021
- January 2021
- December 2020
- November 2020
- October 2020
- September 2020
- August 2020
- July 2020
- June 2020
- May 2020
- April 2020
- March 2020
- February 2020
- January 2020
- December 2019
- November 2019
- October 2019
- September 2019
- August 2019
- July 2019
- June 2019
- May 2019
- April 2019
- March 2019
- February 2019
- January 2019
- December 2018
- November 2018
- October 2018
- September 2018
- August 2018
- July 2018
- June 2018
- May 2018
- April 2018
- March 2018
- February 2018
- January 2018
- December 2017
- November 2017
- October 2017
- September 2017
- August 2017
- July 2017
- June 2017
- May 2017
- April 2017
- March 2017
- February 2017
- January 2017
- December 2016
- November 2016
- October 2016
- September 2016
- August 2016
- July 2016
- June 2016
- May 2016
- April 2016
- March 2016
- February 2016
- January 2016
- December 2015
- November 2015
- October 2015
- September 2015
- August 2015
- July 2015
- June 2015
- May 2015
- April 2015
- March 2015
- February 2015
- January 2015
- December 2014
- November 2014
- October 2014
- September 2014
- August 2014
- July 2014
- June 2014
- May 2014
- April 2014
- March 2014
- February 2014
- January 2014
- December 2013
- November 2013
- October 2013
- September 2013
- August 2013
- July 2013
- June 2013
- May 2013
- April 2013
- March 2013
- February 2013
- January 2013
- December 2012
- November 2012
- October 2012
- September 2012
- August 2012
- July 2012
- June 2012
- May 2012
- April 2012
- March 2012
- February 2012
- January 2012
- December 2011
- November 2011
- October 2011
- September 2011
- August 2011
- July 2011
- June 2011
- May 2011
- April 2011
- March 2011
- February 2011
- January 2011
- December 2010
- November 2010
- October 2010
- September 2010
- August 2010
- July 2010
- June 2010
- May 2010
- April 2010
- March 2010
- February 2010
- January 2010
- December 2009
- November 2009
- October 2009
- September 2009
- August 2009
- July 2009
- June 2009
- May 2009
- April 2009
- March 2009
- February 2009
- January 2009
- December 2008
- November 2008
- October 2008
- September 2008
- August 2008
- July 2008
- June 2008
- May 2008
- April 2008
- March 2008
- February 2008
- January 2008
- December 2007
- November 2007
- October 2007
- September 2007
- August 2007
- July 2007
- June 2007
- May 2007
- April 2007
- March 2007
- February 2007
- January 2007
- December 2006
- November 2006
- October 2006
- September 2006
- August 2006
- July 2006
- June 2006
- May 2006
- April 2006
- March 2006
- February 2006
- January 2006
- December 2005
- November 2005
- October 2005
- September 2005
- August 2005
- July 2005
 Eddy Elfenbein is a Washington, DC-based speaker, portfolio manager and editor of the blog Crossing Wall Street. His