CWS Market Review – September 26, 2023
(This is the free version of CWS Market Review. If you like what you see, then please sign up for the premium newsletter for $20 per month or $200 for the whole year. If you sign up today, you can see our two reports, “Your Handy Guide to Stock Orders” and “How Not to Get Screwed on Your Mortgage.”)
The S&P 500 Drops to a Three-Month Low
Wall Street has been in a sour mood lately. As I’ve discussed before, early fall has historically been a tough time for Wall Street. It’s happening again this year. On Tuesday, the Dow had its worst day since March. The S&P 500 closed at its lowest level since June 7.
It’s as if everyone got back from the Labor Day weekend in a lousy mood. This time, investors are worried about a sluggish economy and (another) potential government shutdown. Mind you, the market hasn’t experienced a sudden drop. Instead, it’s been a slow and gradual decline. Nor has the damage been severe — at least not yet.
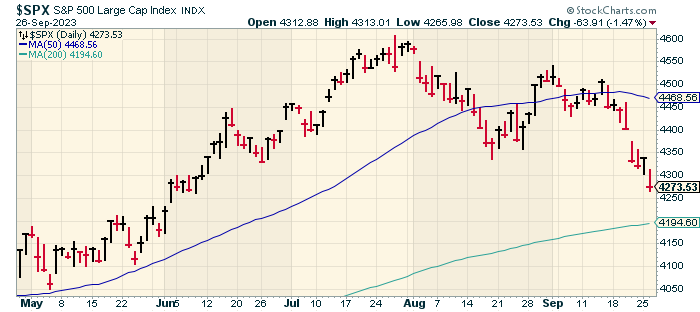
Since the end of July, the S&P 500 has pulled back by 6.9%. The S&P 500 had already dropped below its 50-day moving average, which can be a sign of continued weakness. The index isn’t far from its 200-day moving average (the green line in the chart above). The S&P 500 has traded above its 200-DMA without stop for more than nine months.
Counting Thursday, the S&P 500 has now had six daily drops of more than 1% in August and September. In July and August, there were zero 1% drops.
Of course, we should remember that the market had a very nice run from mid-March until late July. The S&P 500 gained 19% in 20 weeks.
As impressive as the July peak was, it was still well short of the all-time peak from early 2022. This means the stock market has gone 21 months without making a new high. And I’m not adjusting that for an unpleasant bout of inflation which isn’t fading as quickly as we hoped.
Here’s an odd stat for you. The S&P 500 has closed higher for the last 12 Mondays in a row. That’s an all-time record (via Callie Cox).
The market may be sensing a growing unease among consumers. On Tuesday, the Conference Board reported that consumer confidence fell to a four-month low. I like to keep a close eye on the report because so much of the economy comes down to how optimistic people are.
For September, the Conference Board’s Consumer Confidence Index fell to 103. That’s down from 108.7 for August. It’s the second-lowest reading for this year. In fact, this month’s number came close to dipping below May’s number of 102.5 which would have been the lowest number this year.
Interestingly, the drop in consumer confidence was felt most strongly among folks who make more than $50,000 per year.
Within the Consumer Confidence report, the Conference Board also tracks its Expectations Index. For September, that fell to 73.7. Unofficially, a reading below 80 often tells us that a recession is near. I don’t want to sound alarmist, but we should note that consumers are feeling anxious.
What’s driving all this negative sentiment? That’s not much of a secret. Consumers are worried about higher interest rates, higher mortgage rates and rising gasoline prices. America’s credit card debt recently hit $1 trillion. Overall household debt is now more than $17 trillion.
Folks are feeling the strain. Bank of America recently said that the number of people tapping their 401(k) accounts due to financial stress jumped 36% from a year ago.
Look at the bond market where we see rising yields. The 10-year Treasury yield recently hit a 16-year high while the two-year yield touched a 17-year high. In fact, the two-year yield came within 17 basis points of making a 23-year high. Two years ago, the two-year yield was going for 0.3%. Now it’s going for 5.1%.
The housing market is also feeling the squeeze of higher rates. On Tuesday, the Census Bureau said that sales of new homes fell 8.7% from July to August (that’s seasonally-adjusted and annualized). That’s the slowest pace since March.
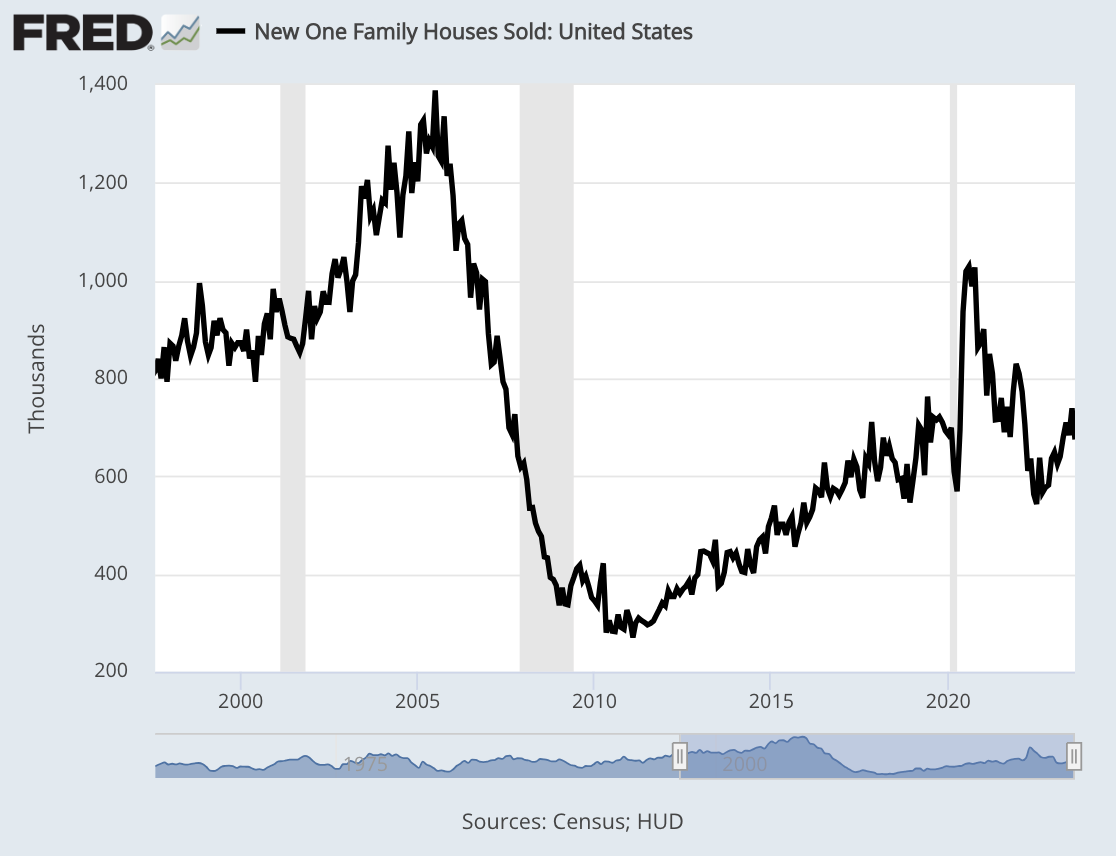
Guess what happens when there’s more supply than demand? That’s right. Prices drop. The median price of a new home sale in August was $430,300. That’s down 2% from last year. Housing affordability is at a three-decade low.
Homebuilders are cutting prices to get rid of their homes. Interestingly, the supply of new homes was already fairly tight. The problem is that higher mortgage rates are holding back demand.
Expect 10% Earnings Growth for Q3
This week is the final week of trading for Q3. In a few weeks. the Q3 earnings season will start up. The overall earnings results should be pretty good, but that’s largely because earnings one year ago were weak.
Right now, analysts expect earnings to be up nearly 10% compared with last year’s Q3. Wall Street sees the S&P 500 reporting earnings of $55.27 per share. (That’s the index-adjusted number. Every one point in the S&P 500 works out to about $8.35 billion.)
This is a big downward shift in expectations. In the middle of 2022, Wall Street had been expecting Q3 2023 earnings of more than $63 per share. Over the course of the last year, analysts gradually pared back their Q3 estimates by more than 13%. Recently, however, earnings estimates have increased a little bit. The first reports will start coming in in about two weeks.
As important as earnings are, we also want to see the kind of guidance that companies are willing to offer for the rest of this year and into 2024.
Last year was tough for earnings. For all of 2022, earnings were down just over 5% from 2021. That means earnings growth this year will be helped by favorable comparisons. For Q4, Wall Street currently expects earnings growth of close to 14%. If that’s right, it means the S&P 500 will deliver full-year earnings growth of 11.7%.
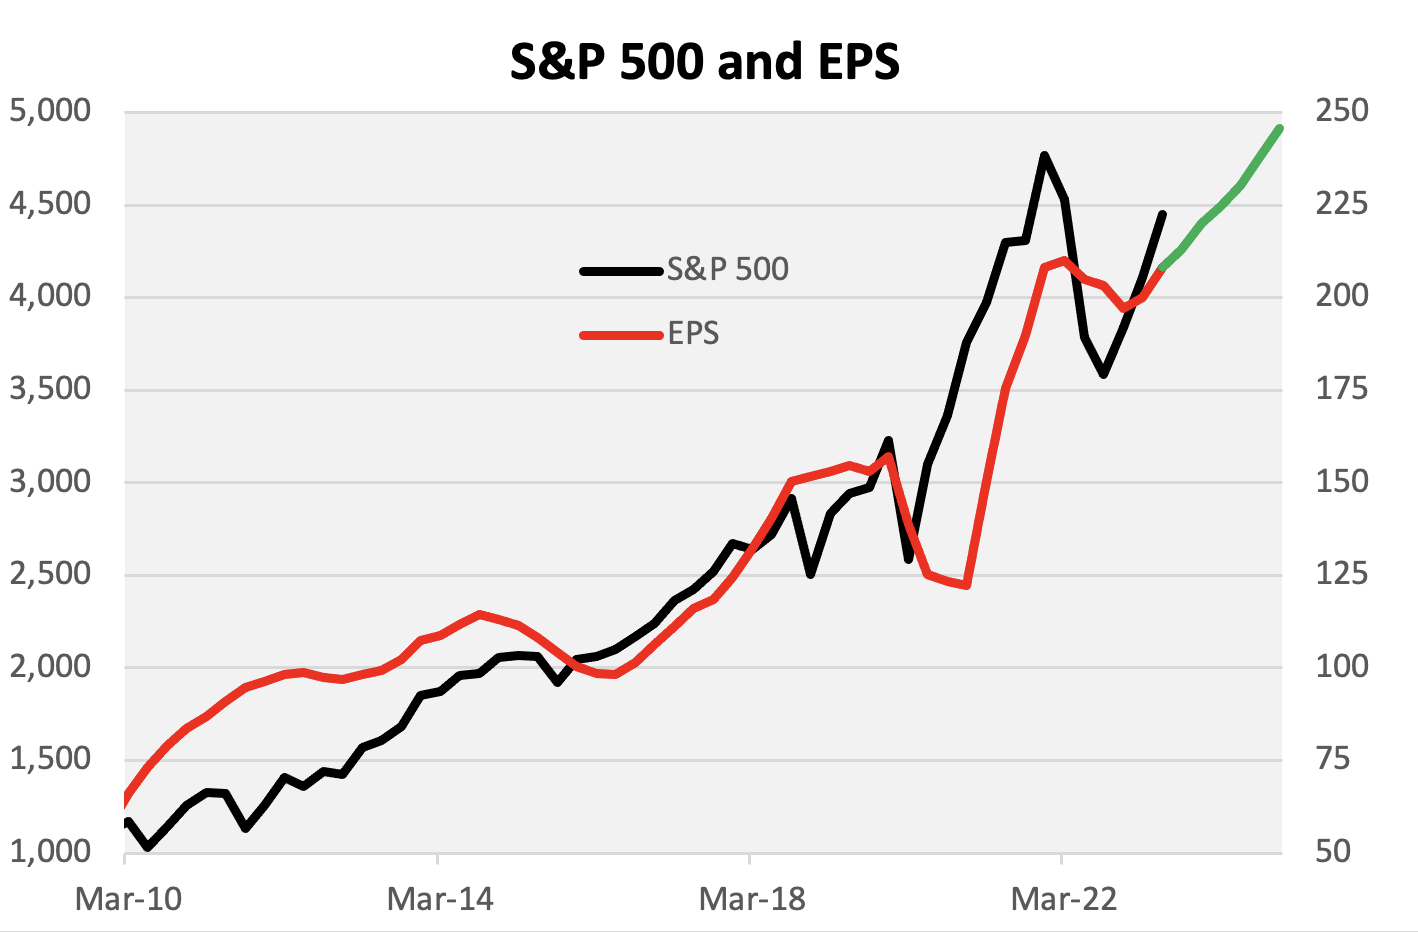
That would place full-year earnings at $220 per share and next year’s earnings at $245 per share. That means the S&P 500 is going for 17.5 times next year’s estimate. That’s a little pricey, but I don’t think it’s unreasonable. Right now, the worry isn’t valuations but rather that earnings growth is falling off.
Here’s the S&P 500 along with its earnings. The two lines are scaled at a ratio of 20 to 1. That means that whenever the lines cross, the S&P 500’s P/E ratio is 20.
The S&P 500 is the black line. Earnings are the red line. The green line is Wall Street’s earnings forecast.
The largest tech stocks are looking very stretched. Charlie Bilello points out that the 10 stocks in the S&P 500 now account for 30.5% of the index’s value. The other 490 stocks comprise the other 70%. The Russell 2000 index is down for this year.
There’s more news to come this week. Tomorrow, we’ll get the durable goods report. Wall Street is expecting a drop of 0.5%.
On Thursday, we’ll get the latest report on initial jobless claims. These reports have been quite good recently. We’ll also get the final revision to Q2 GDP. I’m not too concerned about this report since it covers a time period that began six months ago and ended three months ago. We’ll also get the report on pending home sales.
On Friday, we’ll get reports on personal income and spending. Along with this report, the government will include the PCE price data which is the Fed’s preferred measure of inflation.
That’s all for now. I’ll have more for you in the next issue of CWS Market Review.
– Eddy
P.S. If you want more info on our ETF, you can check out the ETF’s website.
Posted by Eddy Elfenbein on September 26th, 2023 at 5:40 pm
The information in this blog post represents my own opinions and does not contain a recommendation for any particular security or investment. I or my affiliates may hold positions or other interests in securities mentioned in the Blog, please see my Disclaimer page for my full disclaimer.
-
Archives
- July 2026
- June 2026
- May 2026
- April 2026
- March 2026
- February 2026
- January 2026
- December 2025
- November 2025
- October 2025
- September 2025
- August 2025
- July 2025
- June 2025
- May 2025
- April 2025
- March 2025
- February 2025
- January 2025
- December 2024
- November 2024
- October 2024
- September 2024
- August 2024
- July 2024
- June 2024
- May 2024
- April 2024
- March 2024
- February 2024
- January 2024
- December 2023
- November 2023
- October 2023
- September 2023
- August 2023
- July 2023
- June 2023
- May 2023
- April 2023
- March 2023
- February 2023
- January 2023
- December 2022
- November 2022
- October 2022
- September 2022
- August 2022
- July 2022
- June 2022
- May 2022
- April 2022
- March 2022
- February 2022
- January 2022
- December 2021
- November 2021
- October 2021
- September 2021
- August 2021
- July 2021
- June 2021
- May 2021
- April 2021
- March 2021
- February 2021
- January 2021
- December 2020
- November 2020
- October 2020
- September 2020
- August 2020
- July 2020
- June 2020
- May 2020
- April 2020
- March 2020
- February 2020
- January 2020
- December 2019
- November 2019
- October 2019
- September 2019
- August 2019
- July 2019
- June 2019
- May 2019
- April 2019
- March 2019
- February 2019
- January 2019
- December 2018
- November 2018
- October 2018
- September 2018
- August 2018
- July 2018
- June 2018
- May 2018
- April 2018
- March 2018
- February 2018
- January 2018
- December 2017
- November 2017
- October 2017
- September 2017
- August 2017
- July 2017
- June 2017
- May 2017
- April 2017
- March 2017
- February 2017
- January 2017
- December 2016
- November 2016
- October 2016
- September 2016
- August 2016
- July 2016
- June 2016
- May 2016
- April 2016
- March 2016
- February 2016
- January 2016
- December 2015
- November 2015
- October 2015
- September 2015
- August 2015
- July 2015
- June 2015
- May 2015
- April 2015
- March 2015
- February 2015
- January 2015
- December 2014
- November 2014
- October 2014
- September 2014
- August 2014
- July 2014
- June 2014
- May 2014
- April 2014
- March 2014
- February 2014
- January 2014
- December 2013
- November 2013
- October 2013
- September 2013
- August 2013
- July 2013
- June 2013
- May 2013
- April 2013
- March 2013
- February 2013
- January 2013
- December 2012
- November 2012
- October 2012
- September 2012
- August 2012
- July 2012
- June 2012
- May 2012
- April 2012
- March 2012
- February 2012
- January 2012
- December 2011
- November 2011
- October 2011
- September 2011
- August 2011
- July 2011
- June 2011
- May 2011
- April 2011
- March 2011
- February 2011
- January 2011
- December 2010
- November 2010
- October 2010
- September 2010
- August 2010
- July 2010
- June 2010
- May 2010
- April 2010
- March 2010
- February 2010
- January 2010
- December 2009
- November 2009
- October 2009
- September 2009
- August 2009
- July 2009
- June 2009
- May 2009
- April 2009
- March 2009
- February 2009
- January 2009
- December 2008
- November 2008
- October 2008
- September 2008
- August 2008
- July 2008
- June 2008
- May 2008
- April 2008
- March 2008
- February 2008
- January 2008
- December 2007
- November 2007
- October 2007
- September 2007
- August 2007
- July 2007
- June 2007
- May 2007
- April 2007
- March 2007
- February 2007
- January 2007
- December 2006
- November 2006
- October 2006
- September 2006
- August 2006
- July 2006
- June 2006
- May 2006
- April 2006
- March 2006
- February 2006
- January 2006
- December 2005
- November 2005
- October 2005
- September 2005
- August 2005
- July 2005
 Eddy Elfenbein is a Washington, DC-based speaker, portfolio manager and editor of the blog Crossing Wall Street. His