CWS Market Review – December 5, 2023
(This is the free version of CWS Market Review. If you like what you see, then please sign up for the premium newsletter for $20 per month or $200 for the whole year. If you sign up today, you can see our two reports, “Your Handy Guide to Stock Orders” and “How Not to Get Screwed on Your Mortgage.”)
Coming Soon: The 2024 Buy List
Before I begin, I have a special announcement. Circle your calendars for Monday, December 25, 2023.
This year, December 25 is a very important day that millions of people look forward to. That’s the day I’ll unveil the 2024 Buy List. In honor of our new Buy List, the New York Stock Exchange will be closed that day. I’m deeply honored by this recognition.
I always announce the new Buy List a few days before the end of the year so no one can claim I’m somehow messing with the pricing.
I’m going to add five new stocks and sell six current stocks. We got an extra stock in the portfolio this year when Danaher spun off Veralto. We’ll bring the Buy List back down to its normal size of 25 stocks.
The new Buy List will go into effect on January 2 which will be the first trading day of next year. For track record purposes, the “buy price” of each stock will be the closing price from December 29 which is the final day of trading for this year.
All the stocks will be equally weighted based on the end of the year’s closing price. This will be the 19th year that I’ve made our Buy List public.
Our ETF, the AdvisorShares Focused Equity ETF (CWS) is based off the Buy List, and we try to make the fund track our Buy List as close as we can.
Speaking of our Buy List, yesterday we had a very good earnings report from Science Applications International (SAIC). The company is an important IT resource for the federal government, especially the Department of Defense.
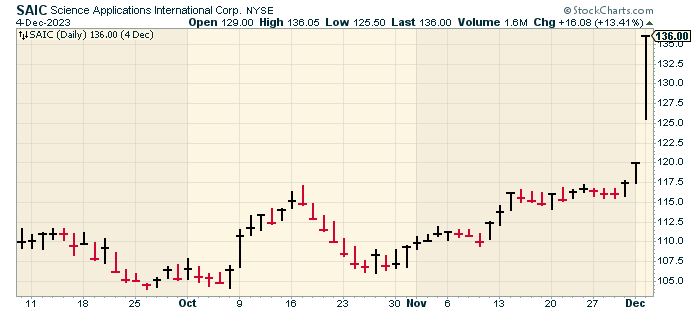
SAIC beat Wall Street’s earnings forecast by more than 30%. The company also raised its full-year guidance for the third time this year. Yesterday, the stock jumped more than 13% for us. I’ll have more details in this week’s premium newsletter. You can sign up for the premium letter here.
Is the Labor Market Starting to Crack?
On Friday, the S&P 500 closed at 4,594.63 which finally exceeded its high from July 31st.
There’s some unusual symmetry at work. The first trading day in December surpassed the peak from the last day of trading in July. Now the next-highest peak came on the second-to-last day in March 2022. We’re still below the all-time peak which came on the first day of trading in 2022.
This week is Jobs Week. Tomorrow, we’ll get the ADP private payroll report. Then on Thursday, the government will release the latest report on jobless claims. That leads us up to Friday when we’ll get the official jobs report for November.
Until now, the labor market had been the solid base of the economy. As the housing market started to feel the heat of higher mortgage rates, we’ve still seen robust hiring. That may be changing.
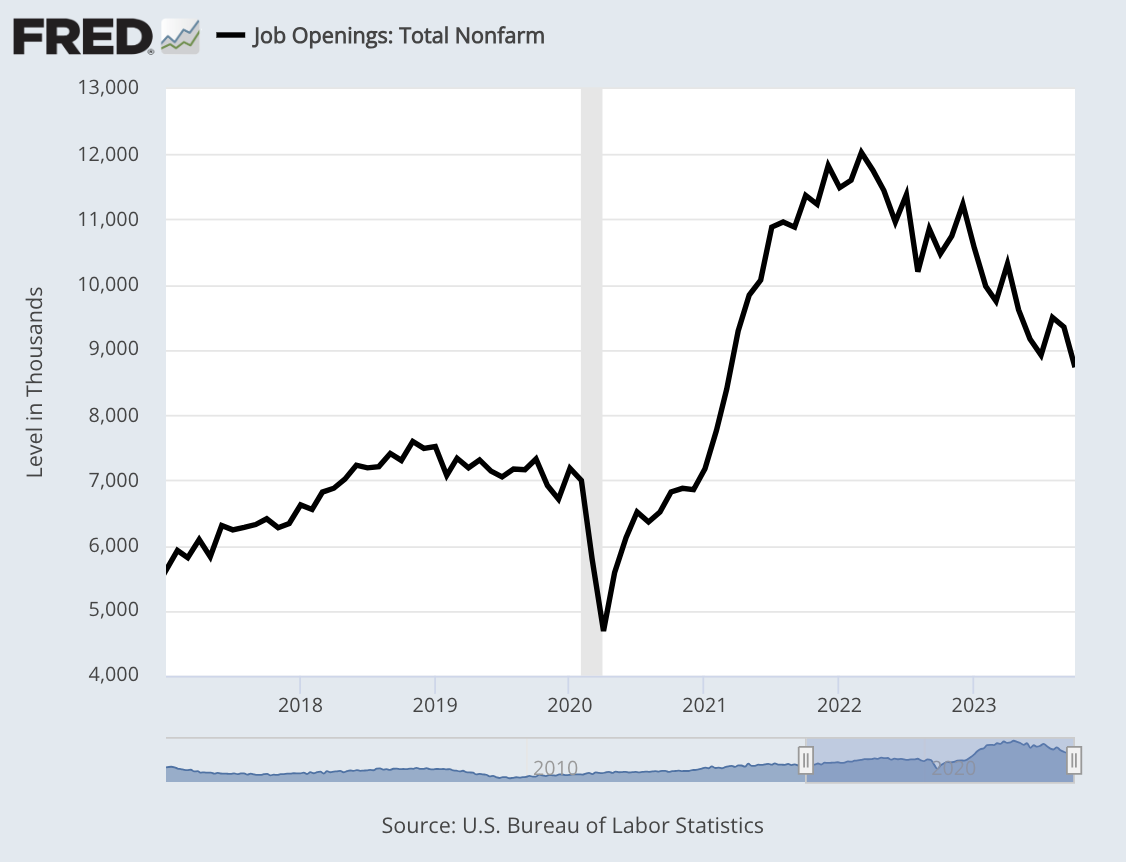
This morning, we got the JOLTS report for October. That stands for Job Openings and Labor Turnover Survey. According to the JOLTS report, job openings dropped to a 2-1/2 year low in October.
The number of job openings fell by 617,000 to 8.72 million. That was below Wall Street’s expectations for 9.4 million. There are now 1.3 job openings for each available worker. Not that long ago, the ratio was 2-to-1.
Interestingly, the “quits rate” didn’t change much. That’s an important number to watch because it’s a good barometer of how easy it is to change jobs. Or more precisely, how easy workers think it will be to change jobs.
During the pandemic, the quits rate got to 3%. You probably remember a lot of talk of the Great Resignation. Now the quits rate is down to 2.3%. Workers have quit quitting.
CNBC noted that “the biggest sector decline was education and health services (-238,000), followed by financial activities (-217,000), leisure and hospitality (-136,000), and retail (-102,000).”
On Friday, the ISM Manufacturing Index came in at 46.7. Any number below 50 means that the factory sector of the economy is contracting. This was the 13th month in a row that the ISM was below 50. That’s the longest streak in more than 20 years. Generally, recessions have been aligned with ISM readings below 45.
For Friday’s jobs report, Wall Street expects to see a gain of 190,000 net new jobs. That would be an increase over October’s sluggish gain of 150,000, but as important as any jobs gain is, I’ll be curious to see any wage gains. Unfortunately, inflation has taken a big bite out of wage gains.
The unemployment rate for October was 3.9%. If the rate for November is 4.3% or higher, that would trigger the “Sahm Rule,” meaning that the U.S. economy would be in a recession.
I discussed the Sahm Rule a few weeks ago. It’s a simple rule to see if the economy is in a recession or not. The Sahm Rule is easy to calculate. It says we’re in a recession when the rolling three-month average for unemployment is 0.5% or more higher than the rolling three-month low over the last 12 months.
I doubt that unemployment will rise that much, but it’s not unthinkable. This news is taking a lot of heat off the Federal Reserve. The Fed meets again next week, and you can dismiss any idea that the Fed will hike interest rates. In fact, you can dismiss the idea for this week and the following meeting next month.
Futures traders are indicating that there’s a 65% chance of the Fed slashing interest rates by 0.25% in March. A weak jobs report might increase those odds.
I like to follow the Treasury yield curve and see what maturity is the highest-yielding one. These tend to go in cycles, from longest maturity to shortest and back again. This is a good way of spotting the peak in the interest-rate cycle.
Lately, the highest-yielding maturity has been in the very near term. From late August through October, the highest-yielding maturity was the four-month Treasury. Then, through most of November, it was the two-month Treasury. For the last few days, it’s been the one-month Treasury. The current yield for the one-month bill is around 5.5%.
Notice in this chart how the one-month Treasury (the black line) is now higher-yielding than both the one-year (blue) and five-year (green) notes. In fact, there’s a noticeably growing gap between the black and blue lines.
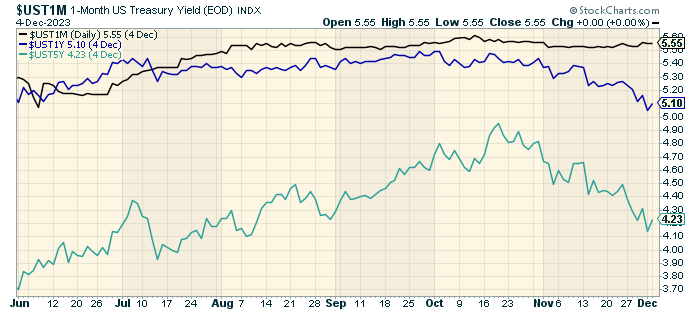
That growing spread is the bond market’s way of telling the Fed to knock it off. The market currently thinks there’s a good chance that interest rates will be more than 1% lower by this time next year. That would be very good news for investors.
Friday’s jobs report will tell us a lot. Next Tuesday, we’ll get the CPI data for November. There’s a good chance the S&P 500 will make a new all-time high before the end of the year.
That’s all for now. I’ll have more for you in the next issue of CWS Market Review.
– Eddy
P.S. If you want more info on our ETF, you can check out the ETF’s website.
Posted by Eddy Elfenbein on December 5th, 2023 at 6:32 pm
The information in this blog post represents my own opinions and does not contain a recommendation for any particular security or investment. I or my affiliates may hold positions or other interests in securities mentioned in the Blog, please see my Disclaimer page for my full disclaimer.
-
Archives
- July 2026
- June 2026
- May 2026
- April 2026
- March 2026
- February 2026
- January 2026
- December 2025
- November 2025
- October 2025
- September 2025
- August 2025
- July 2025
- June 2025
- May 2025
- April 2025
- March 2025
- February 2025
- January 2025
- December 2024
- November 2024
- October 2024
- September 2024
- August 2024
- July 2024
- June 2024
- May 2024
- April 2024
- March 2024
- February 2024
- January 2024
- December 2023
- November 2023
- October 2023
- September 2023
- August 2023
- July 2023
- June 2023
- May 2023
- April 2023
- March 2023
- February 2023
- January 2023
- December 2022
- November 2022
- October 2022
- September 2022
- August 2022
- July 2022
- June 2022
- May 2022
- April 2022
- March 2022
- February 2022
- January 2022
- December 2021
- November 2021
- October 2021
- September 2021
- August 2021
- July 2021
- June 2021
- May 2021
- April 2021
- March 2021
- February 2021
- January 2021
- December 2020
- November 2020
- October 2020
- September 2020
- August 2020
- July 2020
- June 2020
- May 2020
- April 2020
- March 2020
- February 2020
- January 2020
- December 2019
- November 2019
- October 2019
- September 2019
- August 2019
- July 2019
- June 2019
- May 2019
- April 2019
- March 2019
- February 2019
- January 2019
- December 2018
- November 2018
- October 2018
- September 2018
- August 2018
- July 2018
- June 2018
- May 2018
- April 2018
- March 2018
- February 2018
- January 2018
- December 2017
- November 2017
- October 2017
- September 2017
- August 2017
- July 2017
- June 2017
- May 2017
- April 2017
- March 2017
- February 2017
- January 2017
- December 2016
- November 2016
- October 2016
- September 2016
- August 2016
- July 2016
- June 2016
- May 2016
- April 2016
- March 2016
- February 2016
- January 2016
- December 2015
- November 2015
- October 2015
- September 2015
- August 2015
- July 2015
- June 2015
- May 2015
- April 2015
- March 2015
- February 2015
- January 2015
- December 2014
- November 2014
- October 2014
- September 2014
- August 2014
- July 2014
- June 2014
- May 2014
- April 2014
- March 2014
- February 2014
- January 2014
- December 2013
- November 2013
- October 2013
- September 2013
- August 2013
- July 2013
- June 2013
- May 2013
- April 2013
- March 2013
- February 2013
- January 2013
- December 2012
- November 2012
- October 2012
- September 2012
- August 2012
- July 2012
- June 2012
- May 2012
- April 2012
- March 2012
- February 2012
- January 2012
- December 2011
- November 2011
- October 2011
- September 2011
- August 2011
- July 2011
- June 2011
- May 2011
- April 2011
- March 2011
- February 2011
- January 2011
- December 2010
- November 2010
- October 2010
- September 2010
- August 2010
- July 2010
- June 2010
- May 2010
- April 2010
- March 2010
- February 2010
- January 2010
- December 2009
- November 2009
- October 2009
- September 2009
- August 2009
- July 2009
- June 2009
- May 2009
- April 2009
- March 2009
- February 2009
- January 2009
- December 2008
- November 2008
- October 2008
- September 2008
- August 2008
- July 2008
- June 2008
- May 2008
- April 2008
- March 2008
- February 2008
- January 2008
- December 2007
- November 2007
- October 2007
- September 2007
- August 2007
- July 2007
- June 2007
- May 2007
- April 2007
- March 2007
- February 2007
- January 2007
- December 2006
- November 2006
- October 2006
- September 2006
- August 2006
- July 2006
- June 2006
- May 2006
- April 2006
- March 2006
- February 2006
- January 2006
- December 2005
- November 2005
- October 2005
- September 2005
- August 2005
- July 2005
 Eddy Elfenbein is a Washington, DC-based speaker, portfolio manager and editor of the blog Crossing Wall Street. His