CWS Market Review – March 12, 2024
(This is the free version of CWS Market Review. If you like what you see, then please sign up for the premium newsletter for $20 per month or $200 for the whole year. If you sign up today, you can see our two reports, “Your Handy Guide to Stock Orders” and “How Not to Get Screwed on Your Mortgage.”)
Four Years Ago Today
In last week’s issue, I talked about how this time of year has been popular for large-scale market reversals. Today, I want to start off by focusing on one day in particular: March 12, 2020, which was exactly four years ago today.
This was the point at which the world was becoming aware of the scope and magnitude of Covid-19, and March 12, 2020 became one of the most dramatic days in Wall Street history.
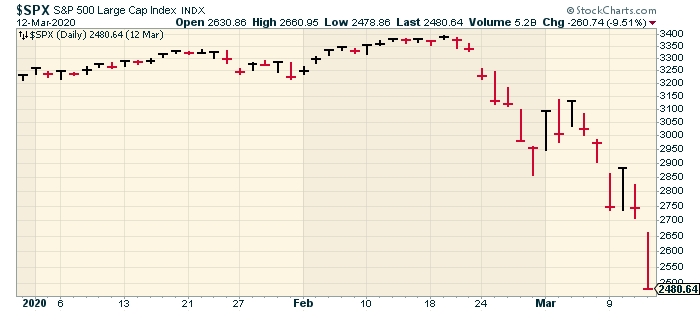
By the time trading was done on March 12, it was the fourth-worst day for the Dow in percentage terms in its 128-year history. Poetically, the Dow fell by 9.99%. The only days worse than that came in 1929 and 1987. Investors were completely panicked. Five of the six largest daily point losses for the Dow came in March 2020. Not only that, but six of the eight largest point gains came in that same month.
The market was particularly rattled that day because the ECB decided against raising interest rates which went against expectations. For its part, the Federal Reserve announced $1.5 trillion in open market purchases.
Trading was halted for the second time that week after the S&P 500 fell 7%. Under the rules of the New York Stock Exchange, trading is halted for 15 minutes after a 7% decline. Trading is halted again after a 13% decline. If the market falls 20% in one day, then the exchange is shut down for the day. I thought that might happen in 2020, but we steered clear of it.
On the NYSE, there were 2,376 new lows and just two new highs. The Volatility Index, or VIX, got up to 76.83. That’s close to the highest in history. The S&P 500 finished that day more than 20% off its high. This marked the first official bear market in 11 years.
On March 12, 2020, guess how many stocks in the S&P 500 were more than 10% off their 52-week high? The answer is 502. That’s not a misprint. Nor are my math skills failing me. There are 500 companies in the index but 505 stocks.
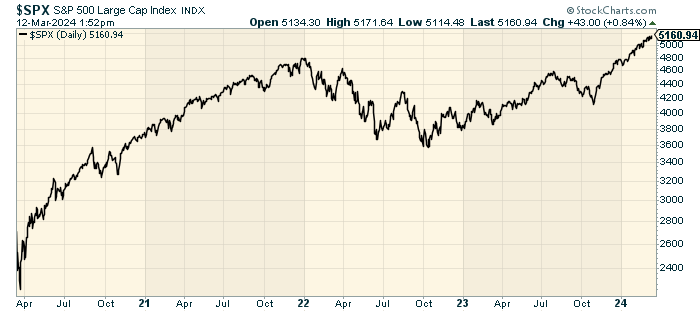
I bring these ugly stats up to show you how well the market has done since that scary day. Indeed, it wasn’t the end of the world. It was really a great time to buy assuming you didn’t panic. Over the last four years, that S&P 500 has more than doubled. If we include dividends, then the market has gained more than 120%. The VIX is now down near 14. I think most people have forgotten about March 12, 2020, but it really happened.
To borrow from Mr. Kipling, “If you can keep your head when all about you are losing theirs…then yours is the Earth and everything that’s in it.”
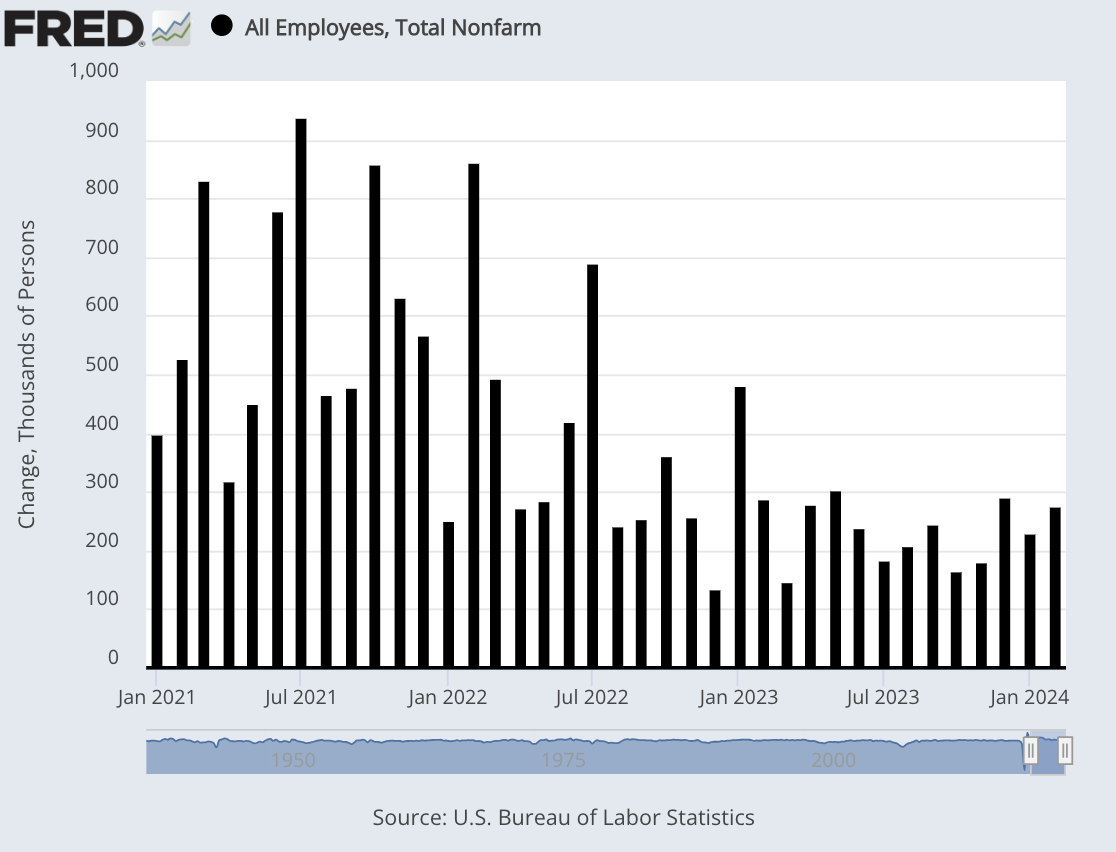
The U.S. Economy Created 275,000 Jobs in February
On Friday, the government said that the U.S. economy created 275,000 net new jobs last month. That beat expectations of 198,000. There was good and bad in this report.
The unemployment rate increased to 3.9%. Technically, this is the highest unemployment level in two years, but it’s still close to a 50-year low. We also had downward revisions in the December and January numbers that came to 167,000 jobs.
Another weak spot is wages. Last month, wages increased by just 0.1%. That was below expectations. Over the last year, wages are up by 4.3%.
The labor force participation rate was unchanged at 62.5%, but the “prime age” rate increased by 0.2% to 83.5%. That’s close to a 20-year high.
Here are some other details:
Job creation skewed toward part-time positions. Full-time jobs decreased by 187,000 while part-time employment rose by 51,000, according to the household survey. An alternative jobless measure, sometimes called the “real” unemployment rate, that includes discouraged workers and those holding part-time jobs for economic reasons rose slightly to 7.3%.
From a sector standpoint, health care led with 67,000 new jobs. Government again was a big contributor, with 52,000, while restaurants and bars added 42,000 and social assistance increased by 24,000. Other gainers included construction (23,000), transportation and warehousing (20,000) and retail (19,000).
In recent weeks, the weekly jobless claims reports have been stable. The economy still had almost 9 million job openings, which is 1.4 for every unemployed person.
Inflation Is Still Running at More than 3%
This morning, the Labor Department released the CPI report for February, and it was largely as expected. Last month, consumer prices increased by 0.4% which matched expectations. Over the last year, inflation is running at 3.2%. That was 0.1% above Wall Street’s forecast.
Core prices also increased by 0.4%. That was 0.1% higher than expected. Over the last year, core inflation is running at 3.8%. That was also 0.1% above consensus. Here’s a look at monthly core inflation:
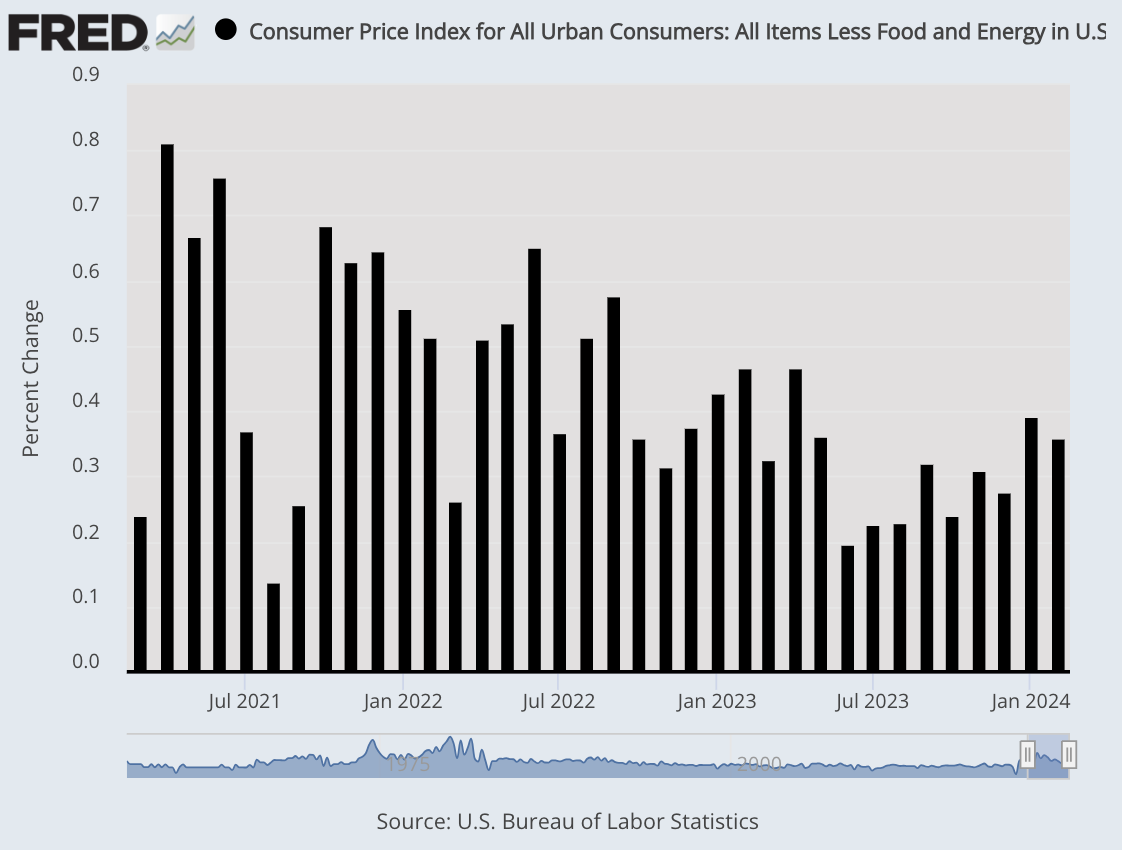
While there’s no terrible news in this report, inflation is still running above the Fed’s target of 2%. If we ignore shelter costs, then inflation is running at 1.8% over the last year. It’s shelter that’s been driving core inflation.
A 2.3% increase in energy costs helped boost the headline inflation number. Food costs were flat on the month, while shelter rose another 0.4%.
The BLS reported that the increases in energy and shelter amounted to more than 60% of the total gain. Gasoline jumped 3.8% on the month while owners’ equivalent rent, a hypothetical gauge of what homeowners could get renting their properties, rose 0.4%.
A few weeks ago, I mentioned the “supercore rate” of inflation which is the cost of services except energy and housing. The supercore rate is more sensitive to labor costs, and it’s tended to remain high. Last month, the supercore rate cooled off to an increase of 0.47%. That’s down from a 0.87% jump in January.
While inflation is down from its peak from two years ago, the numbers are very stubborn once inflation dips below 4%. The stock market wasn’t terribly bothered by this morning’s report, and that seems like the right way to look at it. Growth stocks were up signicantly today while the gains for Value were more modest.
The Federal Reserve meets again next week, and I’ll spoil it for you. They won’t touch interest rates. Nor will they make any changes in May. At the start of this year, Wall Street expected a rate cut in March and May (there’s not a meeting in April).
The June meeting is a different story. I think there’s a decent chance that the Fed will shave 0.25% off interest rates. Traders still see the Fed cutting rates three times this year.
In recent days, it appears that the stock market is following an “either/or” menu. By that, I mean that either the Nasdaq Composite rises and then the Russell 2000 does the exact opposite, or the Russell rises and the Nasdaq falls. There appears to be no middle ground. Today, it was the Nasdaq up and the Russell 2000 down.
That’s all for now. I’ll have more for you in the next issue of CWS Market Review.
– Eddy
P.S. If you want more info on our ETF, you can check out the ETF’s website.
Posted by Eddy Elfenbein on March 12th, 2024 at 6:23 pm
The information in this blog post represents my own opinions and does not contain a recommendation for any particular security or investment. I or my affiliates may hold positions or other interests in securities mentioned in the Blog, please see my Disclaimer page for my full disclaimer.
-
Archives
- July 2026
- June 2026
- May 2026
- April 2026
- March 2026
- February 2026
- January 2026
- December 2025
- November 2025
- October 2025
- September 2025
- August 2025
- July 2025
- June 2025
- May 2025
- April 2025
- March 2025
- February 2025
- January 2025
- December 2024
- November 2024
- October 2024
- September 2024
- August 2024
- July 2024
- June 2024
- May 2024
- April 2024
- March 2024
- February 2024
- January 2024
- December 2023
- November 2023
- October 2023
- September 2023
- August 2023
- July 2023
- June 2023
- May 2023
- April 2023
- March 2023
- February 2023
- January 2023
- December 2022
- November 2022
- October 2022
- September 2022
- August 2022
- July 2022
- June 2022
- May 2022
- April 2022
- March 2022
- February 2022
- January 2022
- December 2021
- November 2021
- October 2021
- September 2021
- August 2021
- July 2021
- June 2021
- May 2021
- April 2021
- March 2021
- February 2021
- January 2021
- December 2020
- November 2020
- October 2020
- September 2020
- August 2020
- July 2020
- June 2020
- May 2020
- April 2020
- March 2020
- February 2020
- January 2020
- December 2019
- November 2019
- October 2019
- September 2019
- August 2019
- July 2019
- June 2019
- May 2019
- April 2019
- March 2019
- February 2019
- January 2019
- December 2018
- November 2018
- October 2018
- September 2018
- August 2018
- July 2018
- June 2018
- May 2018
- April 2018
- March 2018
- February 2018
- January 2018
- December 2017
- November 2017
- October 2017
- September 2017
- August 2017
- July 2017
- June 2017
- May 2017
- April 2017
- March 2017
- February 2017
- January 2017
- December 2016
- November 2016
- October 2016
- September 2016
- August 2016
- July 2016
- June 2016
- May 2016
- April 2016
- March 2016
- February 2016
- January 2016
- December 2015
- November 2015
- October 2015
- September 2015
- August 2015
- July 2015
- June 2015
- May 2015
- April 2015
- March 2015
- February 2015
- January 2015
- December 2014
- November 2014
- October 2014
- September 2014
- August 2014
- July 2014
- June 2014
- May 2014
- April 2014
- March 2014
- February 2014
- January 2014
- December 2013
- November 2013
- October 2013
- September 2013
- August 2013
- July 2013
- June 2013
- May 2013
- April 2013
- March 2013
- February 2013
- January 2013
- December 2012
- November 2012
- October 2012
- September 2012
- August 2012
- July 2012
- June 2012
- May 2012
- April 2012
- March 2012
- February 2012
- January 2012
- December 2011
- November 2011
- October 2011
- September 2011
- August 2011
- July 2011
- June 2011
- May 2011
- April 2011
- March 2011
- February 2011
- January 2011
- December 2010
- November 2010
- October 2010
- September 2010
- August 2010
- July 2010
- June 2010
- May 2010
- April 2010
- March 2010
- February 2010
- January 2010
- December 2009
- November 2009
- October 2009
- September 2009
- August 2009
- July 2009
- June 2009
- May 2009
- April 2009
- March 2009
- February 2009
- January 2009
- December 2008
- November 2008
- October 2008
- September 2008
- August 2008
- July 2008
- June 2008
- May 2008
- April 2008
- March 2008
- February 2008
- January 2008
- December 2007
- November 2007
- October 2007
- September 2007
- August 2007
- July 2007
- June 2007
- May 2007
- April 2007
- March 2007
- February 2007
- January 2007
- December 2006
- November 2006
- October 2006
- September 2006
- August 2006
- July 2006
- June 2006
- May 2006
- April 2006
- March 2006
- February 2006
- January 2006
- December 2005
- November 2005
- October 2005
- September 2005
- August 2005
- July 2005
 Eddy Elfenbein is a Washington, DC-based speaker, portfolio manager and editor of the blog Crossing Wall Street. His