Author Archive
-
Morning News: February 23, 2022
Eddy Elfenbein, February 23rd, 2022 at 7:02 amThe Russia-Ukraine Crisis Is Shaking Markets and Portfolios
Europe’s Banks Brace For Russia Fallout While U.S. Banks See Limited Pain
Putin Insulated Russia’s Economy. Will Biden’s Sanctions Hold Him Back in Ukraine?
Western Sanctions On Banks Only Scratch Surface Of Fortress Russia
As Sanctions Start, Russia’s Trade Flow Shifting Towards China
Climate Fears on Back Burner as Fuel Costs Soar and Russia Crisis Deepens
Gold Fights Off Rising Rates, Bitcoin to Be Haven in Tough Times
Omicron Ripping Through Cargo Ships May Exacerbate Shipping Woes
The Global Glut of Clothing Is an Environmental Crisis
IMF Urges BOE To Shrink Balance Sheet by £650 Billion
Some Companies Ditch Annual Raises and Review Worker Pay More Often
Goldman Sachs Wants Its Bonuses Back as Punishment for Jumping Ship
Why This Economic Boom Can’t Lift America’s Spirits
Virgin Hyperloop Lays Off Half Its Staff, Abandons Mass Transit Plan
Macy’s Opts Against Separation of E-Commerce Business
Getting Hitched? Good Luck Finding Food, Photographers and Even Venues
Be sure to follow me on Twitter.
-
Cramer with Carrier’s CEO
Eddy Elfenbein, February 22nd, 2022 at 8:31 pm -
CWS Market Review – February 22, 2022
Eddy Elfenbein, February 22nd, 2022 at 6:54 pm(This is the free version of CWS Market Review. If you like what you see, then please sign up for the premium newsletter for $20 per month or $200 for the whole year. If you sign up today, you can see our two reports, “Your Handy Guide to Stock Orders” and “How Not to Get Screwed on Your Mortgage.”)
War and the Stock Market
The headlines have been dominated by war news from Eastern Europe. As I write this, Russian troops have moved across the border into Ukraine. Let me be clear that this news is not be a cause for you to sell out of the market, particularly any of our Buy List stocks.
I’m hardly a national security expert, so I’ll avoid any commentary on that. However, I will touch upon the long and troubling relationship between war and financial markets.
In fact, it’s not a stretch to say that the growth of modern financial markets is a byproduct of war. When countries have had to raise enormous sums of money to keep the battle going, that has spurred the development of financial centers that could sell war bonds at fantastic rates.
At the outset of World War I, the British government thought it could pay for the war with existing revenues. That wasn’t the case. It was the need for funds, particularly in our Civil War, that created the infrastructure that could later be used to raise money for large-scale corporate ventures.
Here’s a famous photo of Charlie Chaplin being held aloft by Douglas Fairbanks at a Liberty bond drive in 1918:

That bond drive was for $4.1 billion at 4.15%.
One hundred years later, at the exact same spot, your humble editor tries to mimic Chaplin’s gesture:

War, sadly, is big business and it’s often good business, especially if you win. The line attributed to Nathan Rothschild is that one should “buy on drums and sell on trumpets,” meaning to buy at the start of a war and sell once peace returns. In 2003, the stock market reached its bottom right as the fighting started.
During World War II, the stock market fell from Pearl Harbor until April 1942. The ultimate low came on April 28, ten days after the daring Doolittle Raid over Tokyo. The Dow closed at 92.92. To add some context, on September 3, 1929, the Dow had been at 386. So more than twelve years after the peak, the stock market was still about a quarter of where it had been.
The war, however, spurred a big rally for stocks. Within two years, the Dow was up 50%, and it doubled by 1945. By 1955, the Dow was up fivefold, and it doubled again ten years later. The market really didn’t see any pause until 1966 when inflation started to have a major impact. Twenty-four years after FDR’s “Day of Infamy” speech, the Dow had advanced close to 1,000%, and that’s not counting dividends.
At the outbreak of WWI, the stock exchange shut down. They didn’t think it was going to last long. Traders soon started meeting in the street outside the exchange. The NYSE finally relented and trading resumed indoors in November 1914.
What about after the war? Post-war periods have often been associated with ugly bouts of inflation. That’s when the loose money policies come due. Many people remember the persistent inflation of the 1970s, but the post WW2 inflation seems to have been lost down the memory hole. In 1946, inflation was 8.3% and the following year, it got to 14.4%. You rarely hear about that but that’s what happens when you hold back demand for a few years.
Here’s an amazing stat. During World War II, how many cars did America make? The answer is 139. Compare that to the year just before America entered the war, 1941, when we made three million.
I was recently on Michael Gayed’s podcast and I said that in many ways, dealing with Covid has been similar, in an economic sense, to going to war. Not in a literal sense, of course, but the government and the Federal Reserve went to extreme lengths to keep the economy afloat.
In this case, we already had inflation at the outset of hostilities. The price of gold is up to $1,900 per ounce. It was over $2,000 over the summer. Oil may soon be closing in on $100 per barrel. On Friday, the government released a very good retail sales report for January. Last month, retail sales rose by 3.8%. This tells us that higher prices aren’t scaring shoppers away. In fact, they may be getting them off the couch.
This news also jibes with the recent jobs report. More people are working and getting paid higher wages. That’s leading to more shopping and higher prices. That’s good for our stocks.
The inflation debate is falling into two camps. One camp, largely sympathetic with the Biden Administration, is blaming the supply-chain mess. The other side is less sympathetic with the administration. I won’t pick a side, but I suspect that it’s a little of both. The supply chain troubles should soon begin to gradually fade.
The Selloff Is Officially a “Correction”
The stock market had a rough day today. At its low, the Dow was off by 714 points. The S&P 500 finished the day at its lowest level in nearly five months.
This is now an official correction going by market closes. That means a drop of more than 10%. Since January 3, the S&P 500 has lost 10.25%. A bear market is a drop of more than 20%. (I don’t know who comes up with these, but that’s the nomenclature.)
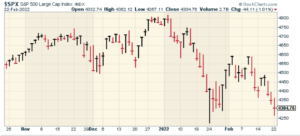
Again, we’re seeing more conservative sectors do well. The S&P 500 Growth Index was off by 1.27% today while the Value Index was down only 0.76%.
This trend has been going on for several weeks. Since early December, the S&P 500 Value Index is up by 2.40% while the S&P 500 Growth Index is down by 12.58%.
There’s a Russia ETF (RSX) that trades on the NYSE. It’s mostly oil and gas companies. Four months ago, RSX was at $33 per share. Today it got down to $20. The Russian ruble fell the most in two years.
Although it’s not on our Buy List, I was curious to see the earnings report today from Home Depot (HD). This is an interesting stock to watch in that it’s far from the largest company on Wall Street, but it’s probably one of the most closely tied to the health of the economy. If the economy is happy, then HD is doing well. If the economy is off the rails, then HD is not doing well.
Home Depot is the largest home-improvement retailer in the world. It runs more than 2,300 warehouse stores. The company is also a component in the Dow Jones Industrial Average.
For its fiscal Q4, HD said it made $3.21 per share. That was a three-cent beat. Year-over-year same-store sales rose by 8.1%. At a nuts-and-bolts level (literally), this was a good report. Plus, HD also boosted its dividend by 15%. The company said it expects earnings growth in the “low single digits” for this year.
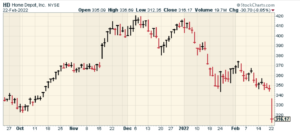
Still, traders were unnerved as shares of HD lost close to 9% today. I don’t think that’s due to Putin. But why were traders so upset? This is part of the larger rotation away from cyclical stocks and towards defensive stocks. Even good earnings won’t spare you.
But I was still surprised that Home Depot was punished so severely today. In financial markets, you want to pay particular attention to things that don’t seem to add up. There’s a good chance you or the market is missing something.
The fate of Home Depot is closely tied to consumer spending and the housing sector. While things are going very well for housing, I’m not sure how much longer the party can last. This morning’s Case-Shiller report said that home prices are rising at the fastest pace in over three decades. Over the last 12 months, home prices are up 18.8%. That’s the fastest calendar year increase in 34 years. Meanwhile, the supply of homes is at a record low.
Perhaps the market is sensing a coming top in the housing market. Plus the Federal Reserve appears ready to hike interest rates several times in the coming year. On top of that, the 2/10 spread is surprisingly low. The Fed could have an inverted yield curve in a few months.
These are signs that it’s smart to steer clear of cyclical stocks and find safety in defensive names. As much as I like Home Depot, I’m not a buyer at these levels.
That’s all for now. I’ll have more for you in the next issue of CWS Market Review.
– Eddy
P.S. Don’t forget to sign up for our premium newsletter.
-
Morning News: February 22, 2022
Eddy Elfenbein, February 22nd, 2022 at 7:15 amEU Proposes Sanctions as Putin Backs Separatists
Germany Puts A Stop To Nord Stream 2, A Key Russian Natural Gas Pipeline
What’s at Stake for the Global Economy as Conflict Looms in Ukraine
Oil Prices Approach $100 on Threat of Ukraine War
U.S. Stocks Face ‘Energy Price Shock,’ JPMorgan Strategists Say
An Obscure Corner of Wall Street Is Making Billions Trading Inflation
To Fill Empty Retail Space, Landlords Tap Doctors and Dentists
Big Tech Makes a Big Bet: Offices Are Still the Future
Porsche IPO Nears With Advanced Talks Under Way
Weather Delays Effort to Steady Burning Ship Carrying Porsche, Bentley, VW Cars
Elon Musk Laughed at the Idea of Tesla Using Too Much Water. Now It’s a Real Problem
Home Depot Stock Rises as Investors Cheer Earnings Beat and Dividend Hike
U.S. Women’s Soccer Players, U.S. Soccer Federation Reach $24 Million Equal Pay Settlement
NBC Draws Lowest Olympics Ratings Ever
The Real Reason the Pandemic Killed Small Restaurants
Crypto Scammers’ New Target: Dating Apps
Be sure to follow me on Twitter.
-
Morning News: February 21, 2022
Eddy Elfenbein, February 21st, 2022 at 7:18 amChina Tells Banks, State Firms to Report Exposure to Jack Ma’s Ant
U.S. Plans to Cut Ties With Targeted Russian Banks If Ukraine Is Invaded
Russia-Ukraine Tensions Power Gold to Eight-Month Highs
Oil Prices Seesaw as Russia Menaces Ukraine
How Europeans Are Responding to Exorbitant Gas and Power Bills
Frackers Push Into Once-Dead Shale Patches as Oil Nears $100 a Barrel
Ottawa Blockade Largely Dispersed As Financial Crackdown Widens
The Next Affordable City Is Already Too Expensive
Is There a Way Out of America’s Impossible Housing Mess?
For White-Collar Workers, It’s Prime Time to Get a Big Raise
Black Farmers Fear Foreclosure as Debt Relief Remains Frozen
JPMorgan Strategists Say Stock Pessimism Is ‘In Vogue,’ But Wrong
Vast Leak Exposes How Credit Suisse Served Strongmen and Spies
Carl Icahn Pushes McDonald’s to Change Way It Sources Its Pork
Apple Finds Itself Under Scrutiny in Washington’s Big Tech Clampdown
When We Were Socially Distant, Money Brought Us Closer
Be sure to follow me on Twitter.
-
Homes for Sale Reach Record Low
Eddy Elfenbein, February 18th, 2022 at 10:34 amThe stock market is up modestly this morning but most of its attention is on Russia and Ukraine. We’re going into a three-day weekend so a lot can happen between today’s close and Tuesday’s open.
One economic report to pass on. Existing home sales rose 6.7% last month. What makes that interesting is that there’s a record low in the supply of homes. Tight supply and strong demand pushed the median price of a home sold in January to $350,300, an increase of 15.4% from January 2021.
The supply of homes for sale fell to a record low, down 16.5% from a year ago. There were just 860,000 homes for sale at the end of January. At the current sales pace it would take just 1.6 months to exhaust that inventory. A 4- to 6-month supply is considered a balanced market. That is also a record low.
There are two news items affecting our stocks.
Abbott Laboratories (ABT) said it is “recalling powdered baby formulas, including Similac, made at a Michigan facility after four consumers complained about bacterial infections in infants who consumed the products.” The stock is down about 3% today.
Sherwin-Williams (SHW) named Heidi Petz its new president and COO, effective March 1.
-
Morning News: February 18, 2022
Eddy Elfenbein, February 18th, 2022 at 7:04 amHow China Beat Out the U.S. to Dominate South America
Inflation Survivors of the 1980s Have Some Advice for You
U.S. Labor Market Still Tightening; Freezing Temperatures Chill Homebuilding
A Japanese Pachinko Company, a Goldman Sachs Alum, and the U.S. Housing Gold Rush
A $2.2 Trillion Crunch Time Looms for Traders Loaded With Stock Hedges
The World Needs What Intel Makes. Can It Make a Comeback?
Roku Stock Plunges On Streaming Spend, Sales Growth Forecasts After Q4 Earnings Miss
Spotify’s Ek Builds ‘Insane’ $1 Billion Bet on Early Tech
Can Quebec’s Dams Power New York City? Blackstone Is Betting $4.5 Billion on It
Facing Texas Pushback, Blackrock Says It Backs Fossil Fuels
Celanese to Buy Most of DuPont’s Mobility and Materials Unit for $11 Billion
Fanatics Is Buying Mitchell & Ness, A Fellow Sports Merchandiser
The Saudi Incursion Into Pro Golf That Could Torpedo the PGA Tour
Morgan Stanley Relationships Across Wall Street Snared in Probe
David Solomon Says Goldman Sachs’ Blockbuster 2021 Was No Fluke
Tesla Tells Federal Judge That SEC Is Harassing Elon Musk and the Company
Be sure to follow me on Twitter.
-
Morning News: February 17, 2022
Eddy Elfenbein, February 17th, 2022 at 7:06 amAfrica’s Largest Economy Exceeds 2021 Growth Forecast
Oil’s Spectacular Covid Crash Set the World Up for $100 Crude
Volatility Is Rising. Here’s How to Protect Your Investment Portfolio.
The Great Rotation Into Stock Funds Risks a 2018-Style Collapse
Regulators Are Looking Into Whether Short Sellers Improperly Influenced Stock Prices
U.S. Retail Sales Jump as Inflation Surges
Google Plans Privacy Changes, but Promises to Not Be Disruptive
How A Saudi Woman’s iPhone Revealed Hacking Around The World
‘Zero-Click’ Hacks Are Growing in Popularity. There’s Practically No Way to Stop Them
Amazon Accepts Visa Credit Cards In Global Truce Over Fees
London Finance Firm Collapse Leaves Golden Visa Holders in Limbo
Doordash Stock Pops 30% On Revenue Beat, Strong Order Numbers
Americans Want to Travel and Are Eager to Splurge, Companies Say
One Major Airline Says Fly As Much As You Want for $49 a Month (Sort of)
Roblox Stock Logs Worst Day Ever As Kids Put Down Their Devices
Why Peloton Spun Out: What Happened to the Bike and Treadmill Firm
Zuckerberg’s ‘Metamates’ Are In for a Long, Rough Voyage
Be sure to follow me on Twitter.
-
The Fed’s Minutes
Eddy Elfenbein, February 16th, 2022 at 2:18 pmThe Federal Reserve just released the minutes from its late January meeting. The market seems to be taking it as a dovish indicator. The futures market has backed some on its belief that the Fed will hike by 0.5% in March.
Here’s the Fed’s economic outlook:
In their discussion of current economic conditions, participants noted that indicators of economic activity and employment had continued to strengthen. The sectors most adversely affected by the pandemic had improved in recent months but continued to be affected by the recent sharp rise in COVID-19 cases. Job gains had been solid in recent months, and the unemployment rate had declined substantially. Supply and demand imbalances related to the pandemic and the reopening of the economy had continued to contribute to elevated levels of inflation. Overall financial conditions had remained accommodative, in part reflecting policy measures to support the economy and the flow of credit to U.S. households and businesses. Participants judged that the path of the economy continued to depend on the course of the virus. Progress on vaccinations and an easing of supply constraints were expected to support continued gains in economic activity and employment as well as a reduction in inflation. Risks to the economic outlook remained, including from new variants of the virus.
With regard to the economic outlook, participants agreed that the Omicron wave of the pandemic would weigh on economic activity in the first quarter of 2022. Indeed, sectors of the economy that are particularly sensitive to pandemic-related disruptions, including travel, leisure, and restaurants, were experiencing sharp reductions in activity as a result of the Omicron wave. Participants commented that, for many afflicted individuals and families, the virus continued to cause great hardship. Participants concurred that if the Omicron wave dissipated quickly, then economic activity would likely strengthen rapidly and economic growth for 2022 as a whole would be robust. Participants cited strong household balance sheets, rising wages, and effective adaptation to the pandemic by the business sector as factors supporting the outlook for strong growth this year. However, a number of participants noted that there was a risk that additional variants could weigh on economic activity this year.
Participants noted that supply chain bottlenecks and labor shortages had continued to limit businesses’ ability to meet strong demand, with these challenges exacerbated by the emergence and spread of the Omicron variant. In particular, the Omicron wave had led to much more widespread worker absences due to illness, virus exposure, or caregiving needs, which had curtailed activity in many sectors including airlines, trucking, and warehousing. Some participants reported that their business contacts were hopeful that the effects of the Omicron wave would be relatively short lived. Nevertheless, several participants reported that their contacts expected the ongoing labor shortages and other supply constraints to persist well after the acute effects of the Omicron wave had waned. Participants’ contacts also reported continued widespread input cost pressures, which, amid generally robust demand, they reported having largely been able to pass on to their customers. A few participants commented that agricultural businesses were experiencing higher input costs, and those higher costs were putting strain on the finances of those firms even as they experienced generally strong demand for their products.
In their discussion of the household sector, many participants noted that the onset of the Omicron wave had damped consumer demand, particularly for services, with much of the recent weakness concentrated in high-contact sectors such as travel, dining, and leisure and hospitality. Almost all of those participants anticipated that household demand would recover briskly if the Omicron wave subsided quickly, with spending supported by strong household balance sheets that were bolstered by high rates of saving earlier in the pandemic and ongoing robust gains in labor income.
Participants noted that the labor market had made remarkable progress in recovering from the recession associated with the pandemic and, by most measures, was now very strong. Increases in employment had been solid in recent months; the unemployment rate had declined sharply, reaching 3.9 percent in December; job openings and quits were near record high levels; and nominal wages were rising at the fastest pace in decades. Several participants commented that the gains, on balance, over recent months had been broad based, with notable improvements for lower-wage workers as well as African Americans and Hispanics. Against this backdrop of a generally strong and improving labor market, many participants observed that the effects of the Omicron variant likely would only temporarily suppress the rate of labor market gains. The labor force participation rate had edged up further over the past few months, and some participants indicated that they expected it to continue to increase as the pandemic eased. A couple of participants noted that the participation rate remained lower than trend levels that account for changing demographics.
Participants noted that their District contacts were reporting that labor demand remained historically strong and that labor supply remained constrained, resulting in a broad shortage of workers across many parts of the economy. As a result, there was widespread evidence that the labor market was very tight, including near-record rates of quits and job vacancies as well as nominal wage growth that was the highest recorded in decades. Several participants reported that District business contacts were either planning to implement or had implemented larger wage increases than those of recent years to retain current employees or attract new workers. A few participants also reported contacts having been forced to reduce operating hours or close businesses temporarily because of labor shortages.
Acknowledging that the maximum level of employment consistent with price stability evolves over time, participants expressed a range of views regarding their assessments of current labor market conditions relative to the Committee’s goal of maximum employment. Many participants commented that they viewed labor market conditions as already at or very close to those consistent with maximum employment, citing indications of strong labor markets including the low levels of unemployment rates, elevated wage pressures, near-record levels of job openings and quits, and a broad shortage of workers across many parts of the economy. A couple of participants commented that, in their view, the economy likely had not yet reached maximum employment, noting that, even for prime-age workers, labor force participation rates were still lower than those that prevailed before the pandemic or that a reallocation of labor across sectors could lead to higher levels of employment over time.
Participants remarked that recent inflation readings had continued to significantly exceed the Committee’s longer-run goal and elevated inflation was persisting longer than they had anticipated, reflecting supply and demand imbalances related to the pandemic and the reopening of the economy. However, some participants commented that elevated inflation had broadened beyond sectors most directly affected by those factors, bolstered in part by strong consumer demand. In addition, various participants cited other developments that had the potential to place additional upward pressure on inflation, including real wage growth in excess of productivity growth and increases in prices for housing services. Participants acknowledged that elevated inflation was a burden on U.S. households, particularly those who were least able to pay higher prices for essential goods and services. Some participants reported that their business contacts remained concerned about persistently high inflation and that they were adjusting their business practices to cope with higher input costs—for instance, by raising output prices or utilizing contracts that were contingent on their costs. Participants generally expected inflation to moderate over the course of the year as supply and demand imbalances ease and monetary policy accommodation is removed. Some participants remarked that longer-term measures of inflation expectations appeared to remain well anchored, which would support a return of inflation over time to levels consistent with the Committee’s goals.
In their discussion of risks to the outlook, participants agreed that uncertainty regarding the path of inflation was elevated and that risks to inflation were weighted to the upside. Participants cited several such risks, including the zero-tolerance COVID-19 policy in China that had the potential to further disrupt supply chains, the possibility of geopolitical turmoil that could cause increases in global energy prices or exacerbate global supply shortages, a worsening of the pandemic, persistent real wage growth in excess of productivity growth that could trigger inflationary wage–price dynamics, or the possibility that longer-term inflation expectations could become unanchored. A few participants pointed to the possibility that structural factors that had contributed to low inflation in the previous decade, such as technological changes, demographics, and a low real interest rate environment, may reemerge when the effects of the pandemic abate. Uncertainty about real activity was also seen as elevated. Various participants noted downside risks to the outlook, including a possible worsening of the pandemic, the potential for escalating geopolitical tensions, or a substantial tightening in financial conditions.
Participants who commented on issues related to financial stability cited a number of factors that could represent potential vulnerabilities to the financial system. A few participants noted that asset valuations were elevated across a range of markets and raised the concern that a major realignment of asset prices could contribute to a future downturn. A couple of these participants judged that prolonged accommodative financial conditions could be contributing to financial imbalances. A couple of other participants cited reasons why elevated asset valuations might prove to be less of a threat to financial stability than in past reversals of asset prices. In particular, they noted the relatively healthy balance sheet positions of households and nonfinancial firms, the well-capitalized and liquid banking sector, and the fact that the rise in housing prices was not being fueled by a large increase in mortgage debt as suggesting that the financial system might prove resilient to shocks. Some participants saw emerging risks to financial stability associated with the rapid growth in crypto-assets and decentralized finance platforms. A few participants pointed to risks associated with highly leveraged, nonbank financial institutions or the potential vulnerability of prime money market funds to a sudden withdrawal of liquidity.
In their consideration of the stance of monetary policy, participants agreed that it would be appropriate for the Committee to keep the target range for the federal funds rate at 0 to 1/4 percent in support of the Committee’s objectives of maximum employment and inflation at the rate of 2 percent over the longer run. They also anticipated that it would soon be appropriate to raise the target range. In discussing why beginning to remove policy accommodation could soon be warranted, participants noted that inflation continued to run well above 2 percent and generally judged the risks to the outlook for inflation as tilted to the upside. Participants also assessed that the labor market was strong, having made substantial, broad-based progress over the past year.
In light of elevated inflation pressures and the strong labor market, participants continued to judge that the Committee’s net asset purchases should be concluded soon. Most participants preferred to continue to reduce the Committee’s net asset purchases according to the schedule announced in December, bringing them to an end in early March. A couple of participants stated that they favored ending the Committee’s net asset purchases sooner to send an even stronger signal that the Committee was committed to bringing down inflation.
Participants discussed the implications of the economic outlook for the likely timing and pace for removing policy accommodation. Compared with conditions in 2015 when the Committee last began a process of removing monetary policy accommodation, participants viewed that there was a much stronger outlook for growth in economic activity, substantially higher inflation, and a notably tighter labor market. Consequently, most participants suggested that a faster pace of increases in the target range for the federal funds rate than in the post-2015 period would likely be warranted, should the economy evolve generally in line with the Committee’s expectation. Even so, participants emphasized that the appropriate path of policy would depend on economic and financial developments and their implications for the outlook and the risks around the outlook, and they will be updating their assessments of the appropriate setting for the policy stance at each meeting. Participants noted that the removal of policy accommodation in current circumstances depended on the timing and pace of both increases in the target range of the federal funds rate and the reduction in the size of the Federal Reserve’s balance sheet. In this context, a number of participants commented that conditions would likely warrant beginning to reduce the size of the balance sheet sometime later this year.
In their discussion of the outlook for monetary policy, many participants noted the influence on financial conditions of the Committee’s recent communications and viewed these communications as helpful in shifting private-sector expectations regarding the policy outlook into better alignment with the Committee’s assessment of appropriate policy. Participants continued to stress that maintaining flexibility to implement appropriate policy adjustments on the basis of risk-management considerations should be a guiding principle in conducting policy in the current highly uncertain environment. Most participants noted that, if inflation does not move down as they expect, it would be appropriate for the Committee to remove policy accommodation at a faster pace than they currently anticipate. Some participants commented on the risk that financial conditions might tighten unduly in response to a rapid removal of policy accommodation. A few participants remarked that this risk could be mitigated through clear and effective communication of the Committee’s assessments of the economic outlook, the risks around the outlook, and the appropriate path for monetary policy.
-
Strong Retail Sales Report for January
Eddy Elfenbein, February 16th, 2022 at 9:48 amApparently, folks don’t care that much about inflation. At least, it’s not keeping them from the malls. This morning’s retail sales report was the strongest in 11 months. Last month, retail sales rose by 3.8%. Bear in mind, that number isn’t adjusted for inflation. Wall Street had been expecting an increase of 2.3%.
Retail sales for December were revised higher to a decline of 1.9%. The original report showed a decline of 2.5%.
Excluding auto sales, the retail gain was 3.3%, after falling 2.8% in the previous month.
Online shopping contributed the most on a percentage basis, with nonstore retailers seeing a gain of 14.5%. Furniture and home furnishing sales increased 7.2%, while motor vehicle and parts dealers saw a 5.7% rise.
Food and drinking establishments, considered a barometer for the pandemic-era economy, saw sales dip just 0.9% for the month despite the major escalation in Covid cases fueled by the omicron spread.
The stock market is down again this morning. This could be the market’s fourth loss in the last five days. We’re told that tensions are easing in Eastern Europe, but the market still seems on edge.
-
Archives
- July 2026
- June 2026
- May 2026
- April 2026
- March 2026
- February 2026
- January 2026
- December 2025
- November 2025
- October 2025
- September 2025
- August 2025
- July 2025
- June 2025
- May 2025
- April 2025
- March 2025
- February 2025
- January 2025
- December 2024
- November 2024
- October 2024
- September 2024
- August 2024
- July 2024
- June 2024
- May 2024
- April 2024
- March 2024
- February 2024
- January 2024
- December 2023
- November 2023
- October 2023
- September 2023
- August 2023
- July 2023
- June 2023
- May 2023
- April 2023
- March 2023
- February 2023
- January 2023
- December 2022
- November 2022
- October 2022
- September 2022
- August 2022
- July 2022
- June 2022
- May 2022
- April 2022
- March 2022
- February 2022
- January 2022
- December 2021
- November 2021
- October 2021
- September 2021
- August 2021
- July 2021
- June 2021
- May 2021
- April 2021
- March 2021
- February 2021
- January 2021
- December 2020
- November 2020
- October 2020
- September 2020
- August 2020
- July 2020
- June 2020
- May 2020
- April 2020
- March 2020
- February 2020
- January 2020
- December 2019
- November 2019
- October 2019
- September 2019
- August 2019
- July 2019
- June 2019
- May 2019
- April 2019
- March 2019
- February 2019
- January 2019
- December 2018
- November 2018
- October 2018
- September 2018
- August 2018
- July 2018
- June 2018
- May 2018
- April 2018
- March 2018
- February 2018
- January 2018
- December 2017
- November 2017
- October 2017
- September 2017
- August 2017
- July 2017
- June 2017
- May 2017
- April 2017
- March 2017
- February 2017
- January 2017
- December 2016
- November 2016
- October 2016
- September 2016
- August 2016
- July 2016
- June 2016
- May 2016
- April 2016
- March 2016
- February 2016
- January 2016
- December 2015
- November 2015
- October 2015
- September 2015
- August 2015
- July 2015
- June 2015
- May 2015
- April 2015
- March 2015
- February 2015
- January 2015
- December 2014
- November 2014
- October 2014
- September 2014
- August 2014
- July 2014
- June 2014
- May 2014
- April 2014
- March 2014
- February 2014
- January 2014
- December 2013
- November 2013
- October 2013
- September 2013
- August 2013
- July 2013
- June 2013
- May 2013
- April 2013
- March 2013
- February 2013
- January 2013
- December 2012
- November 2012
- October 2012
- September 2012
- August 2012
- July 2012
- June 2012
- May 2012
- April 2012
- March 2012
- February 2012
- January 2012
- December 2011
- November 2011
- October 2011
- September 2011
- August 2011
- July 2011
- June 2011
- May 2011
- April 2011
- March 2011
- February 2011
- January 2011
- December 2010
- November 2010
- October 2010
- September 2010
- August 2010
- July 2010
- June 2010
- May 2010
- April 2010
- March 2010
- February 2010
- January 2010
- December 2009
- November 2009
- October 2009
- September 2009
- August 2009
- July 2009
- June 2009
- May 2009
- April 2009
- March 2009
- February 2009
- January 2009
- December 2008
- November 2008
- October 2008
- September 2008
- August 2008
- July 2008
- June 2008
- May 2008
- April 2008
- March 2008
- February 2008
- January 2008
- December 2007
- November 2007
- October 2007
- September 2007
- August 2007
- July 2007
- June 2007
- May 2007
- April 2007
- March 2007
- February 2007
- January 2007
- December 2006
- November 2006
- October 2006
- September 2006
- August 2006
- July 2006
- June 2006
- May 2006
- April 2006
- March 2006
- February 2006
- January 2006
- December 2005
- November 2005
- October 2005
- September 2005
- August 2005
- July 2005
 Eddy Elfenbein is a Washington, DC-based speaker, portfolio manager and editor of the blog Crossing Wall Street. His