-
Implied Markets — House Elections
Posted by Eddy Elfenbein on October 10th, 2010 at 8:39 pmOne of the topics in finance I find most fascinating is implied prices. This is when we take the prices of two or more assets and use them to find an “implied” price for another asset.
For example, that’s what the VIX is all about—implied volatility. In the options pricing model, volatility is one of the variables. So what we can do is take the current market price of an index option and work backward to see what number the market has given to the volatility variable.
I’ve noticed that we can also find some implied prices in futures markets on current events listed at Intrade. (Note: This is not — repeat, not — a political post. It’s about implied markets.)
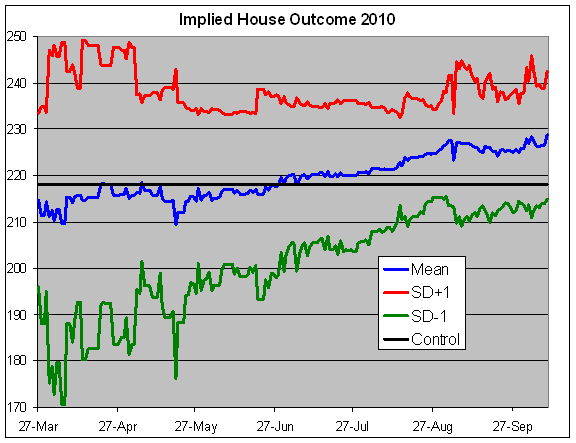
Here’s an example. The current price for the Republicans to win control of Congress is 78.2. That’s a gain of 40 seats. There’s another contract for the Republicans to gain 50 seats. The latest price for that contract is 52.0. (Second note: I don’t take these markets too seriously. I simply see them as entertainment.)
A 78.2% probability translates to +0.779 standard deviations above the mean (that’s NORMSINV in Excel). A 52% probability translates to +0.050 standard deviations above the mean. The difference between those must be 10 seats, so one full implied standard deviation works out to 13.7 seats.
From there we can see that the mean is a gain of 50.7 seats. With the GOP currently holding 178 seats, the market therefore currently expects the GOP to hold 228.7 seats after the election.
I downloaded the historical numbers and here’s what the market’s implied outcome is for the election. The black line is 218 which is a majority. The blue line is the implied mean for the GOP. The red line is one standard deviation above the mean and the green line is one standard deviation below.
-
Remembrance of Stocks Past
Posted by Eddy Elfenbein on October 10th, 2010 at 3:57 pmOne of my rules of investing is: “Never worry about what stocks do after you’ve sold them.” The stocks aren’t thinking of you, so why should you think of them? That’s a wise rule. Nevertheless, I’m ignoring it for the moment.
Each year, I add and delete five stocks to my 20-stock Buy List. As it turns out, the stocks I removed from the Buy List at the beginning of this year have done far better than their replacements.
Here are the five new stocks:
Company Ticker Symbol Price on 31-Dec Price on 8-Oct Profit Gilead GILD $43.27 $36.33 -16.04% Intel INTC $20.40 $19.52 -4.31% Johnson & Johnson JNJ $64.41 $63.23 -1.83% Reynolds American RAI $52.97 $58.73 10.87% Wright Express WXS $31.86 $36.36 14.12% Average 0.56% Here are the five stocks I cut:
Company Ticker Symbol Price on 31-Dec Price on 8-Oct Profit Ampehnol APH $46.18 $49.25 6.65% Cognizant Technology CTSH $45.33 $64.20 41.63% Donaldson DCI $42.54 $47.39 11.40% Danaher DHR $37.60 $41.39 10.08% FactSet Research FDS $65.87 $82.67 25.50% Average 19.05% Even though I limit myself to changing the portfolio by 25% just once per year, even that was too much. If I had made no changes at all, the Buy List would be up 11.59% instead of 6.97%.
OK, I’m going back to enforcing my rule. If anyone needs me, I’ll be pretending CTSH isn’t up 41% YTD.
-
Gold Model — Reader Response
Posted by Eddy Elfenbein on October 9th, 2010 at 4:50 pmHere’s a thoughtful email I received in response to my gold model:
I read your piece on your gold model and thought it was very good – really dead on. I think, however, you have the relationship somewhat backwards on two counts.
First, the dollar derives its value from its relationship to gold. So instead of the dollar price of an ounce of gold, it should be thought of as the gold price of a single dollar. (For instance, the current of gold price of single US dollar is presently about 1/1345th of an ounce of gold)
Second, on this basis, the relationship is somewhat clearer: when the purchasing power of an ounce of gold rises (i.e., when an ounce of gold commands more dollars) interest rates will be low; and, when the purchasing power of a an ounce of gold falls (i.e., when gold commands fewer dollars the interest rate will be high.
In the days of the gold standard, this meant when prices, denominated in gold backed money, fell, interest rates fell – for instance, during periods of depressions. This would also be the period when the purchasing power of gold backed money was at its highest.
When prices, denominated in gold backed money rose, interest rates also rose – for instances during periods of rapid expansion. This would have been the period when the purchasing power of gold backed money was at its lowest.
Under the gold standard, the purchasing power of money fell during expansions, or what is the same thing, prices rose. And, interest rates rose with prices. The purchasing power of money rose during depressions, or what is the same thing, prices fell. And interest rates fell with prices.
So, what you have shown is that the Gibson Paradox continues to work even in the absence of gold backed money. It did not disappear. It expresses itself through national currencies and thus reveal the underlying state of the real economy through this operation.
When the “dollar price” of gold is rising, it is likely that we are in a depression in the real economy. Hence, real interest rates should be at their lowest. And, when the “dollar price” of gold is falling, it is likely we are in a period of expansion. Hence, interest rates should be at their highest.
Both the movement of gold prices and interest rates are determined by the expansion or contraction of the real economy, and by an inverse relation between them. When the real economy is expanding, gold prices will fall and interest rates will be higher. When the real economy is contracting, gold prices will rise, and interest rates will be lower.
What rising gold prices are telling us today, and for the last decade, is that we are in a depression in the real economy – one that has lasted about a decade at present, and shows no signs of ending as yet. Layered over this real economy depression has been two monetary recessions – the first in 2001, and the present one; with, one period of monetary expansion between them.
-
Ella Fitzgerald – Summertime
Posted by Eddy Elfenbein on October 8th, 2010 at 9:02 pm -
Taleb Says Investors Should Sue Nobel for Crisis
Posted by Eddy Elfenbein on October 8th, 2010 at 2:45 pmI’ve long argued that Nassim Nicholas Taleb is a crackpot and that his books are subliterate garbage. I’ve felt like I’ve been in a tiny minority, but slowly, it seems like others are finally catching on.
Nassim Nicholas Taleb, author of “The Black Swan,” said investors who lost money in the financial crisis should sue the Swedish Central Bank for awarding the Nobel Prize to economists whose theories he said brought down the global economy.
“I want to make the Nobel accountable,” Taleb said today in an interview in London. “Citizens should sue if they lost their job or business owing to the breakdown in the financial system.”
Taleb said that the Nobel Prize for Economics has conferred legitimacy on risk models that caused investors’ losses and taxpayer-funded bailouts. Sweden’s central bank will announce the winner of this year’s award on Oct. 11.
Taleb singled out the Nobel award to Harry Markowitz, Merton Miller and William Sharpe in 1990 for their work on portfolio theory and asset-pricing models.
“People are using Sharpe theory that vastly underestimates the risks they’re taking and overexposes them to equities,” Taleb said. “I’m not blaming them for coming up with the idea, but I’m blaming the Nobel for giving them legitimacy. No one would have taken Markowitz seriously without the Nobel stamp.”
Sharpe, a professor of finance, emeritus, at the Graduate School of Business at Stanford University, and Markowitz, a professor of finance at the Rady School of Management at the University of California, San Diego, didn’t return phone calls seeking comment. Miller, who was a professor at the University of Chicago, died in 2000 at the age of 77.
In his 2007 bestseller “The Black Swan: The Impact of the Highly Improbable,” Taleb described how unforeseen events can roil markets. He warned that bankers were relying too much on probability models and disregarding the potential for unexpected catastrophes.
‘I Will’
“If no one else sues them, I will,” said Taleb, who declined to say where or on what basis a lawsuit could be brought. (Well done Bloomberg, well done – Eddy)
The Nobel prizes in physics, chemistry, medicine, peace and literature were established in the will of Alfred Nobel, the Swedish inventor of dynamite who died in 1896. The first awards were handed out 1901. The Swedish Central Bank founded the economics award in 1968 in memory of Nobel. Previous winners of that prize include Milton Friedman, Amartya Sen, Paul Krugman, Robert Merton and Myron Scholes.
A former derivatives trader, Taleb is a professor of risk engineering at New York University and advises Universa Investments LP, a Santa Monica, California-based fund that bets on extreme market moves.
What a peerless buffoon he is.
-
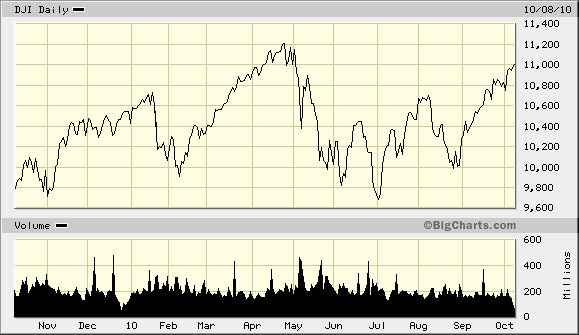
Dow Breaks 11,000
Posted by Eddy Elfenbein on October 8th, 2010 at 12:16 pmThis headline also could have worked on May 3, 1999. At the time, gold was at $285.
-
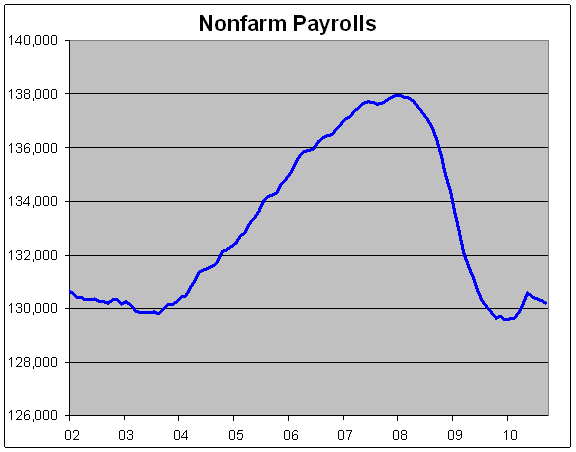
95,000 Jobs Go Bye-Bye Last Month
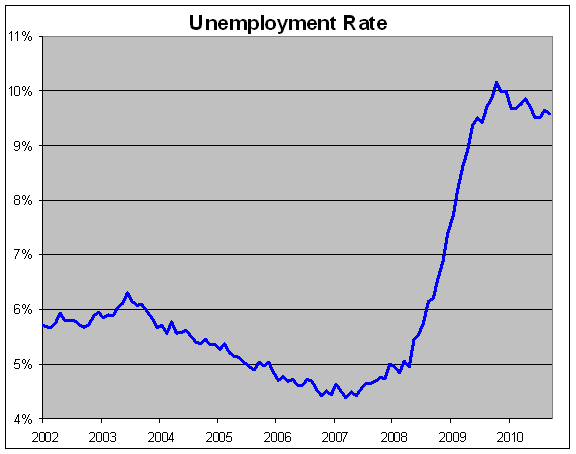
Posted by Eddy Elfenbein on October 8th, 2010 at 10:16 amThe economy lost 95,000 jobs last month. Unemployment held steady at 9.6%. The real jobless rate, however, jumped to 17.1%.
The steep drop was far worse than economists had been predicting. Most estimates expected a loss of only a few thousand jobs.
“September’s U.S. payroll report adds to the evidence that the recovery is losing what little forward momentum it had,” said Paul Ashworth, senior United States economist at Capital Economics.
While total government jobs fell by 159,000, private sector companies added 64,000 jobs last month. The unemployment rate, which measures the percentage of workers who are actively looking for but unable to find jobs, stayed flat at 9.6 percent.
A broader measure of unemployment, which includes people who are working part-time because they cannot find full-time jobs and people who have given up looking for work, rose to 17.1 percent from 16.7 percent in August.
Of the loss in government jobs, 77,000 were temporary Census Bureau employees while 76,000 worked for local governments. State governments lost 7,000 jobs, as well.
Splitting out the decimals, the unemployment rate dropped from from 9.642% to 9.579%.
-
Morning News: October 8, 2010
Posted by Eddy Elfenbein on October 8th, 2010 at 7:47 amPrepper Mania: Retail Behemoth Costco Offers Survival Food Packages
Universal Travel Group: The Auditor Resigns Edition
Told Ya So: The Currency Volume Bubble in Full Bloom
How Speed Traders Are Changing Wall Street
Gold Hits Our $1350 Target; Now What?
Summary of Third Quarter EPS for S&P 500 Stocks by Sectors
Wall Street Futures Mixed Ahead of Jobs Report
UAE Says BlackBerry Dispute Resolved Before Deadline
Technology Replaces Banks as Better Dividend Bet for Investors
Japan’s Cabinet OKs $61 Billion Economic Stimulus
U.S. Companies Buy Back Stock in Droves as they Hold Record Levels of Cash
-
In Tarpum Memoriam
Posted by Eddy Elfenbein on October 8th, 2010 at 12:07 amNow that the spigot phase of TARP has come to an end, Felix Salmon has some wise words. Personally, I have conflicting feelings about TARP. It was an awful thing to do and I hate, hate, hate how it was done, but ultimately…yes…it was necessary and the right thing to do.
Felix writes:
TARP might have arrested the global panic for long enough that Bernanke’s policies had time to start working, but that’s about it.
That’s about it? I think that was TARP’s most important accomplishment—it gave us time. The ballgame changed once people knew there was some sort of backstop even if it was a dysfunctional one.
Let’s take a step back and remember that it wasn’t until 30 years after the Great Depression that Milton Friedman untangled what really happened. Policy makers have to move a lot faster than that. To paraphrase Donald Rumsfeld, you save the banking system with the policy makers you have.
The key yardstick to measure the effectiveness of the TARP program is, in my opinion, the TED spread—and make no mistake, that improved dramatically. Yes, I fully understand that the improved TED spread may have simply correlated with TARP and not have been caused by it. I get that.
The problem is that we don’t have a petri dish to run the economy through 5,000 different scenarios. Perhaps at some point in the distant future, some young economist will put all the pieces together and conclude that TARP was a terrible mistake. Until that happens, I see TARP as being 1 for 1.
I’m surprised at much of the outrage that people have about TARP. Not that it isn’t outrageous, but what the hell did they expect? When the market crashes, why do we expect policy makers to behave more reasonably? Of course they’re going to be craven and inefficient! That’s why they’re policy makers.
Felix blames TARP for “generating a broad-based mistrust of institutions: the government and the financial-services industry certainly, and the judicial system possibly as well.” Well…in my book, that’s a good thing.
The most recent estimate is that TARP will cost the taxpayers $29 billion. Let’s remember that last year, Goldman Sachs (GS) paid taxes of $6.4 billon, plus they kicked in another $2.5 billion so far this year. Should that be included in TARP costs? I don’t know; maybe, maybe not. But I do know that Goldman and many other banks are still in business, employing people and paying taxes. Without TARP, it’s quite possible they wouldn’t be.
In the end, I hope we never, ever have to do another TARP. But I’m pretty sure that my hopes won’t be the deciding factor.
-
When Is the Best Time of Day to Buy Stocks?
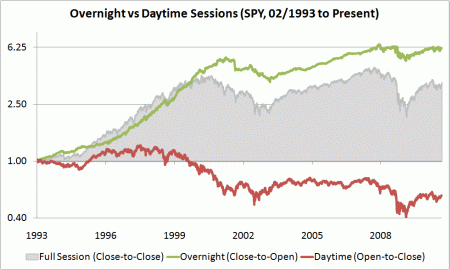
Posted by Eddy Elfenbein on October 7th, 2010 at 4:43 pmHere’s a quick quiz for all investors: What’s the best time of day to buy stocks?
Ha! It’s a trick question, the best time isn’t during the day. Believe it or not, the stock market, in aggregate, has done horribly during the trading day over the past 18 years.
This is one of the most stunning statistics about investing: the market’s entire gain—and then some—has come when the exchange is closed (the difference from the closing bell and the next day’s opening bell).
Obviously the transaction costs of buying and selling each day would eat your shorts, but the moral of the story is clear.
The great MarketSci blog has the deets and this chart:
-
-
Archives
- May 2025
- April 2025
- March 2025
- February 2025
- January 2025
- December 2024
- November 2024
- October 2024
- September 2024
- August 2024
- July 2024
- June 2024
- May 2024
- April 2024
- March 2024
- February 2024
- January 2024
- December 2023
- November 2023
- October 2023
- September 2023
- August 2023
- July 2023
- June 2023
- May 2023
- April 2023
- March 2023
- February 2023
- January 2023
- December 2022
- November 2022
- October 2022
- September 2022
- August 2022
- July 2022
- June 2022
- May 2022
- April 2022
- March 2022
- February 2022
- January 2022
- December 2021
- November 2021
- October 2021
- September 2021
- August 2021
- July 2021
- June 2021
- May 2021
- April 2021
- March 2021
- February 2021
- January 2021
- December 2020
- November 2020
- October 2020
- September 2020
- August 2020
- July 2020
- June 2020
- May 2020
- April 2020
- March 2020
- February 2020
- January 2020
- December 2019
- November 2019
- October 2019
- September 2019
- August 2019
- July 2019
- June 2019
- May 2019
- April 2019
- March 2019
- February 2019
- January 2019
- December 2018
- November 2018
- October 2018
- September 2018
- August 2018
- July 2018
- June 2018
- May 2018
- April 2018
- March 2018
- February 2018
- January 2018
- December 2017
- November 2017
- October 2017
- September 2017
- August 2017
- July 2017
- June 2017
- May 2017
- April 2017
- March 2017
- February 2017
- January 2017
- December 2016
- November 2016
- October 2016
- September 2016
- August 2016
- July 2016
- June 2016
- May 2016
- April 2016
- March 2016
- February 2016
- January 2016
- December 2015
- November 2015
- October 2015
- September 2015
- August 2015
- July 2015
- June 2015
- May 2015
- April 2015
- March 2015
- February 2015
- January 2015
- December 2014
- November 2014
- October 2014
- September 2014
- August 2014
- July 2014
- June 2014
- May 2014
- April 2014
- March 2014
- February 2014
- January 2014
- December 2013
- November 2013
- October 2013
- September 2013
- August 2013
- July 2013
- June 2013
- May 2013
- April 2013
- March 2013
- February 2013
- January 2013
- December 2012
- November 2012
- October 2012
- September 2012
- August 2012
- July 2012
- June 2012
- May 2012
- April 2012
- March 2012
- February 2012
- January 2012
- December 2011
- November 2011
- October 2011
- September 2011
- August 2011
- July 2011
- June 2011
- May 2011
- April 2011
- March 2011
- February 2011
- January 2011
- December 2010
- November 2010
- October 2010
- September 2010
- August 2010
- July 2010
- June 2010
- May 2010
- April 2010
- March 2010
- February 2010
- January 2010
- December 2009
- November 2009
- October 2009
- September 2009
- August 2009
- July 2009
- June 2009
- May 2009
- April 2009
- March 2009
- February 2009
- January 2009
- December 2008
- November 2008
- October 2008
- September 2008
- August 2008
- July 2008
- June 2008
- May 2008
- April 2008
- March 2008
- February 2008
- January 2008
- December 2007
- November 2007
- October 2007
- September 2007
- August 2007
- July 2007
- June 2007
- May 2007
- April 2007
- March 2007
- February 2007
- January 2007
- December 2006
- November 2006
- October 2006
- September 2006
- August 2006
- July 2006
- June 2006
- May 2006
- April 2006
- March 2006
- February 2006
- January 2006
- December 2005
- November 2005
- October 2005
- September 2005
- August 2005
- July 2005
 Eddy Elfenbein is a Washington, DC-based speaker, portfolio manager and editor of the blog Crossing Wall Street. His