-
The 10 Interception Limit
Posted by Eddy Elfenbein on December 28th, 2009 at 7:20 pmWhat is it about 11 interceptions? Since 1981, no defensive back has made it to 11 inceptions in one season even though 11 different players have made it to 10. Another 28 players have made it to nine, including three this year. You can add another 45 players who have made it to eight. Talk about thin tails, this data set seems to have no tail at all.
-
Tiger Woods Destroyed $12 Billion in Market Value
Posted by Eddy Elfenbein on December 28th, 2009 at 2:51 pmIf academics say it, then it must be true:
More difficult to determine, though, is how the scandal would hit his corporate sponsors. So Victor Stango and Christopher Knittel, two economic professors at University of California, Davis, decided to take a stab at quantifyiung the effect–performing what is called an “event study.” To do this, the professors looked at the nine sponsors for which stock price data was available and compared stock returns for those companies for the 13 days after the accident, both to the entire stock market and a group of competitors. The market value of the sponsors fell 2.3%.
The ones hit the hardest? The three sports-related companies–Gatorade (owned by PepsiCo), Nike and Electronic Arts. Those companies experienced a 4.3% decline in stock value. Meanwhile, consulting firm Accenture “experienced no ill effects.”
Overall, the pace of the losses slowed by Dec. 11, the day Woods announced he would take a leave from golf, but as of Dec. 17, shareholders had not recovered their losses, according to the study. -
The Perils of Economic Stats
Posted by Eddy Elfenbein on December 28th, 2009 at 1:25 pmComing on the heels of Robert Shiller’s idea for securities based on national GDP, consider the problem of constant revisions. GDP growth for the third quarter of 1983 has been revised ten times, including once this year.
-
CEO Pay Is Negatively Correlated to Share Performance
Posted by Eddy Elfenbein on December 28th, 2009 at 10:48 amI can’t say this is much of a surprise:
It turns out that the bigger the CEO’s slice of the pie, the lower the company’s future profitability and market valuation. “These CEOs,” says Prof. Bebchuk, “seem to be trying to grab more than they should.”
Finance professor Raghavendra Rau of Purdue University and two colleagues looked at CEO pay and stock returns for roughly 1,500 companies per year from 1994 through 2006. They found that the 10% of firms with the highest-paid CEOs produce stock returns that lag their industry peers by more than 12 percentage points, cumulatively, over the next five years.
Companies at the top of the pay pile, Prof. Rau concluded, award their CEOs an annual average of $23 million—but leave their shareholders poorer (relative to other companies in the same industry) by an average of $2.4 billion per year. Each dollar that goes into the CEO’s pocket takes $100 out of shareholders’ pockets. -
The Decade In One Graph
Posted by Eddy Elfenbein on December 28th, 2009 at 12:24 amHere’s the decade version of the chart I posted last week.
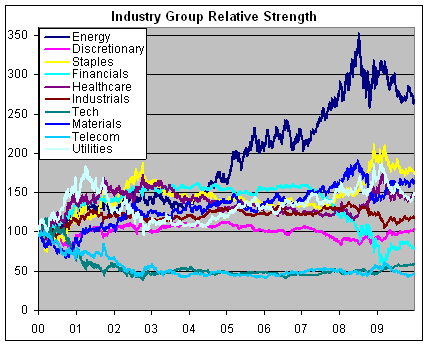
This is the relative strength of ten S&P industry groups set to 100 ten years ago. The big winner has been energy. Interestingly, financials were in the lead until mid-2004. -
Did the Immigration Protests Burst the Housing Bubble?
Posted by Eddy Elfenbein on December 27th, 2009 at 10:47 pmSteve Sailer has often called the recession the “diversity recession” due to the concentration of the subprime mortgage market within minority homeowners. The numbers are hard to come by, but the figures that do exist support much of what Steve has said.
I was curious to see what happened at the peak of the housing market and it seems to have coincided with many of the immigration reform protests in the spring of 2006. The largest events were the mass rallies on April 10 and the Day Without An Immigrant on May 1. There were also many other rallies in March and April (here’s a rundown).
Here’s a look at peak price dates for the 20 different metro areas in the Case-Shiller Index. These are the seasonally adjusted numbers. I also included how much the index is down from the peak price to the most recent data point.
Metro…………………………….Peak…………………………..Decline
Boston…………………………..Nov-05……………………….-15.2%
Cleveland……………………….Jan-06……………………….-15.5%
San Francisco………………….Feb-06……………………….-39.5%
Detroit……………………………Feb-06……………………….-44.0%
San Diego……………………….Mar-06……………………….-39.3%
Denver……………………………Mar-06……………………….-8.5%
Washington…………………….Mar-06……………………….-29.2%
Phoenix………………………….Apr-06………………………..-52.6%
Los Angeles…………………….Apr-06……………………….-39.4%
Minneapolis……………………..Apr-06……………………….-29.2%
Las Vegas……………………….Apr-06……………………….-56.1%
Tampa…………………………….May-06……………………….-40.8%
New York…………………………May-06……………………….-19.5%
Miami………………………………Dec-06……………………….-46.6%
Chicago…………………………..Feb-07……………………….-22.8%
Atlanta…………………………….Apr-07……………………….-19.0%
Dallas………………………………Apr-07……………………….-5.3%
Portland…………………………..May-07……………………….-20.2%
Seattle…………………………….May-07……………………….-22.8%
Charlotte………………………….Aug-07……………………….-11.5%
Eleven of the 20 markets peaked between February and May 2006. I’m not saying that the immigration protests caused the housing bubble. That was forming for a long time. The bursting of the bubble’s was long overdue and perhaps the dislocation in the housing sector brought on by the protests impacted the markets. Then, once the slide started, it couldn’t be stopped.
This evidence is very circumstantial but I think the hypothesis has merit. As they say, more research is needed. -
Sunday Links
Posted by Eddy Elfenbein on December 27th, 2009 at 5:54 pmHere are a few items I’m reading.
William Voegeli on the disaster that is California
Phil Birnbaum on the performance of pitchers.
Dave Barry’s brilliant take on the year 2009.
James Altucher comes out against homeownership.
Kid Dynamite on mean-reversion and momentum investing.
Finally, here’s the 2010 Bespoke Roundtable which I participated in. -
The Trill Is Gone
Posted by Eddy Elfenbein on December 26th, 2009 at 11:40 pmProfessor Robert Shiller floats the idea of national governments using equity financing. The idea would be to issue equity shares called trills, a one-trillionth equity stake in a national economy, that pay quarterly dividends that are tied to the gross national product.
Equity, however, is quite different from debt in that equity represents a legal claim on real assets. Debt is simply renting capital. When the renting is done, so is the cash flow. But equity is forever and with it comes a having a say in how the enterprise is run. So would trill holders get to vote in how the country is run?
I’m not so sure if that’s constitutional (but I could be persuaded that we need a new electorate). Or possibly these would represent a form of non-voting shares. Could the Iranians buy them on the open market? Shiller doesn’t say. Bear in mind that we would never let China buy, say, one of our major aerospace companies.
Shiller thinks that one trill could go for around $1,400 which would represent a yield of 1% based on its $14 dividend. This is, of course, completely insane. It would value the entire United States at $1.4 quadrillion. That comes to about $4.7 million for every person in the United States, including children.
How does that stack up against other studies? In the book, From Poverty to Prosperity, authors Arnold Kling and Nick Schultz include a chart on page 38 which lists per-capita wealth of different countries. For 2006, the U.S. is listed at $512,612 (the data is from the World Bank).
Shiller writes:The Standard & Poor’s 500-stock index now has a dividend yield of 2.3 percent. The dividend yield on trills might be much lower, reflecting the substantially higher long-term growth rate of G.D.P. relative to S.& P. dividends — in real terms, 3.1 percent versus 1.1 percent a year, respectively, since 1957.
Shiller makes a few mistakes here. First, dividends are paid out of earnings. They’re not the whole thing. GDP is basically equivalent to national earnings. In other words, he’s saying that America’s P/E ratio could be around 100.
Secondly, there’s no economic reason why dividends need to continue to grow slower than GDP. That’s simply a preference of corporation’s payout ratio, which is often tied to tax policy. It all comes out of the same source. Corporate profits usually make about 10% of GDP. It fluctuates +/-2% or so but 10% seems to be the mean.
Plus, Shiller’s numbers are misleading. Dividends are unusually low right now thanks to the TARP restrictions and the recession. Looking at Shiller’s website we can see that real dividends grew by 2.23% annualized from 1945 to 2007 which encompasses a drop in payout ratios from about 80% to 40%.
The trill idea is basically to have a payout ratio of 100%, but simply calling this a dividend doesn’t mean it will be valued like a dividend. If the cash flow necessary for dividends grew by just 1.1%, then the dividend yield would be much higher than the S&P 500 not lower. Shiller gets it backward.
Finally, even if these trills were possible, they’re a terribly idea. The struggle in corporate financing is between equity and debt. The game isn’t hard to understand. You issue debt when yields are low and you sell stock when shares prices are high. It’s that simple. The U.S. benefits enormously by being the reserve currency of the world. Short-term yields are microscopic.
Put it this way: If you lend Uncle Sam $100 right now, at the current rates, you’ll make a profit of one penny in three months’ time. That’s a great deal for us. Once people stop lending us money, then we can sell off the Liberty Bell. Until then, we have no use for trills.
David Merkel and Robert Wenzel have more. -
The Talented Mr. Buffett
Posted by Eddy Elfenbein on December 26th, 2009 at 8:08 pmFelix Salmon highlights Warren Buffett’s ability to be the good guy even when his companies’ practices are rather ruthless. Berkshire Hathaway has eliminated 21,000 jobs and it won’t impact Buffett’s nice guy image one bit. Felix quotes Alice Schroeder that Buffett is good at hiring bad cops to do the dirty work and protect him from any blowback.
It’s hard to imagine but Buffett wasn’t always seen as the good guy. In the 1970s, before they were well known, Buffett and Munger bought the Buffalo Evening News. The Buffalo Courier-Express, a rival newspaper, did everything they could to make them seem like an evil out-of-town heartless capitalists. Buffett was beat up hard in the press and I think that episode has stayed with him ever since. -
2009 In One Graph
Posted by Eddy Elfenbein on December 26th, 2009 at 1:29 pmI apologize for the crowdedness of this chart, but it shows the relative strength of the ten S&P 500 industry groups for this year.
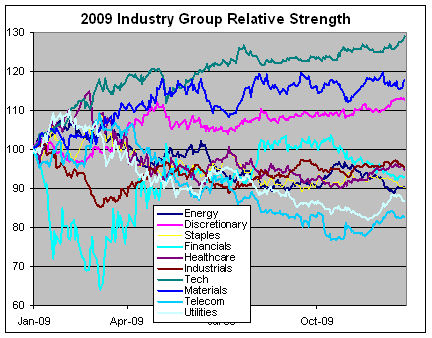
Here are a few items I noticed. I’m surprised to see the continued strength of tech stocks this year. The trend hasn’t let up. Financial stocks had a huge turnaround since the March bottom, but peaked in mid-October and have been trending lowering ever since. I’m surprised how weak utility stocks have been this year.
- Load More
Paul Skenes has had 15 starts this year. By my (rough) judgement, he's had 13 good starts and 2 bad ones, but he's W-L record of 4-6. It really is a lousy stat.
Russia ‘using stolen Ukrainian children to rebuild for future wars’
-
-
Archives
- June 2025
- May 2025
- April 2025
- March 2025
- February 2025
- January 2025
- December 2024
- November 2024
- October 2024
- September 2024
- August 2024
- July 2024
- June 2024
- May 2024
- April 2024
- March 2024
- February 2024
- January 2024
- December 2023
- November 2023
- October 2023
- September 2023
- August 2023
- July 2023
- June 2023
- May 2023
- April 2023
- March 2023
- February 2023
- January 2023
- December 2022
- November 2022
- October 2022
- September 2022
- August 2022
- July 2022
- June 2022
- May 2022
- April 2022
- March 2022
- February 2022
- January 2022
- December 2021
- November 2021
- October 2021
- September 2021
- August 2021
- July 2021
- June 2021
- May 2021
- April 2021
- March 2021
- February 2021
- January 2021
- December 2020
- November 2020
- October 2020
- September 2020
- August 2020
- July 2020
- June 2020
- May 2020
- April 2020
- March 2020
- February 2020
- January 2020
- December 2019
- November 2019
- October 2019
- September 2019
- August 2019
- July 2019
- June 2019
- May 2019
- April 2019
- March 2019
- February 2019
- January 2019
- December 2018
- November 2018
- October 2018
- September 2018
- August 2018
- July 2018
- June 2018
- May 2018
- April 2018
- March 2018
- February 2018
- January 2018
- December 2017
- November 2017
- October 2017
- September 2017
- August 2017
- July 2017
- June 2017
- May 2017
- April 2017
- March 2017
- February 2017
- January 2017
- December 2016
- November 2016
- October 2016
- September 2016
- August 2016
- July 2016
- June 2016
- May 2016
- April 2016
- March 2016
- February 2016
- January 2016
- December 2015
- November 2015
- October 2015
- September 2015
- August 2015
- July 2015
- June 2015
- May 2015
- April 2015
- March 2015
- February 2015
- January 2015
- December 2014
- November 2014
- October 2014
- September 2014
- August 2014
- July 2014
- June 2014
- May 2014
- April 2014
- March 2014
- February 2014
- January 2014
- December 2013
- November 2013
- October 2013
- September 2013
- August 2013
- July 2013
- June 2013
- May 2013
- April 2013
- March 2013
- February 2013
- January 2013
- December 2012
- November 2012
- October 2012
- September 2012
- August 2012
- July 2012
- June 2012
- May 2012
- April 2012
- March 2012
- February 2012
- January 2012
- December 2011
- November 2011
- October 2011
- September 2011
- August 2011
- July 2011
- June 2011
- May 2011
- April 2011
- March 2011
- February 2011
- January 2011
- December 2010
- November 2010
- October 2010
- September 2010
- August 2010
- July 2010
- June 2010
- May 2010
- April 2010
- March 2010
- February 2010
- January 2010
- December 2009
- November 2009
- October 2009
- September 2009
- August 2009
- July 2009
- June 2009
- May 2009
- April 2009
- March 2009
- February 2009
- January 2009
- December 2008
- November 2008
- October 2008
- September 2008
- August 2008
- July 2008
- June 2008
- May 2008
- April 2008
- March 2008
- February 2008
- January 2008
- December 2007
- November 2007
- October 2007
- September 2007
- August 2007
- July 2007
- June 2007
- May 2007
- April 2007
- March 2007
- February 2007
- January 2007
- December 2006
- November 2006
- October 2006
- September 2006
- August 2006
- July 2006
- June 2006
- May 2006
- April 2006
- March 2006
- February 2006
- January 2006
- December 2005
- November 2005
- October 2005
- September 2005
- August 2005
- July 2005
 Eddy Elfenbein is a Washington, DC-based speaker, portfolio manager and editor of the blog Crossing Wall Street. His