-
Tepper’s Hedge Fund Scores $7 Billion Year
Posted by Eddy Elfenbein on December 21st, 2009 at 10:53 amEver heard of David Tepper? His hedge fund made $7 billion this year, of which Mr. Tepper will keep about $2.5 billion for himself. The funds secret was to beat against American falling into a second Great Depression.
Through February and March, Mr. Tepper scooped up beaten-down bank shares as many investors were running for the exits. Day after day, Mr. Tepper bought Bank of America Corp. shares, then trading below $3, and Citigroup Inc. preferred shares, when that stock was under $1. One of his investors insisted more carnage loomed. Friends who shared his bullish beliefs were wary of aping his moves amid speculation that the government was about to nationalize the big banks.
“I felt like I was alone,” Mr. Tepper recalls. On some days, he says, “no one was even bidding.”
The bets paid off. A resurgent market has helped Mr. Tepper’s firm, Appaloosa Management, gain about 120% after the firm’s fees, through early December. Thanks to those gains, Mr. Tepper, who specializes in the stocks and bonds of troubled companies, manages about $12 billion, a sum that makes Appaloosa one of the largest hedge funds in the world. -
The Short-Selling Conspiracy
Posted by Eddy Elfenbein on December 21st, 2009 at 9:57 amI’m honored to be named a Sith Lord — a member of the short-selling conspiracy.
If anyone needs me, I’ll be meeting with the Rothschilds by the grassy knoll. -
Worst Decade Ever
Posted by Eddy Elfenbein on December 21st, 2009 at 9:40 amThe Wall Street Journal tallies up how bad this decade has been:
With two weeks to go in 2009, the declines since the end of 1999 make the last 10 years the worst calendar decade for stocks going back to the 1820s, when reliable stock market records begin, according to data compiled by Yale University finance professor William Goetzmann. He estimates it would take a 3.6% rise between now and year end for the decade to come in better than the 0.2% decline suffered by stocks during the Depression years of the 1930s.
The past decade also well underperformed other decades with major financial panics, such as in 1907 and 1893.
“The last 10 years have been a nightmare, really poor,” for U.S. stocks, said Michele Gambera, chief economist at Ibbotson Associates.
While the overall market trend has been a steady march upward, the last decade is a reminder that stocks can decline over long periods of time, he said.
“It’s not frequent, but it can happen,” Mr. Gambera said.
To some degree these statistics are a quirk of the calendar, based on when the 10-year period starts and finishes. The 10-year periods ending in 1937 and 1938 were worse than the most recent calendar decade because they capture the full effect of stocks hitting their peak in 1929 and the October crash of that year.
From 2000 through November 2009, investors would have been far better off owning bonds, which posted gains ranging from 5.6% to more than 8% depending on the sector, according to Ibbotson. Gold was the best-performing asset, up 15% a year this decade after losing 3% each year during the 1990s.
This past decade looks even worse when the impact of inflation is considered.
Since the end of 1999, the Standard & Poor’s 500-stock index has lost an average of 3.3% a year on an inflation-adjusted basis, compared with a 1.8% average annual gain during the 1930s when deflation afflicted the economy, according to data compiled by Charles Jones, finance professor at North Carolina State University. His data use dividend estimates for 2009 and the consumer price index for the 12 months through November.
Even the 1970s, when a bear market was coupled with inflation, wasn’t as bad as the most recent period. The S&P 500 lost 1.4% after inflation during that decade.
That is especially disappointing news for investors, considering that a key goal of investing in stocks is to increase money faster than inflation.
“This decade is the big loser,” said Mr. Jones.Here’s a cool graphic.
-
The 2010 Buy List
Posted by Eddy Elfenbein on December 17th, 2009 at 7:41 pmHere’s the Crossing Wall Street Buy List for 2010:
AFLAC (AFL)
Baxter International (BAX)
Becton, Dickinson (BDX)
Bed Bath & Beyond (BBBY)
Eaton Vance (EV)
Eli Lilly (LLY)
Fiserv (FISV)
Gilead Sciences (GILD)
Intel (INTC)
Johnson & Johnson (JNJ)
Jos. A Bank Clothiers (JOSB)
Leucadia National (LUK)
Medtronic (MDT)
Moog (MOG-A)
Nicholas Financial (NICK)
Reynolds American (RAI)
SEI Investments (SEIC)
Stryker (SYK)
Sysco (SYY)
Wright Express (WXS)
The list is now locked in and I can’t make any changes for the next 12 month. I’ll start tracking the new list on Monday, January 4, 2010. As in previous years, I assume the Buy List to be a $1 million portfolio that’s equally divided among the 20 stocks going by the closing price of December 31, 2009.
Also as in previous years, I’ve only changed five stocks to the Buy List.
The five stocks I’m taking out are Amphenol (APH), Cognizant Technology Solutions (CTSH), Donaldson (DCI), Danaher (DHR) and FactSet Research Systems (FDS).
The five new stocks are Gilead Sciences (GILD), Intel (INTC), Johnson & Johnson (JNJ), Reynolds American (RAI) and Wright Express (WXS). -
Bernanke Passes Senate Banking Committee
Posted by Eddy Elfenbein on December 17th, 2009 at 11:23 amThe vote was 16 to 7.
-
Danaher Guides Higher
Posted by Eddy Elfenbein on December 16th, 2009 at 11:30 pmSome good news from Danaher (DHR). The company is raising its Q4 guidance to a range of 99 cents to $1.09 a share. The Street was at 97 cents a share (and had been rising). Still, Danaher has had a rough year. It looks like EPS will be down about 17% or so from last year.
-
The Best Time of Year for Stocks
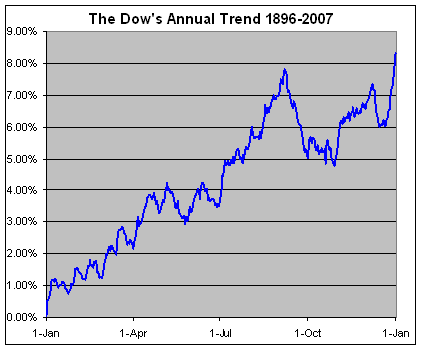
Posted by Eddy Elfenbein on December 16th, 2009 at 3:39 pmWe’re soon coming up on the famous Santa Claus rally. I crunch all the numbers for the Dow from 1896 through 2007. Historically, the best stretch for the market has come between December 21 and January 7. Of the 15 best days of the year for the market, six are in this period.
Over 111 years, the Dow has gained an average of 3.39% during that 17-day period. To put that in some perspective, the Dow’s annual gain is 8.32%. This means that more than 40% of the Dow’s yearly gain has come during this brief stretch which is less than 1/20 of the entire year.
-
The Dump Bernanke Bandwagon
Posted by Eddy Elfenbein on December 16th, 2009 at 3:25 pmThere are now three senators who say they will vote “nay” on Time’s Person of the Year: Jeff Merkley, John McCain and Bernie Sanders. More may be coming.
-
Bernanke Named Time’s Person of the Year
Posted by Eddy Elfenbein on December 16th, 2009 at 9:50 amWake up, sheeple.

This will drive the conspiracy folks nuts. Or rather, even nuttier. -
FactSet Drops on Earnings
Posted by Eddy Elfenbein on December 15th, 2009 at 10:51 amShares of FactSet (FDS) are down sharply today after posting earnings that were in line with expectations, which makes you wonder what the expectations really were. For their fiscal first quarter, FactSet made 74 cents a share and revenues were down a trivial amount. For the second quarter, which ends in January, the company sees EPS ranging between 73 and 75 cents a share. That’s a narrow range. The Street was at 75 cents a share.
The stock is currently down about 7.6% today. I can’t say I’m complaining since the stock has traveled almost consistently upward all year.
- Load More
I want to remind everyone that investing isn't about making money. It's about making friends and having a good time.
Good run:
“Common Sense,” by Thomas Paine (published January 10, 1776)
“The Decline and Fall of the Roman Empire” (Vol. 1), by Edward Gibbon (February 17, 1776)
“An Inquiry into The Wealth of Nations,” by Adam Smith (March 9, 1776)
“The Declaration of Independence,” by… -
-
Archives
- June 2025
- May 2025
- April 2025
- March 2025
- February 2025
- January 2025
- December 2024
- November 2024
- October 2024
- September 2024
- August 2024
- July 2024
- June 2024
- May 2024
- April 2024
- March 2024
- February 2024
- January 2024
- December 2023
- November 2023
- October 2023
- September 2023
- August 2023
- July 2023
- June 2023
- May 2023
- April 2023
- March 2023
- February 2023
- January 2023
- December 2022
- November 2022
- October 2022
- September 2022
- August 2022
- July 2022
- June 2022
- May 2022
- April 2022
- March 2022
- February 2022
- January 2022
- December 2021
- November 2021
- October 2021
- September 2021
- August 2021
- July 2021
- June 2021
- May 2021
- April 2021
- March 2021
- February 2021
- January 2021
- December 2020
- November 2020
- October 2020
- September 2020
- August 2020
- July 2020
- June 2020
- May 2020
- April 2020
- March 2020
- February 2020
- January 2020
- December 2019
- November 2019
- October 2019
- September 2019
- August 2019
- July 2019
- June 2019
- May 2019
- April 2019
- March 2019
- February 2019
- January 2019
- December 2018
- November 2018
- October 2018
- September 2018
- August 2018
- July 2018
- June 2018
- May 2018
- April 2018
- March 2018
- February 2018
- January 2018
- December 2017
- November 2017
- October 2017
- September 2017
- August 2017
- July 2017
- June 2017
- May 2017
- April 2017
- March 2017
- February 2017
- January 2017
- December 2016
- November 2016
- October 2016
- September 2016
- August 2016
- July 2016
- June 2016
- May 2016
- April 2016
- March 2016
- February 2016
- January 2016
- December 2015
- November 2015
- October 2015
- September 2015
- August 2015
- July 2015
- June 2015
- May 2015
- April 2015
- March 2015
- February 2015
- January 2015
- December 2014
- November 2014
- October 2014
- September 2014
- August 2014
- July 2014
- June 2014
- May 2014
- April 2014
- March 2014
- February 2014
- January 2014
- December 2013
- November 2013
- October 2013
- September 2013
- August 2013
- July 2013
- June 2013
- May 2013
- April 2013
- March 2013
- February 2013
- January 2013
- December 2012
- November 2012
- October 2012
- September 2012
- August 2012
- July 2012
- June 2012
- May 2012
- April 2012
- March 2012
- February 2012
- January 2012
- December 2011
- November 2011
- October 2011
- September 2011
- August 2011
- July 2011
- June 2011
- May 2011
- April 2011
- March 2011
- February 2011
- January 2011
- December 2010
- November 2010
- October 2010
- September 2010
- August 2010
- July 2010
- June 2010
- May 2010
- April 2010
- March 2010
- February 2010
- January 2010
- December 2009
- November 2009
- October 2009
- September 2009
- August 2009
- July 2009
- June 2009
- May 2009
- April 2009
- March 2009
- February 2009
- January 2009
- December 2008
- November 2008
- October 2008
- September 2008
- August 2008
- July 2008
- June 2008
- May 2008
- April 2008
- March 2008
- February 2008
- January 2008
- December 2007
- November 2007
- October 2007
- September 2007
- August 2007
- July 2007
- June 2007
- May 2007
- April 2007
- March 2007
- February 2007
- January 2007
- December 2006
- November 2006
- October 2006
- September 2006
- August 2006
- July 2006
- June 2006
- May 2006
- April 2006
- March 2006
- February 2006
- January 2006
- December 2005
- November 2005
- October 2005
- September 2005
- August 2005
- July 2005
 Eddy Elfenbein is a Washington, DC-based speaker, portfolio manager and editor of the blog Crossing Wall Street. His