-
The S&P 500 Breaks 1,000!
Posted by Eddy Elfenbein on August 3rd, 2009 at 10:34 amFor the first time since November 5 — the day after the election — the S&P 500 is over 1,000.
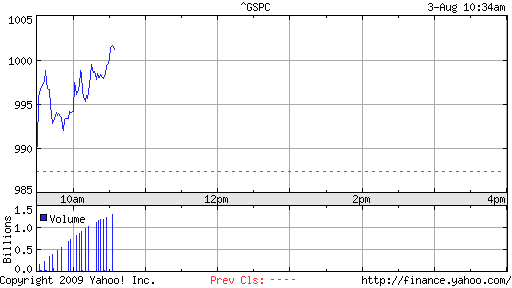
Also, Nicholas Financial (NICK) has been as high as $7.49 a share, which gives us a triple for the year. -
Oil and Stocks Are Matching Up
Posted by Eddy Elfenbein on August 3rd, 2009 at 10:03 amFrom Reuters:
Crude oil has this year shown the most marked correlation to equities in decades and at the same time displayed a negative correlation to the dollar.
U.S. crude has shown a daily correlation of 0.88 with the MSCI world equity index .MIWD00000PUS since March 9, when the index touched its lowest since 2003.
“It depends how you measure it, but we are currently witnessing one of the strongest sympathetic periods in four decades, particularly with regards to the correlation between oil and the stock market,” said Francisco Blanch of Banc of America Securities-Merrill Lynch.Here’s a look at the S&P 500 and the Oil ETF since the beginning of the year:
-
Vermont taxi service allows patrons to decide fares
Posted by Eddy Elfenbein on August 3rd, 2009 at 9:53 amFrom AP:
When Eric Hagen started Recession Ride Taxi in Essex, Vt., he took more questions than fares.
Everyone wanted to know if the sign reading “Pay What You Want!” on the back of his taxi was for real. It is, and Hagen says he hasn’t been shortchanged yet.
He offers pay-what-you-can bottles of water, Gatorade and soda and a free ride after six paid fares. He tells the Burlington Free Press that business has been good.
Most of his transactions are in cash. But he’s also gotten a CD from a musician and a $10 supermarket card.
Hagen has been offering his taxi service Thursday through Sunday nights since June. When he’s not a taxi driver, the 46-year-old Hagen works full time for the American Red Cross. -
Gasparino Vs. Taibbi
Posted by Eddy Elfenbein on August 3rd, 2009 at 9:21 amI’m glad to see that Matt Taibbi’s famous article on Goldman Sachs (GS) is losing credibility. Charlie Gasparino is the latest to criticize it.
That storyline isn’t just wrong, it’s pretty naïve. But it’s gaining credibility following Taibbi’s Rolling Stone piece, first in the blogosphere and now with a growing number of what is commonly referred to as the mainstream media. It’s one thing to watch half-literate bloggers in desperate need of attention jump on the Goldman is the root of all evil story; it’s quite another to see respected news organizations with experienced reporters and presumably more experienced editors do it and in the process obscure the fact that Goldman, for all of its sins during the bubble years, was probably the least culpable for the system’s eventual collapse. And maybe more importantly, that Goldman and all the other banks are now overtly protected by the federal government and can still roll the dice and take risk only this time under the explicit protection of the American taxpayer.
All of which brings me back to Taibbi, who is usually a really good reporter, and a provocative storyteller. In addition to his Rolling Stone piece on Goldman, I watched his performance on WNYC. What’s interesting to me is (particularly after the WNYC appearance) is how much of what Taibbi is stating as fact or suggesting is probably true, is actually wrong.As they say, read the whole thing.
-
Guess What Investment Class Is Up 10-Fold in the Past Five Years?
Posted by Eddy Elfenbein on August 3rd, 2009 at 9:04 amWhen actor Nicholas Cage auctioned a rare Dracula poster in April, Ralph DeLuca knew he would outbid whomever dared raise their auction paddles against him in an effort to capture a piece of movie history.
The 1931 poster, one of only three remaining from the movie’s original run, sold for a stunning $310,700 (U.S.). Mr. DeLuca, who lives in New Jersey, insists that he landed himself a dependable investment.
“I got out of investment banking a couple of years ago and started investing in posters,” he says. “The prices keep going up for the really rare things, and I’d rather put my money in something tangible than in stocks.”
Mr. Cage likely agrees – he bought the poster 10 years ago for $77,000. His 303-per-cent gain easily outpaced the minus-10-per-cent total return he would have earned on the S&P 500 over the same time period. British insurance broker Stackhouse Poland said posters have multiplied in value by up to 10 times over the past five years. -
More U.S. Banks Put on Probation
Posted by Eddy Elfenbein on July 31st, 2009 at 12:21 pmU.S. federal regulators have raised the number of struggling banks which they have essentially put on probation, forcing them to fix their problems to avoid potential failures, the Wall Street Journal said.
Citing data obtained under the Freedom of Information Act requests, the paper said The Office of the Comptroller of the Currency (OCC), along with the Federal Reserve, have issued more memorandums of understanding so far this year than in all of 2008.
At the current rate of at least 285, the Fed, OCC and Federal Deposit Insurance Corp are in line to issue nearly 600 of these secret agreements this year, the paper said, compared with last year when 399 such agreements were issued.So that’s secret probation, but what about double-secret probation?
-
The Government Revises GDP Growth for the last 70 Years
Posted by Eddy Elfenbein on July 31st, 2009 at 11:16 amCongratulations, we all just got wealthier today! Or I should say that according to the government, we got wealthier—not only today, but in the past as well.
The Commerce Department released its second-quarter GDP report this report and along with it, they revised ALL the GDP numbers going back to 1929.Today, BEA is releasing revised statistics of gross domestic product (GDP) and other national income and product accounts (NIPAs) series from 1929 through the first quarter of 2009. Comprehensive revisions, which are carried out about every 5 years, are an important part of BEA’s regular process for improving and modernizing its accounts to keep pace with the ever-changing U.S. economy.
Paging Mr. Orwell, to the yellow courtesy phone.
These weren’t small changes either. Here’s a look at the old and new quarterly series which begins in 1947 (in trillions of dollars chained at 2000 prices):
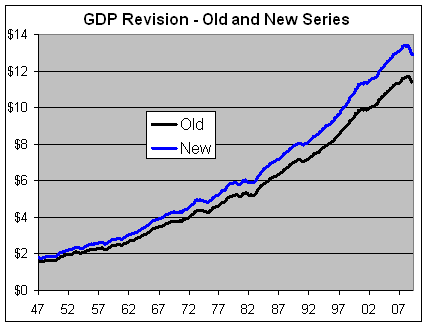
Be sure to tell your grandparents that things weren’t as rough as we thought back in the day. Here’s a look at the percentage difference between the old and new series:

Here are the recent old and new quarterly growth numbers. There are some significant changes. For example, the fourth quarter of 2007 was -0.17%, now it’s positive 2.12%. According to NBER, the recession began in December 2007.

The first quarter of 2008 used to be positive 0.87%, now it’s -0.73%. Growth for the second quarter of 2008 was nearly cut in half. The contraction for the third quarter of 2008 was more than five times worse than originally thought!
Going back a few years, the third quarter of 2000 was originally -0.46% but now it’s positive 0.33% (that’s a Clinton quarter not a Bush quarter for all you political folks). This is important because journalists often refer to a recession as back-to-back quarters of negative economic growth. It’s technically not, although a NBER recession usually corresponds with back-to-back quarters of negative growth. Well, in 2000, it never happened. According to the old series, we had negative growth in three of five quarters. Now it was just two out of three quarters.
If anyone needs me, I’ll be in East Germany updating some crop reports. -
Because Financial New Isn’t Creepy Enough, We Have Fox Business News
Posted by Eddy Elfenbein on July 30th, 2009 at 11:34 pm -
Nasdaq-to-S&P 500 Ratio
Posted by Eddy Elfenbein on July 30th, 2009 at 4:10 pmThe Nasdaq has been on fire lately. The ratio of the Nasdaq to the S&P 500 is currently hovering right around 2.0. Two weeks ago, the ratio crossed above 2.0 for the first time since early 2001.
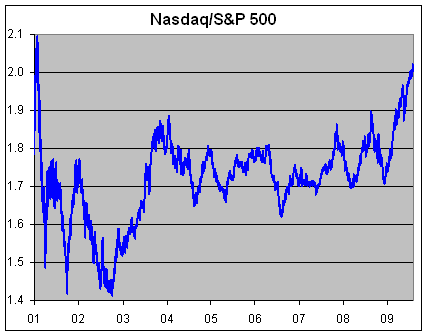
Don’t worry that we’re headed back to the Nasdaq bubble days just yet. We still have a long way to go to match the earlier peak.
Consider these numbers: On March 10, 2000, the ratio hit 3.62. To match that today, either the Nasdaq would have be around 3570, or the S&P 500 would have to be at 548 — a 44% drop from here.
In other words, what the hell were people thinking in 2000? -
Dow Flashes Buy Signal
Posted by Eddy Elfenbein on July 30th, 2009 at 11:30 amThe Dow has gone from 10% below its 200-day moving average to 10% above it. That’s happened 21 times since 1921 and it’s been good for stocks 18 times. The average gain over the next year has been 18%.
- Load More
Does anyone have a suit of armor, jet skis and a blowtorch I can borrow/rent? There's an experiment I'm working on.
This is pretty amazing. US elections combined since 1924:
GOP: 1,058,301,749
DEM: 1,057,846,951
Oth: 88,548,252Unemployment spikes in Washington, DC
-
-
Archives
- May 2025
- April 2025
- March 2025
- February 2025
- January 2025
- December 2024
- November 2024
- October 2024
- September 2024
- August 2024
- July 2024
- June 2024
- May 2024
- April 2024
- March 2024
- February 2024
- January 2024
- December 2023
- November 2023
- October 2023
- September 2023
- August 2023
- July 2023
- June 2023
- May 2023
- April 2023
- March 2023
- February 2023
- January 2023
- December 2022
- November 2022
- October 2022
- September 2022
- August 2022
- July 2022
- June 2022
- May 2022
- April 2022
- March 2022
- February 2022
- January 2022
- December 2021
- November 2021
- October 2021
- September 2021
- August 2021
- July 2021
- June 2021
- May 2021
- April 2021
- March 2021
- February 2021
- January 2021
- December 2020
- November 2020
- October 2020
- September 2020
- August 2020
- July 2020
- June 2020
- May 2020
- April 2020
- March 2020
- February 2020
- January 2020
- December 2019
- November 2019
- October 2019
- September 2019
- August 2019
- July 2019
- June 2019
- May 2019
- April 2019
- March 2019
- February 2019
- January 2019
- December 2018
- November 2018
- October 2018
- September 2018
- August 2018
- July 2018
- June 2018
- May 2018
- April 2018
- March 2018
- February 2018
- January 2018
- December 2017
- November 2017
- October 2017
- September 2017
- August 2017
- July 2017
- June 2017
- May 2017
- April 2017
- March 2017
- February 2017
- January 2017
- December 2016
- November 2016
- October 2016
- September 2016
- August 2016
- July 2016
- June 2016
- May 2016
- April 2016
- March 2016
- February 2016
- January 2016
- December 2015
- November 2015
- October 2015
- September 2015
- August 2015
- July 2015
- June 2015
- May 2015
- April 2015
- March 2015
- February 2015
- January 2015
- December 2014
- November 2014
- October 2014
- September 2014
- August 2014
- July 2014
- June 2014
- May 2014
- April 2014
- March 2014
- February 2014
- January 2014
- December 2013
- November 2013
- October 2013
- September 2013
- August 2013
- July 2013
- June 2013
- May 2013
- April 2013
- March 2013
- February 2013
- January 2013
- December 2012
- November 2012
- October 2012
- September 2012
- August 2012
- July 2012
- June 2012
- May 2012
- April 2012
- March 2012
- February 2012
- January 2012
- December 2011
- November 2011
- October 2011
- September 2011
- August 2011
- July 2011
- June 2011
- May 2011
- April 2011
- March 2011
- February 2011
- January 2011
- December 2010
- November 2010
- October 2010
- September 2010
- August 2010
- July 2010
- June 2010
- May 2010
- April 2010
- March 2010
- February 2010
- January 2010
- December 2009
- November 2009
- October 2009
- September 2009
- August 2009
- July 2009
- June 2009
- May 2009
- April 2009
- March 2009
- February 2009
- January 2009
- December 2008
- November 2008
- October 2008
- September 2008
- August 2008
- July 2008
- June 2008
- May 2008
- April 2008
- March 2008
- February 2008
- January 2008
- December 2007
- November 2007
- October 2007
- September 2007
- August 2007
- July 2007
- June 2007
- May 2007
- April 2007
- March 2007
- February 2007
- January 2007
- December 2006
- November 2006
- October 2006
- September 2006
- August 2006
- July 2006
- June 2006
- May 2006
- April 2006
- March 2006
- February 2006
- January 2006
- December 2005
- November 2005
- October 2005
- September 2005
- August 2005
- July 2005
 Eddy Elfenbein is a Washington, DC-based speaker, portfolio manager and editor of the blog Crossing Wall Street. His