-
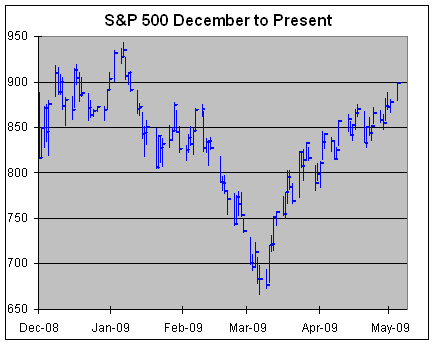
S&P Nears 2009 High
Posted by Eddy Elfenbein on May 4th, 2009 at 1:48 pmThe S&P 500 got up to 899.01 today which is the highest its been since early January.
-
The Boston Globe May Be No More
Posted by Eddy Elfenbein on May 4th, 2009 at 1:15 pmI was a rookie broker in Boston and I loved that Boston was an authentic two-paper town. Whenever you got on the T you could easily find a Boston Herald but it was much harder to find a Boston Globe. The Herald was far more populist and conservative, while the Globe was a bastion of liberalism. It’s hard to imagine that the Glove may soon go away.
The paper’s circulation dropped 14 percent in the most recent six-month period. The Globe is expected to lose $85 million this year, the company says.
Boston residents have long resented the takeover of the Globe by a company based in New York, with which the region competes in sports, banking and cultural bragging rights.
The notion that Boston, home to some of the country’s top universities, could lose its major daily would have been unthinkable before the recent nationwide plunge in advertising revenue. That dive has triggered a wave of newspaper bankruptcies and the closing of the Rocky Mountain News and the Seattle Post-Intelligencer.
A Globe shutdown would leave the city with only one daily newspaper, the tabloid Boston Herald, which has just 10 news reporters and is battling its own financial difficulties.I can’t help thinking of this scene:
-
Cognizant Seen Posting Higher Q1 Profit
Posted by Eddy Elfenbein on May 4th, 2009 at 11:48 amCognizant Technology Solutions (CTSH) reports tomorrow. Here’s a preview from Reuters:
IT service provider Cognizant Technology Solutions Corp (CTSH.O) is expected to post a higher first-quarter profit as it benefits from a stable and diversified customer base, even as the sector has been hit by delays in client decision-making and sluggish demand.
Analysts expect Cognizant to back its 2009 revenue outlook, citing its ability to handle pricing pressure and the offshore focus maintained by its largest customer, JPMorgan Chase (JPM.N).
“JPMorgan, among other banks, is probably in a better shape, and on top of that the bank seems to be continuing to have a very strong commitment to its offshore strategy,” Cowen & Co analyst Moshe Katri said by phone.
JPMorgan accounts for about 4 percent to 6 percent of Cognizant’s revenue, according to Katri. Other key customers include Pfizer Inc (PFE.N), eBay Inc (EBAY.O) and Credit Suisse (CSGN.VX).
“The better sentiment around financials and stock markets is an incremental positive as Cognizant gets 45 percent of revenue from the financial services sector,” UBS analyst Jason Kupferberg said.
For the first quarter, analysts on average expect the company to earn 37 cents a share, excluding items, on revenue of $735.4 million, according to Reuters Estimates. The company posted a profit of 34 cents a share in the year-earlier quarter.
In February, Cognizant had forecast 2009 full-year revenue of at least $3.1 billion. Analysts are expecting $3.06 billion.Cognizant is our second-best performing stock this year. It’s up more than 40%.
-
Buffett Attacks the Stress Test
Posted by Eddy Elfenbein on May 4th, 2009 at 10:59 amUS investor Warren Buffett has hit out at the government’s “stress tests” of US banks, saying they do not properly assess the industry’s health.
Mr Buffett’s Berkshire Hathaway company holds stakes in three banks that underwent the tests.
He said the tests ignored differences in business models, but added it was right the government try to save banks.
The results of the stress tests were due to be published on Monday, but have been delayed until Thursday.
Referring to Berkshire Hathaway’s holdings in Wells Fargo, US Bancorp and SunTrust Banks, he said, “I think I know their future, frankly, better that somebody that comes in to take a look.
“They may be using more of a checklist-type approach.”I was also glad to hear Buffett criticize the crazy practice of stock buy-backs.
-
Sysco’s Earnings Fall
Posted by Eddy Elfenbein on May 4th, 2009 at 10:55 amWhile the rest of the market is higher today, Sysco (SYY) is down modestly on its earnings report. Earnings were in line at 38 cents a share, down from 40 cents a year ago. Revenue declined 4.5% to $8.7 billion.
Overall, I like Sysco a lot. This is one of the most stable companies on the market. I recently pointed out that the stock has been an amazing performer after a Citigroup exec looked down on Sysco’s employees. -
Weekend Poll
Posted by Eddy Elfenbein on May 1st, 2009 at 8:24 pm -
Fiserv’s Earnings Still Growing
Posted by Eddy Elfenbein on May 1st, 2009 at 3:37 pmFiserv Inc. said its earnings from continuing operations increased in the first quarter, reflecting improved operating margins from the growth in sales of more profitable services.
The Brookfield-based provider of services and technology to the financial services industry reported income from continuing operations of $102 million, or 65 cents per share, compared with $99 million, or 60 cents per share, for the same period a year ago.
Continuing operations excludes the results of the firm’s 51-percent investment in the insurance business, which Fiserv (NASDAQ: FISV) sold in July 2008.
Revenue declined in the quarter to $1.04 billion from $1.31 billion. The decline in revenue was attributed in part to declines in the home equity processing business.
“Our results showcase the strength of our business model as we continue to deliver highly valued products and services across the financial services market,” said Jeffery Yabuki, president and CEO of Fiserv. “In spite of the expected revenue weakness in the quarter, we managed the business to optimize margins and grew adjusted earnings per share 10 percent.”
Fiserv continues to expect full-year 2009 adjusted earnings per share from continuing operations to be within a range of $3.61 to $3.75, which represents growth of 10 to 14 percent compared with $3.29 in 2008.Fiserv (FISV) is a good stock going for a good price. The shares got punished way too much during September and October.
Here’s the earnings call from Seeking Alpha. -
Strangest Graph You’ll See All Day
Posted by Eddy Elfenbein on May 1st, 2009 at 2:59 pmBear with me on this one. The long-term evidence suggests that the stock market’s total return outperforms inflation by about 7% a year (or doubling in real terms every ten years). That’s of course an average—the stock market has been dead flat against inflation for 12 years now.
Here’s a look at the stock market’s real total return, meaning with dividends and adjusted for inflation, divided by a line rising at 7% a year. In other words, a flat line is a real increase of 7% a year.
Just to make things even weirder, I used a log scale. The idea is to get the purest measure of the stock market’s performance.
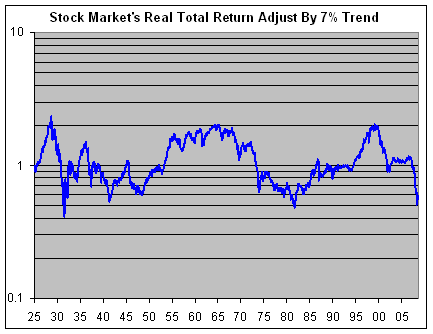
Since earnings growth tends to be fairly consistent, this line is surprisingly similar to a graph of price/earnings ratios. Of course, there’s no guarantee that stocks will continue to outperform inflation by 7% a year.
What I find interesting is that the peaks and valleys seem to line up well. Warning: It’s dangerous to see relationships where none may exist. Still, it’s kind of interesting. I think it’s also interesting to see that there are very long periods of out-performance and under-performance. Stock investing is hardly a game for all seasons. -
The Geography of Jobs
Posted by Eddy Elfenbein on April 30th, 2009 at 12:20 pm -
S&P 500 Heads for Best Month in 17 Years
Posted by Eddy Elfenbein on April 30th, 2009 at 11:07 amSince the March 9th closing low of 676.53, the S&P 500 has tacked on 29% through yesterday and we’ll probably make it to 31% with today’s gain. (BTW, the intra-day low was 666! AH AH AH AH AH!)
This will probably be the best month of the S&P 500 since December 1991. The index is still underwater for the year, but our Buy List is up 8.5% for the year and we’re now running 10% ahead of the market.
Boo-yah!
-
Archives
- July 2026
- June 2026
- May 2026
- April 2026
- March 2026
- February 2026
- January 2026
- December 2025
- November 2025
- October 2025
- September 2025
- August 2025
- July 2025
- June 2025
- May 2025
- April 2025
- March 2025
- February 2025
- January 2025
- December 2024
- November 2024
- October 2024
- September 2024
- August 2024
- July 2024
- June 2024
- May 2024
- April 2024
- March 2024
- February 2024
- January 2024
- December 2023
- November 2023
- October 2023
- September 2023
- August 2023
- July 2023
- June 2023
- May 2023
- April 2023
- March 2023
- February 2023
- January 2023
- December 2022
- November 2022
- October 2022
- September 2022
- August 2022
- July 2022
- June 2022
- May 2022
- April 2022
- March 2022
- February 2022
- January 2022
- December 2021
- November 2021
- October 2021
- September 2021
- August 2021
- July 2021
- June 2021
- May 2021
- April 2021
- March 2021
- February 2021
- January 2021
- December 2020
- November 2020
- October 2020
- September 2020
- August 2020
- July 2020
- June 2020
- May 2020
- April 2020
- March 2020
- February 2020
- January 2020
- December 2019
- November 2019
- October 2019
- September 2019
- August 2019
- July 2019
- June 2019
- May 2019
- April 2019
- March 2019
- February 2019
- January 2019
- December 2018
- November 2018
- October 2018
- September 2018
- August 2018
- July 2018
- June 2018
- May 2018
- April 2018
- March 2018
- February 2018
- January 2018
- December 2017
- November 2017
- October 2017
- September 2017
- August 2017
- July 2017
- June 2017
- May 2017
- April 2017
- March 2017
- February 2017
- January 2017
- December 2016
- November 2016
- October 2016
- September 2016
- August 2016
- July 2016
- June 2016
- May 2016
- April 2016
- March 2016
- February 2016
- January 2016
- December 2015
- November 2015
- October 2015
- September 2015
- August 2015
- July 2015
- June 2015
- May 2015
- April 2015
- March 2015
- February 2015
- January 2015
- December 2014
- November 2014
- October 2014
- September 2014
- August 2014
- July 2014
- June 2014
- May 2014
- April 2014
- March 2014
- February 2014
- January 2014
- December 2013
- November 2013
- October 2013
- September 2013
- August 2013
- July 2013
- June 2013
- May 2013
- April 2013
- March 2013
- February 2013
- January 2013
- December 2012
- November 2012
- October 2012
- September 2012
- August 2012
- July 2012
- June 2012
- May 2012
- April 2012
- March 2012
- February 2012
- January 2012
- December 2011
- November 2011
- October 2011
- September 2011
- August 2011
- July 2011
- June 2011
- May 2011
- April 2011
- March 2011
- February 2011
- January 2011
- December 2010
- November 2010
- October 2010
- September 2010
- August 2010
- July 2010
- June 2010
- May 2010
- April 2010
- March 2010
- February 2010
- January 2010
- December 2009
- November 2009
- October 2009
- September 2009
- August 2009
- July 2009
- June 2009
- May 2009
- April 2009
- March 2009
- February 2009
- January 2009
- December 2008
- November 2008
- October 2008
- September 2008
- August 2008
- July 2008
- June 2008
- May 2008
- April 2008
- March 2008
- February 2008
- January 2008
- December 2007
- November 2007
- October 2007
- September 2007
- August 2007
- July 2007
- June 2007
- May 2007
- April 2007
- March 2007
- February 2007
- January 2007
- December 2006
- November 2006
- October 2006
- September 2006
- August 2006
- July 2006
- June 2006
- May 2006
- April 2006
- March 2006
- February 2006
- January 2006
- December 2005
- November 2005
- October 2005
- September 2005
- August 2005
- July 2005
 Eddy Elfenbein is a Washington, DC-based speaker, portfolio manager and editor of the blog Crossing Wall Street. His