-
The Bears Nears Its First Birthday
Posted by Eddy Elfenbein on October 7th, 2008 at 11:08 amWe’re coming up to the one-year anniversary of the market top. The S&P 500 peaked at 1565.15 on October 9, 2007. Going by yesterday’s close, we’ve lost 32.47%. However, those losses have been heavily skewed toward Mondays.
Here’s the days-of-the-week breakdown:
Monday -26.65%
Tuesday +12.57%
Wednesday -7.33
Thursday -2.71%
Friday -9.29%
It appears that holding over the weekend is to be avoided. In fact, the combined performance of the three middle days of the week is a gain of 1.49%. The market has lost more than one-third on Monday and Friday combined. -
What Equity Premium?
Posted by Eddy Elfenbein on October 6th, 2008 at 2:52 pmOne of the fundamental tenants of finance is that stocks do better than bonds over the long haul. The difference is known as the equity risk premium. In other words, it’s the amount that investors are paid to take on the extra risk of owning stocks. (Small but important note: the equity risk premium most often refers to the gain stocks have over short-term T-bills, in this article I’m referring to the gain stocks have over long-term government and corporate bonds.)
The reason for the equity risk premium has puzzled economists for a long time. In fact, Jim Glassman and Kevin Hassett went so far as to say that it shouldn’t exist, and that’s how they got their Dow 36,000 hypothesis. I did some data-crunching today to add in the market’s recent performance and found that there really hasn’t been much of a premium for a long time. So were Glassman and Hassett correct in their theory except the wrote the book 20 years too late?? (Well, no…but I’ll get to that).
The best source for long-term investment information is Ibbotson Associates, now a part of Morningstar. Each year, Ibbotson releases its yearbook for historical returns of stocks, bonds, bills and inflation going back to 1926. I often refer to their work on this blog.
From the end of 1968 to the end of 2007, stocks’ advantage over bonds has been quite modest. Over 39 years, stocks have basically doubled both Treasuries and corporates. Doubling in 39 years may sound nice, but it really isn’t that impressive. It works to about 1.85% a year for corporate bonds and 1.89% for government bonds. Given how much more volatile stocks are, I don’t think you’re being paid a lot.
Since 2008 has been a horrible year for stocks, I was curious how these data sets have changes. I called Ibbotson but unfortunately, they don’t do any mid-year updates. So I want to see if I could find a reasonable estimate. Obviously using different data sources can alter your results, but I was looking for data that’s broadly considered fair.
For the S&P 500, Ibbotson uses the dividend reinvested S&P 500. For the first three quarters of 2008, that index is down 19.3%. For corporate bonds, they use Citigroup’s Long-Term High-Grade Corporate Bond Index and for the government bond, they use the 6.375 Treasury that matures in August 2027 (I assume they’ll use a 2028 bond for this year). I couldn’t find the stats on either of these that but I called Vanguard to see how some of their index funds were doing.
The Vanguard Long-Term Investment-Grade (VWESX) fund is down 7.39% this year, and the Vanguard Long-Term U.S. Treasury (VUSTX) is up 6.69% this year. I think both of these funds can serve as proxies (VWESX has a current yield of 6.69%, an average rating of A1 and an average maturity of 22.5 years; VUSTX has a yield of 3.86% and an average maturity of 17.5 years).
Tacking these numbers onto the data series, that makes the 39.75-year advantage stocks have over corporate bonds just 1.50%, and only 1.10% for government bonds. If we do a little data picking, we can see that long-term Treasury bonds have outperformed stocks since the summer of 1987, and come in just behind stocks since late 1980. Reasonable people can disagree but that certainly sounds like the long-term to me. This means that you could have sat out the entire stock market over the last 28 years, parked your money in long-term T-bonds and done just as well as the stock market, which we know beats the vast majority of fund managers. -
The S&P 500 and Earnings
Posted by Eddy Elfenbein on October 6th, 2008 at 1:25 pmAt times like this, I urge caution when looking at market statistics, but here’s the S&P 500 (blakc line, left scale) and its earnings (gold line, right scale).
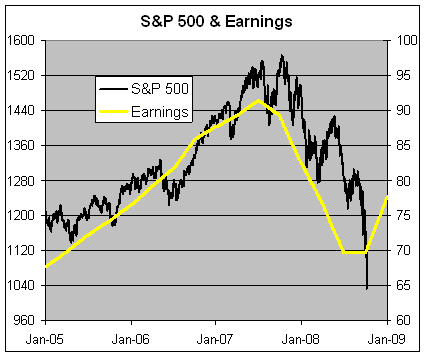
You’ll notice that I’ve scaled the two axises at a ratio of 16-to-1. That means whenever the lines cross, the market’s P/E Ratio is exactly 16.
The second-quarter earnings are all in, but we’re about to start the third-quarter earnings season, and we won’t know fourth-quarter for a few more months. As a result, the last two points on the earnings line are estimates. While the bump up in earnings line looks promising, we still don’t know what the future holds.
This could be a great buying opportunity, but as they say, we’ll know more when we’re a little older. -
60 Minutes on Credit Default Swaps
Posted by Eddy Elfenbein on October 6th, 2008 at 12:51 pm -
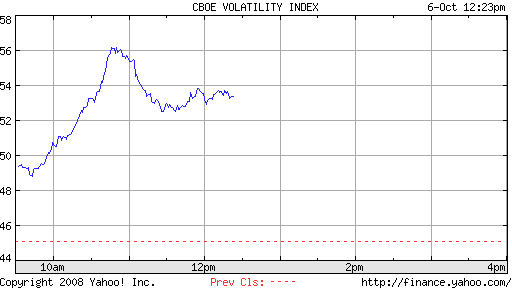
The VIX Broke 56
Posted by Eddy Elfenbein on October 6th, 2008 at 12:23 pmWow! The Dow is now off by over 500 points.
-
Meet the New Boss
Posted by Eddy Elfenbein on October 6th, 2008 at 10:29 amHank Paulson is due to name the person who will run the $700 billion bailout package. According to reports, Neel Kashkari will oversee the program. Take a guess where Mr. Kashkari used to work. I’ll give you a hint: it rhymes with Boldman Hacks.
-
Lehman’s Last Days
Posted by Eddy Elfenbein on October 6th, 2008 at 10:25 amIn today’s must-read article, the WSJ has Lehman Brothers dead to rights:
In the weeks before it collapsed, Lehman Brothers Holdings Inc. went to great lengths to conceal how fast it was careening toward the financial precipice.
The ailing securities firm quietly tapped the European Central Bank and the Federal Reserve as financial lifelines. On Sept. 10, one day after Lehman executives calculated the firm needed at least $3 billion in fresh capital, the firm assured investors on a conference call it needed no new capital at all. Lehman said its massive real-estate portfolio was valued properly, but Wall Street executives who have seen it say it was overvalued by more than $10 billion. As hedge-fund clients began yanking their money from Lehman, the firm assured them it was on solid financial footing.
On Sept. 11, J.P. Morgan Chase & Co. effectively ended Lehman’s campaign to appear strong. In its capacity as a middleman between Lehman and its clients, J.P. Morgan knew more about Lehman’s predicament than most outsiders, and it didn’t like what it saw. J.P. Morgan demanded from Lehman $5 billion in additional collateral — easy-to-sell securities to cover lending positions that J.P. Morgan’s clients had with Lehman — repeating an unmet request from a week earlier, people familiar with the situation say.
It was a knockout blow. That $5 billion collateral call, coupled with a huge outflow of money from Lehman’s hedge-fund clients, so weakened the 158-year-old Wall Street firm that it sought Chapter 11 bankruptcy protection four days later.The worst thing a bank can do is have people lose confidence in it. At one point, Lehman said its Level 3 assets were up 9% while the stock market was down 10%. When people called fouled, the bank got mad at the messengers. That’s a sign right there that things aren’t going well.
Ultimately, a bank’s product is trust. That’s what they sell. So a bank in trouble has to exude confidence even though it may be crumbling internally. If you look weak, clients will abandon you and you’ll become weak. -
Once More unto the Breach
Posted by Eddy Elfenbein on October 6th, 2008 at 10:01 amThe market is getting smacked around again. As I write this, the Dow is off over 300 points and we’re below 10,000. This takes us back to the beginning of 1999. The good news is that commodities are also down, so at least investors aren’t seeking refuge there.
Things are even worse in Russia where the stock market was shut down for the second time. The MICEX plunged 16.7% before trading was halted.In September, growing financial turmoil in the United States and a wave of margin calls sent the Russian stock markets into their biggest downward spiral since 1998. The MICEX lost 25 percent in just three days, and prompted regulators to shut down the markets to stem the decline. They have since used that tool on several occasions when drops have become severe – to lesser effect.
Russia’s stock market in recent years has boomed amid high prices for oil and natural gas. But it began falling sharply in midsummer amid concerns about government interference with businesses, and the drop accelerated as the global economic crisis intensified. Oil prices, the backbone of Russia’s economy, have been sharply down in recent days – dropping to $90 a barrel – and investors have also been spooked by August’s five-day war between Russia and Georgia. The RTS is now down by 62 percent from its May peak. -
Uh Oh
Posted by Eddy Elfenbein on October 3rd, 2008 at 6:00 pm
I wonder if this is some sort of metaphor:Armed Bank Robbers Hit Wachovia in Northwest D.C.
WASHINGTON, D.C. – Police in the District are searching for a pair of armed bank robbers who burst into a Wachovia Bank in Northwest D.C. on Friday afternoon and demanded cash from the teller.
Investigators say it happened just as people were sitting down to lunch outside the Wachovia Bank on Connecticut Avenue NW near Van Ness. They say one of the robbers was armed with a shotgun and the other with a handgun.
According to police, the two men ordered the teller to open the vault, and then pistol-whipped her when she couldn’t. They say instead, the men bagged cash from the drawers and then took off.
One witness who asked not to be identified told FOX 5 that’s when he encountered the suspects up close.
“Two guys came running by the building and I bumped into one of them, brushed him and see his– what looks like a gun he’s carrying– and the two of them carrying garbage bags with what looks like money,” the witness told FOX 5. -
Below 1100
Posted by Eddy Elfenbein on October 3rd, 2008 at 4:20 pmThe S&P 500 closed below 1100 for the first time in four years. The index finished the day at 1099.23. The S&P 500 first closed above 1100 over ten years ago, on March 24, 1998. The last time the S&P 500 closed below 1100 was on October 25, 2004.
- Load More
Gotta hear both sides.
"Model from California killed, castrated, cooked and then ate her husband"I apologize for my last tweet. I should not have said Alderaan "had it coming" and they "got what they deserved." Some of my best friends are Alderaanian. I'm learning. I'm growing.
You can do very well by betting on the big winners before they became the big winners.
-
-
Archives
- June 2025
- May 2025
- April 2025
- March 2025
- February 2025
- January 2025
- December 2024
- November 2024
- October 2024
- September 2024
- August 2024
- July 2024
- June 2024
- May 2024
- April 2024
- March 2024
- February 2024
- January 2024
- December 2023
- November 2023
- October 2023
- September 2023
- August 2023
- July 2023
- June 2023
- May 2023
- April 2023
- March 2023
- February 2023
- January 2023
- December 2022
- November 2022
- October 2022
- September 2022
- August 2022
- July 2022
- June 2022
- May 2022
- April 2022
- March 2022
- February 2022
- January 2022
- December 2021
- November 2021
- October 2021
- September 2021
- August 2021
- July 2021
- June 2021
- May 2021
- April 2021
- March 2021
- February 2021
- January 2021
- December 2020
- November 2020
- October 2020
- September 2020
- August 2020
- July 2020
- June 2020
- May 2020
- April 2020
- March 2020
- February 2020
- January 2020
- December 2019
- November 2019
- October 2019
- September 2019
- August 2019
- July 2019
- June 2019
- May 2019
- April 2019
- March 2019
- February 2019
- January 2019
- December 2018
- November 2018
- October 2018
- September 2018
- August 2018
- July 2018
- June 2018
- May 2018
- April 2018
- March 2018
- February 2018
- January 2018
- December 2017
- November 2017
- October 2017
- September 2017
- August 2017
- July 2017
- June 2017
- May 2017
- April 2017
- March 2017
- February 2017
- January 2017
- December 2016
- November 2016
- October 2016
- September 2016
- August 2016
- July 2016
- June 2016
- May 2016
- April 2016
- March 2016
- February 2016
- January 2016
- December 2015
- November 2015
- October 2015
- September 2015
- August 2015
- July 2015
- June 2015
- May 2015
- April 2015
- March 2015
- February 2015
- January 2015
- December 2014
- November 2014
- October 2014
- September 2014
- August 2014
- July 2014
- June 2014
- May 2014
- April 2014
- March 2014
- February 2014
- January 2014
- December 2013
- November 2013
- October 2013
- September 2013
- August 2013
- July 2013
- June 2013
- May 2013
- April 2013
- March 2013
- February 2013
- January 2013
- December 2012
- November 2012
- October 2012
- September 2012
- August 2012
- July 2012
- June 2012
- May 2012
- April 2012
- March 2012
- February 2012
- January 2012
- December 2011
- November 2011
- October 2011
- September 2011
- August 2011
- July 2011
- June 2011
- May 2011
- April 2011
- March 2011
- February 2011
- January 2011
- December 2010
- November 2010
- October 2010
- September 2010
- August 2010
- July 2010
- June 2010
- May 2010
- April 2010
- March 2010
- February 2010
- January 2010
- December 2009
- November 2009
- October 2009
- September 2009
- August 2009
- July 2009
- June 2009
- May 2009
- April 2009
- March 2009
- February 2009
- January 2009
- December 2008
- November 2008
- October 2008
- September 2008
- August 2008
- July 2008
- June 2008
- May 2008
- April 2008
- March 2008
- February 2008
- January 2008
- December 2007
- November 2007
- October 2007
- September 2007
- August 2007
- July 2007
- June 2007
- May 2007
- April 2007
- March 2007
- February 2007
- January 2007
- December 2006
- November 2006
- October 2006
- September 2006
- August 2006
- July 2006
- June 2006
- May 2006
- April 2006
- March 2006
- February 2006
- January 2006
- December 2005
- November 2005
- October 2005
- September 2005
- August 2005
- July 2005
 Eddy Elfenbein is a Washington, DC-based speaker, portfolio manager and editor of the blog Crossing Wall Street. His