-
Bed Bath & Beyond Earns 30 Cents a Share
Posted by Eddy Elfenbein on June 27th, 2008 at 12:13 amYesterday, Bed Bath & Beyond (BBBY) reported first-quarter earnings of 30 cents a share, three cents better than Street estimates.
The first quarter (March, April and May) tends to be the company’s slowest quarter. Since I’ve defended this stock for years, you probably won’t be surprised to hear me say that I’m pleased with these results. Sales rose by 6.1%, and sales-per-share rose by 13.9%.
The big thing that hurt the company was declining profit margins. For the 11th straight quarter, year-over-year net margins declined. That really takes a bite out of a company’s bottomline. Compared with the first quarter three years ago, BBBY’s sales are up 32.5%. Yet net income is down by over 22%. That’s what happens when your margins nearly fall in half.
On the conference call, BBBY expects Q2 EPS of 43 to 48 cents compared with 55 cents last year.
Here are the earnings results going back a few years:Quarter Sales Gross Profit Operating Profit Net Profit EPS $356,633 $146,214 $28,015 $17,883 $0.06 $451,715 $185,570 $53,580 $33,247 $0.12 $480,145 $196,784 $50,607 $31,707 $0.11 $569,012 $238,233 $77,138 $48,392 $0.17 $459,163 $187,293 $36,339 $23,364 $0.08 $589,381 $241,284 $70,009 $43,578 $0.15 $602,004 $246,080 $64,592 $40,665 $0.14 $746,107 $311,802 $101,898 $64,315 $0.22 $575,833 $234,959 $45,602 $30,007 $0.10 $713,636 $291,342 $84,672 $53,954 $0.18 $759,438 $311,030 $83,749 $52,964 $0.18 $879,055 $370,235 $132,077 $82,674 $0.28 $776,798 $318,362 $72,701 $46,299 $0.15 $903,044 $370,335 $119,687 $75,459 $0.25 $936,030 $386,224 $119,228 $75,112 $0.25 $1,049,292 $443,626 $168,441 $105,309 $0.35 $893,868 $367,180 $90,450 $57,508 $0.19 $1,111,445 $459,145 $155,867 $97,208 $0.32 $1,174,740 $486,987 $161,459 $100,506 $0.33 $1,297,928 $563,352 $231,567 $144,248 $0.47 $1,100,917 $456,774 $128,707 $82,049 $0.27 $1,273,960 $530,829 $189,108 $120,008 $0.39 $1,305,155 $548,152 $190,978 $121,927 $0.40 $1,467,646 $650,546 $283,621 $180,980 $0.59 $1,244,421 $520,781 $150,884 $98,903 $0.33 $1,431,182 $601,784 $217,877 $141,402 $0.47 $1,448,680 $615,363 $205,493 $134,620 $0.45 $1,685,279 $747,820 $304,917 $197,922 $0.67 $1,395,963 $590,098 $148,750 $100,431 $0.35 $1,607,239 $678,249 $219,622 $145,535 $0.51 $1,619,240 $704,073 $211,134 $142,436 $0.50 $1,994,987 $862,982 $309,895 $205,842 $0.72 $1,553,293 $646,109 $154,391 $104,647 $0.38 $1,767,716 $732,158 $211,037 $147,008 $0.55 $1,794,747 $747,866 $203,152 $138,232 $0.52 $1,933,186 $799,098 $259,442 $172,921 $0.66 $1,648,491 $656,000 $118,819 $76,777 $0.30 -
The Constitution Stirs
Posted by Eddy Elfenbein on June 26th, 2008 at 5:17 pmFinally.
I live right by one of the largest police stations in DC, yet there was an armed robbery directly across the street a few days ago.
For the record, until today, all handguns were banned in DC. Shotguns and rifles are allowed. You just have to keep them unloaded and disassembled. -
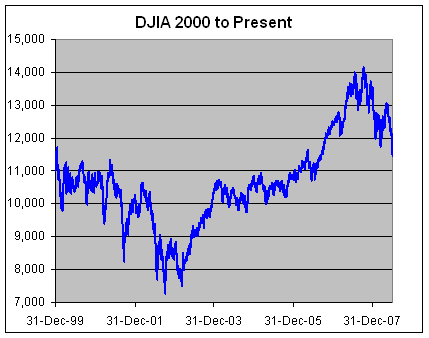
The Dow is Now Down for the Millennium
Posted by Eddy Elfenbein on June 26th, 2008 at 3:47 pmThe Dow closed at 11,453.42 which means the index is now in the red for the millennium. The Dow closed December 31, 1999 at 11,497.12.
Of course, that doesn’t include dividends. Over the last 8.5 years, dividends have added about 19.5% to the Dow’s total return.
All 30 stocks were down today. In percentage terms, today was the third worst day for the Dow in the last five years. The 3.13% sell-off from three weeks ago was slightly worse. Today was the 10th 300+ point sell-off in the last twelve months.
The Dow is now at its lowest close since 9/11/2006. The S&P 500 wasn’t down as much, and it’s still holding above its closing low from March 10 and March 17.
For the millennium, the S&P 500 is off 12.7%.
Here’s something you don’t see every day. On the NYSE, decliners led advancers by 11-to-2. But advancing volume and declining volume were roughly equal.
-
GM Hits a 34-Year Low
Posted by Eddy Elfenbein on June 26th, 2008 at 10:15 amGoldman cuts General Motors (GM) to Sell. The stock is down over 11% today.
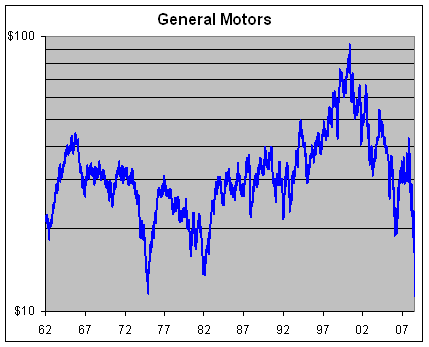
Update: Make that a 53-year low. -
First-Quarter GDP Revised Higher
Posted by Eddy Elfenbein on June 26th, 2008 at 9:45 amThe government slightly raised its estimate of first-quarter GDP growth from 0.9% to 1.0%.
The figure was initially reported in April at an anemic 0.6 percent, fueling concerns that the U.S. economy may be slipping into recession. However, those concerns have subsided as fresh data showed healthier growth, particularly in consumer spending and exports.
Consumer spending, which accounts for more than two-thirds of national economic activity, rose at a 1.1 percent rate in the quarter, slightly ahead of the preliminary estimate of 1 percent last month. Despite that upward revision, consumer spending posted its smallest gain since the second quarter of 2001, which was during the last recession.This the sixth time in the last eight quarters that GDP has come in below the long-term trend of 3%.
-
Count De Monet
Posted by Eddy Elfenbein on June 25th, 2008 at 4:21 pm
At Christie’s, they were looking to sell Monet’s “Le Bassin aux Nymphéas” (above) for $36 million to $47 million. The winning bid was for $80.4 million. -
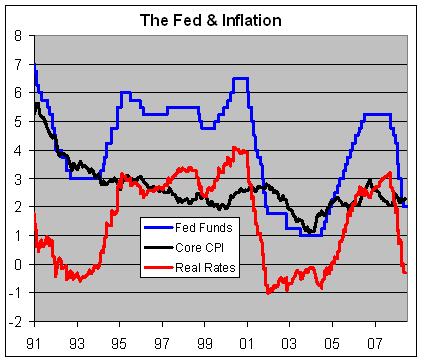
No Change
Posted by Eddy Elfenbein on June 25th, 2008 at 2:15 pmHere’s the Fed’s latest statement:
The Federal Open Market Committee decided today to keep its target for the federal funds rate at 2 percent.
Recent information indicates that overall economic activity continues to expand, partly reflecting some firming in household spending. However, labor markets have softened further and financial markets remain under considerable stress. Tight credit conditions, the ongoing housing contraction, and the rise in energy prices are likely to weigh on economic growth over the next few quarters.
The Committee expects inflation to moderate later this year and next year. However, in light of the continued increases in the prices of energy and some other commodities and the elevated state of some indicators of inflation expectations, uncertainty about the inflation outlook remains high.
The substantial easing of monetary policy to date, combined with ongoing measures to foster market liquidity, should help to promote moderate growth over time. Although downside risks to growth remain, they appear to have diminished somewhat, and the upside risks to inflation and inflation expectations have increased. The Committee will continue to monitor economic and financial developments and will act as needed to promote sustainable economic growth and price stability.
Voting for the FOMC monetary policy action were: Ben S. Bernanke, Chairman; Timothy F. Geithner, Vice Chairman; Donald L. Kohn; Randall S. Kroszner; Frederic S. Mishkin; Sandra Pianalto; Charles I. Plosser; Gary H. Stern; and Kevin M. Warsh. Voting against was Richard W. Fisher, who preferred an increase in the target for the federal funds rate at this meeting.Ron Isana summed it up well by saying that this statement has nothing for everyone.
-
Quote of the Day
Posted by Eddy Elfenbein on June 25th, 2008 at 10:16 amThe Oracle of Omaha speaks:
Warren Buffett is in Toronto, fielding questions from a crowd of 300 executives. One asks what makes people want to sell their companies to him.
The Berkshire Hathaway Inc. chief executive officer replies that he tells a prospective seller to think of the company as a work of art.
“You can sell it to Berkshire, and we’ll put it in the Metropolitan Museum; it’ll have a wing all by itself; it’ll be there forever,” he says at the February meeting. “Or you can sell it to some porn shop operator, and he’ll take the painting and he’ll make the boobs a little bigger and he’ll stick it up in the window, and some other guy will come along in a raincoat, and he’ll buy it.” -
Why Soccer Will Never Be Really Big Here
Posted by Eddy Elfenbein on June 24th, 2008 at 2:39 pmI just looked at the numbers of the Euro 2008 tournament. So far, there have been 28 games. The team that scores first has gone 20-3-3! Two other games have been 0-0 ties. Remarkably, the Turks have won two of the tournament’s three come-from-behind victories.
That’s one of the problems I have with soccer, come-from-behind wins are so rare. The U.S. is a country built on the idea of coming from behind to upset the champs.
I admire the athleticism of the players, and I think it’s fascinating that most of them look like guys you could see walking down street (unlike a pro football or basketball player). But I’m sorry, there has to be more scoreboard action. If you score the first goal, you basically have the game wrapped up. Do they just run out the clock? In baseball, scoring the first is good, but it’s just a start.
I’m curious what the equivalent start you need in baseball or football to have something close to a 20-3-3 record. My guess is that you need a 6-0 lead in baseball, and a 17-0 lead in football. -
From Another Credit Crunch
Posted by Eddy Elfenbein on June 24th, 2008 at 11:54 amThe New York Times from November 1991:
Is the credit crunch real? Are banks denying creditworthy businesses the loans they need to invest the economy out of the recession?
The idea certainly appeals to the White House, which is in hot pursuit of a villain or three to explain why the stalled recovery is not the President’s fault. But many economists remain skeptical. The fall in the volume of bank loans, they point out, could be explained equally well by a recession-induced decline in the demand for credit.
Or at least it could until now. Minds are bound to be changed by the release of the first serious analysis of the crunch hypothesis, by Ben Bernanke of Princeton University and Cara Lown of the New York Federal Reserve Bank. The study, to be published in the January issue of the Brookings Papers on Economic Activity, confirms that a scarcity of bank capital has indeed affected the supply of loans. But the two economists believe that the full weight has been felt only in the Northeast. And they say the impact on jobs and incomes may be smaller than anecdotes of businesses’ drying up for want of liquidity would suggest.
-
Archives
- June 2026
- May 2026
- April 2026
- March 2026
- February 2026
- January 2026
- December 2025
- November 2025
- October 2025
- September 2025
- August 2025
- July 2025
- June 2025
- May 2025
- April 2025
- March 2025
- February 2025
- January 2025
- December 2024
- November 2024
- October 2024
- September 2024
- August 2024
- July 2024
- June 2024
- May 2024
- April 2024
- March 2024
- February 2024
- January 2024
- December 2023
- November 2023
- October 2023
- September 2023
- August 2023
- July 2023
- June 2023
- May 2023
- April 2023
- March 2023
- February 2023
- January 2023
- December 2022
- November 2022
- October 2022
- September 2022
- August 2022
- July 2022
- June 2022
- May 2022
- April 2022
- March 2022
- February 2022
- January 2022
- December 2021
- November 2021
- October 2021
- September 2021
- August 2021
- July 2021
- June 2021
- May 2021
- April 2021
- March 2021
- February 2021
- January 2021
- December 2020
- November 2020
- October 2020
- September 2020
- August 2020
- July 2020
- June 2020
- May 2020
- April 2020
- March 2020
- February 2020
- January 2020
- December 2019
- November 2019
- October 2019
- September 2019
- August 2019
- July 2019
- June 2019
- May 2019
- April 2019
- March 2019
- February 2019
- January 2019
- December 2018
- November 2018
- October 2018
- September 2018
- August 2018
- July 2018
- June 2018
- May 2018
- April 2018
- March 2018
- February 2018
- January 2018
- December 2017
- November 2017
- October 2017
- September 2017
- August 2017
- July 2017
- June 2017
- May 2017
- April 2017
- March 2017
- February 2017
- January 2017
- December 2016
- November 2016
- October 2016
- September 2016
- August 2016
- July 2016
- June 2016
- May 2016
- April 2016
- March 2016
- February 2016
- January 2016
- December 2015
- November 2015
- October 2015
- September 2015
- August 2015
- July 2015
- June 2015
- May 2015
- April 2015
- March 2015
- February 2015
- January 2015
- December 2014
- November 2014
- October 2014
- September 2014
- August 2014
- July 2014
- June 2014
- May 2014
- April 2014
- March 2014
- February 2014
- January 2014
- December 2013
- November 2013
- October 2013
- September 2013
- August 2013
- July 2013
- June 2013
- May 2013
- April 2013
- March 2013
- February 2013
- January 2013
- December 2012
- November 2012
- October 2012
- September 2012
- August 2012
- July 2012
- June 2012
- May 2012
- April 2012
- March 2012
- February 2012
- January 2012
- December 2011
- November 2011
- October 2011
- September 2011
- August 2011
- July 2011
- June 2011
- May 2011
- April 2011
- March 2011
- February 2011
- January 2011
- December 2010
- November 2010
- October 2010
- September 2010
- August 2010
- July 2010
- June 2010
- May 2010
- April 2010
- March 2010
- February 2010
- January 2010
- December 2009
- November 2009
- October 2009
- September 2009
- August 2009
- July 2009
- June 2009
- May 2009
- April 2009
- March 2009
- February 2009
- January 2009
- December 2008
- November 2008
- October 2008
- September 2008
- August 2008
- July 2008
- June 2008
- May 2008
- April 2008
- March 2008
- February 2008
- January 2008
- December 2007
- November 2007
- October 2007
- September 2007
- August 2007
- July 2007
- June 2007
- May 2007
- April 2007
- March 2007
- February 2007
- January 2007
- December 2006
- November 2006
- October 2006
- September 2006
- August 2006
- July 2006
- June 2006
- May 2006
- April 2006
- March 2006
- February 2006
- January 2006
- December 2005
- November 2005
- October 2005
- September 2005
- August 2005
- July 2005
 Eddy Elfenbein is a Washington, DC-based speaker, portfolio manager and editor of the blog Crossing Wall Street. His